Scoring of COVID-19 severity in X-ray imaging
Summary
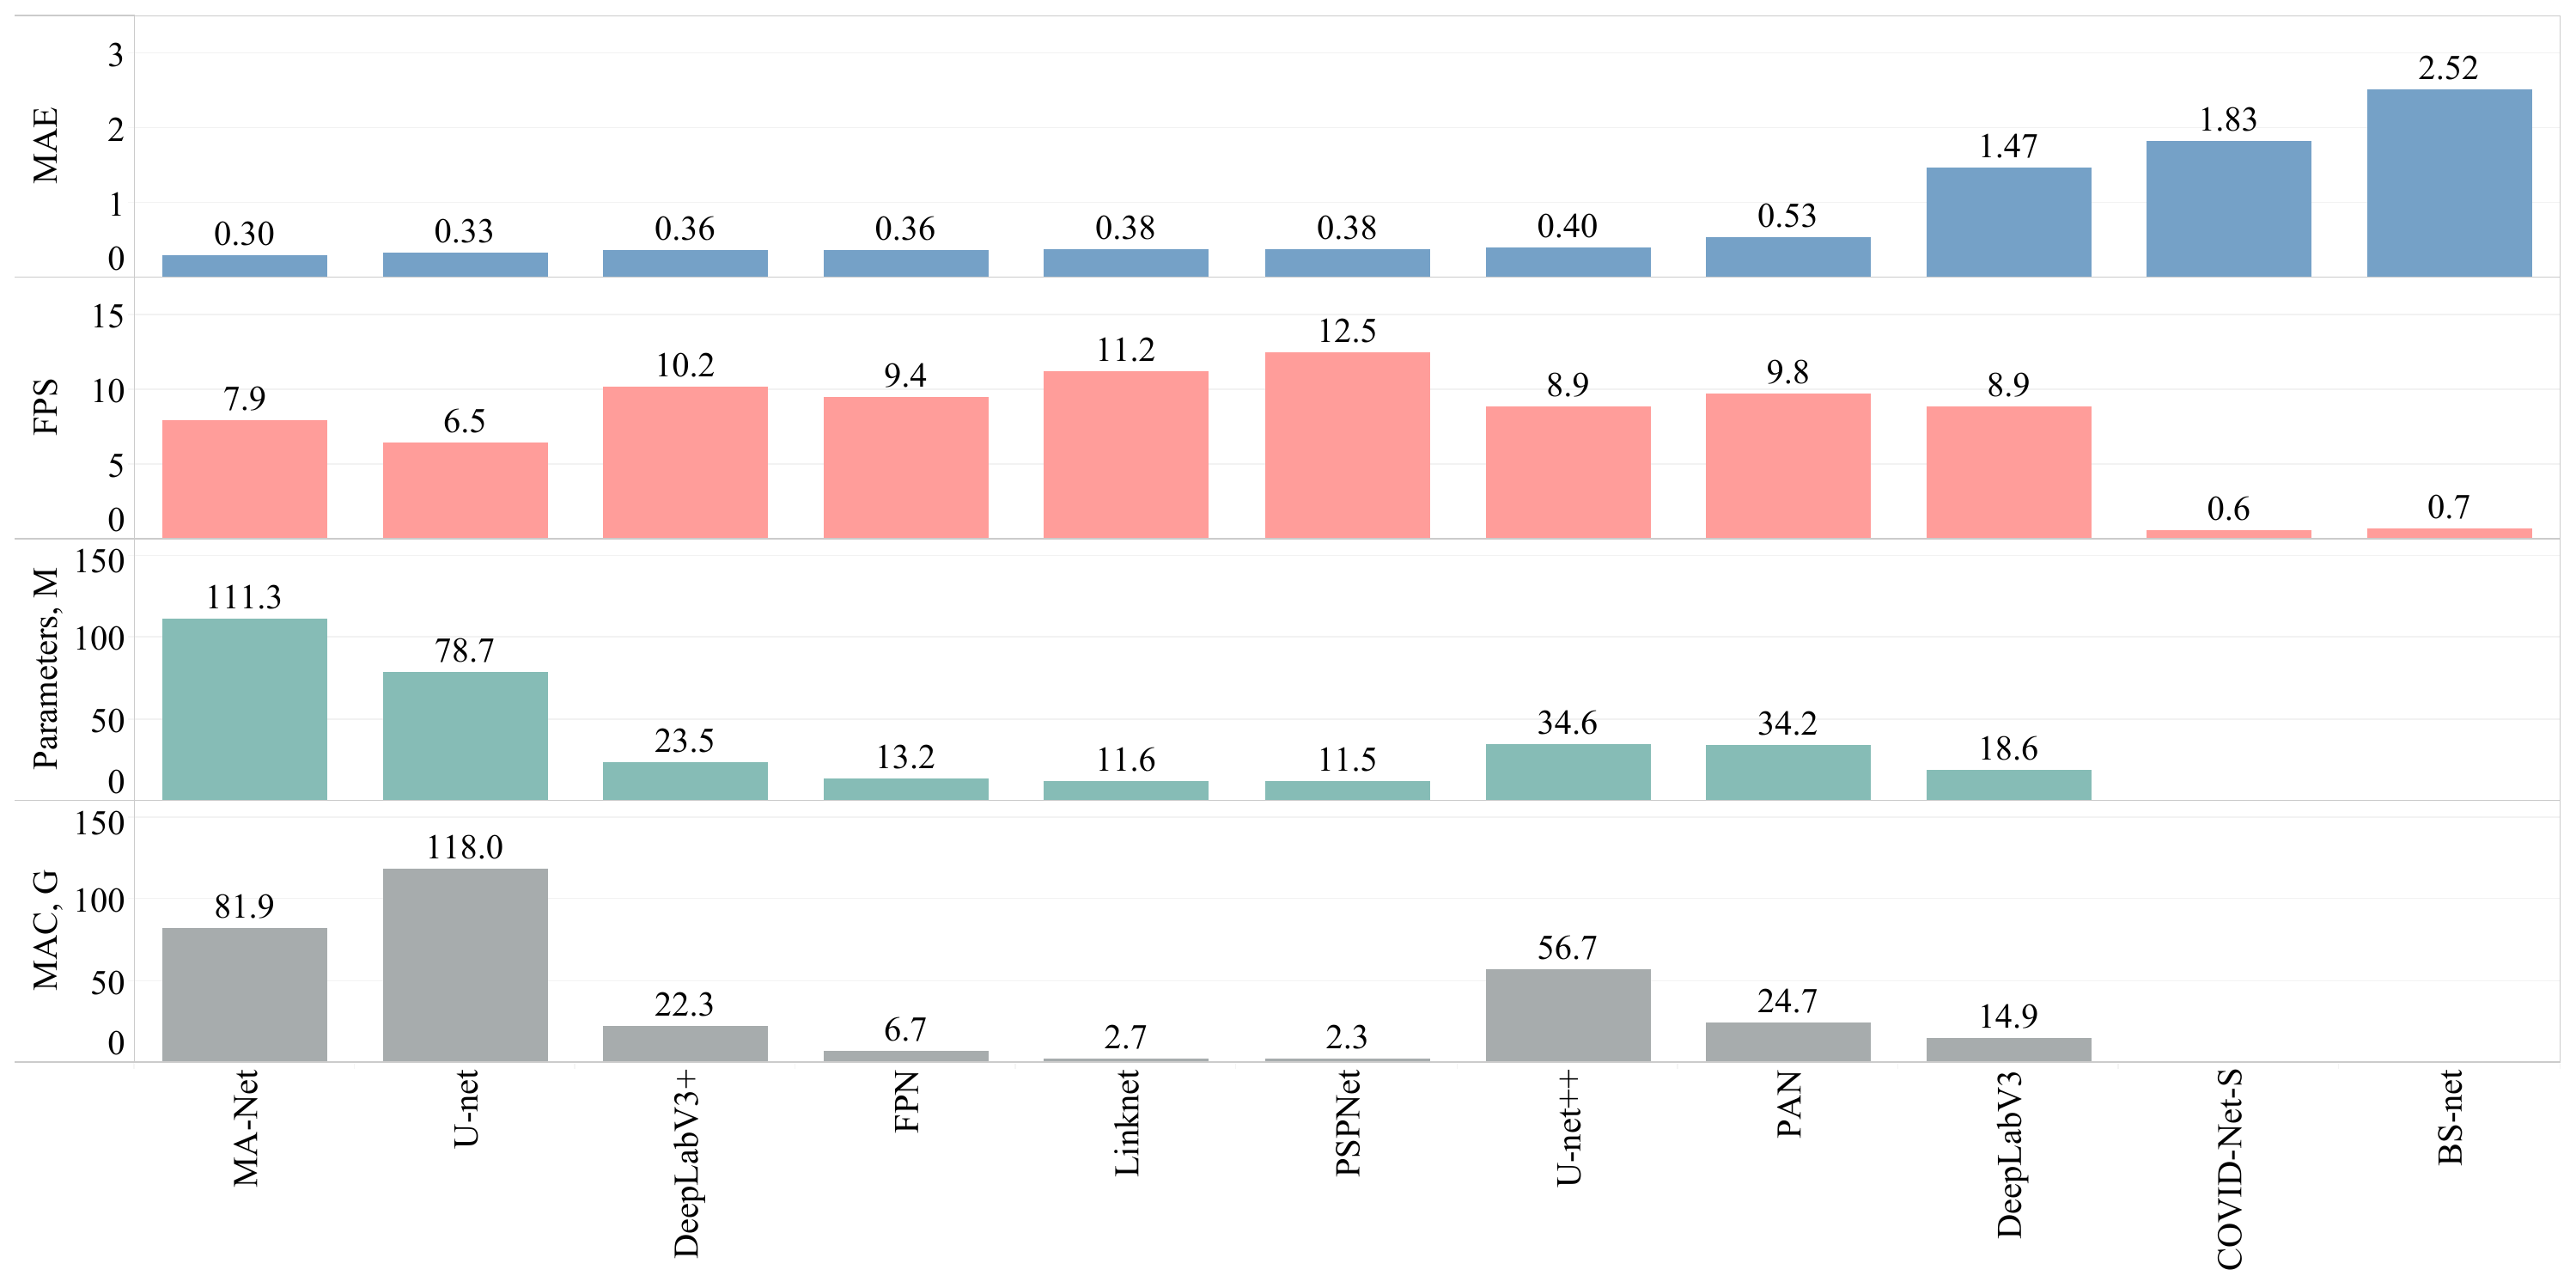
In this project, we propose a two-stage workflow used for the segmentation and scoring of lung diseases. The workflow inherits quantification, qualification, and visual assessment of lung diseases on X-ray images estimated by radiologists and clinicians. It requires the fulfillment of two core stages devoted to lung and disease segmentation as well as an additional post-processing stage devoted to scoring. The latter integrated block is utilized, mainly, for the estimation of segment scores and computes the overall severity score of a patient. The models of the proposed workflow were trained and tested on four publicly available X-ray datasets of COVID-19 patients and two X-ray datasets of patients with no pulmonary pathology. Based on a combined dataset consisting of 580 COVID-19 patients and 784 patients with no disorders, our best-performing algorithm is based on a combination of DeepLabV3+, for lung segmentation, and MA-Net, for disease segmentation. The proposed algorithms’ mean absolute error (MAE) of 0.30 is significantly reduced in comparison to established COVID-19 algorithms; BS-net and COVID-Net-S, possessing MAEs of 2.52 and 1.83 respectively. Moreover, the proposed two-stage workflow was not only more accurate but also computationally efficient, it was approximately 11 times faster than the mentioned methods. In summary, we proposed an accurate, time-efficient, and versatile approach for segmentation and scoring of lung diseases illustrated for COVID-19 and with broader future applications for pneumonia, tuberculosis, pneumothorax, amongst others.
Contribution
To determine the most optimal workflow we evaluated nine state-of-the-art lung and disease segmentation networks and found the best performing configurations as determined by the combined accuracy and complexity. The latter is of particular importance as it allows the broader scientific community to adopt the determined hyper-parameters for further research, extending beyond the scope of this work. To study algorithm performance, we collected, cleaned, and pre-processed three lung segmentation datasets as well as four disease segmentation and scoring datasets acquired for COVID-19 and pneumonia-infected patients. The datasets are made publicly available (Chest X-ray dataset for lung segmentation and Dataset for COVID-19 segmentation and severity scoring). We compared our results against two known tailor-made solutions, BS-net and COVID-Net-S. The obtained segmentation models are also made publicly available on Git LFS.
Data
Stage I: Lung Segmentation
Table 1. Description of the datasets used for lung segmentation
| Dataset | Training | Validation | Testing | Total |
|---|---|---|---|---|
| Darwin | 4884 | 611 | 611 | 6106 / 90% |
| Montgomery | 110 | 14 | 14 | 138 / 2% |
| Shenzhen | 452 | 57 | 57 | 566 / 8% |
| Total | 5446 / 80% | 682 / 10% | 682 / 10% | 6810 / 100% |
Stage II: Disease Segmentation and Scoring
Table 2. Description of the datasets used for COVID-19 segmentation and scoring
| Dataset | COVID-19 | Normal | Training | Validation | Testing | Total |
|---|---|---|---|---|---|---|
| ACCD | 49 | 0 | 39 | 5 | 5 | 49 / 4% |
| CRD | 104 | 0 | 83 | 10 | 11 | 104 / 8% |
| CCXD | 399 | 0 | 319 | 40 | 40 | 399 / 29% |
| FCXD | 28 | 0 | 22 | 3 | 3 | 28 / 2% |
| CXN | 0 | 431 | 344 | 43 | 44 | 431 / 31% |
| RSNA | 0 | 353 | 282 | 35 | 36 | 353 / 26% |
| Total | 580 / 43% | 784 / 57% | 1089 / 80% | 136 / 10% | 139 / 10% | 1364 / 100% |
Workflow overview
Figure 1. Schematic illustration of the proposed workflow
Results
Figure 2. Overall comparison of the obtained solutions
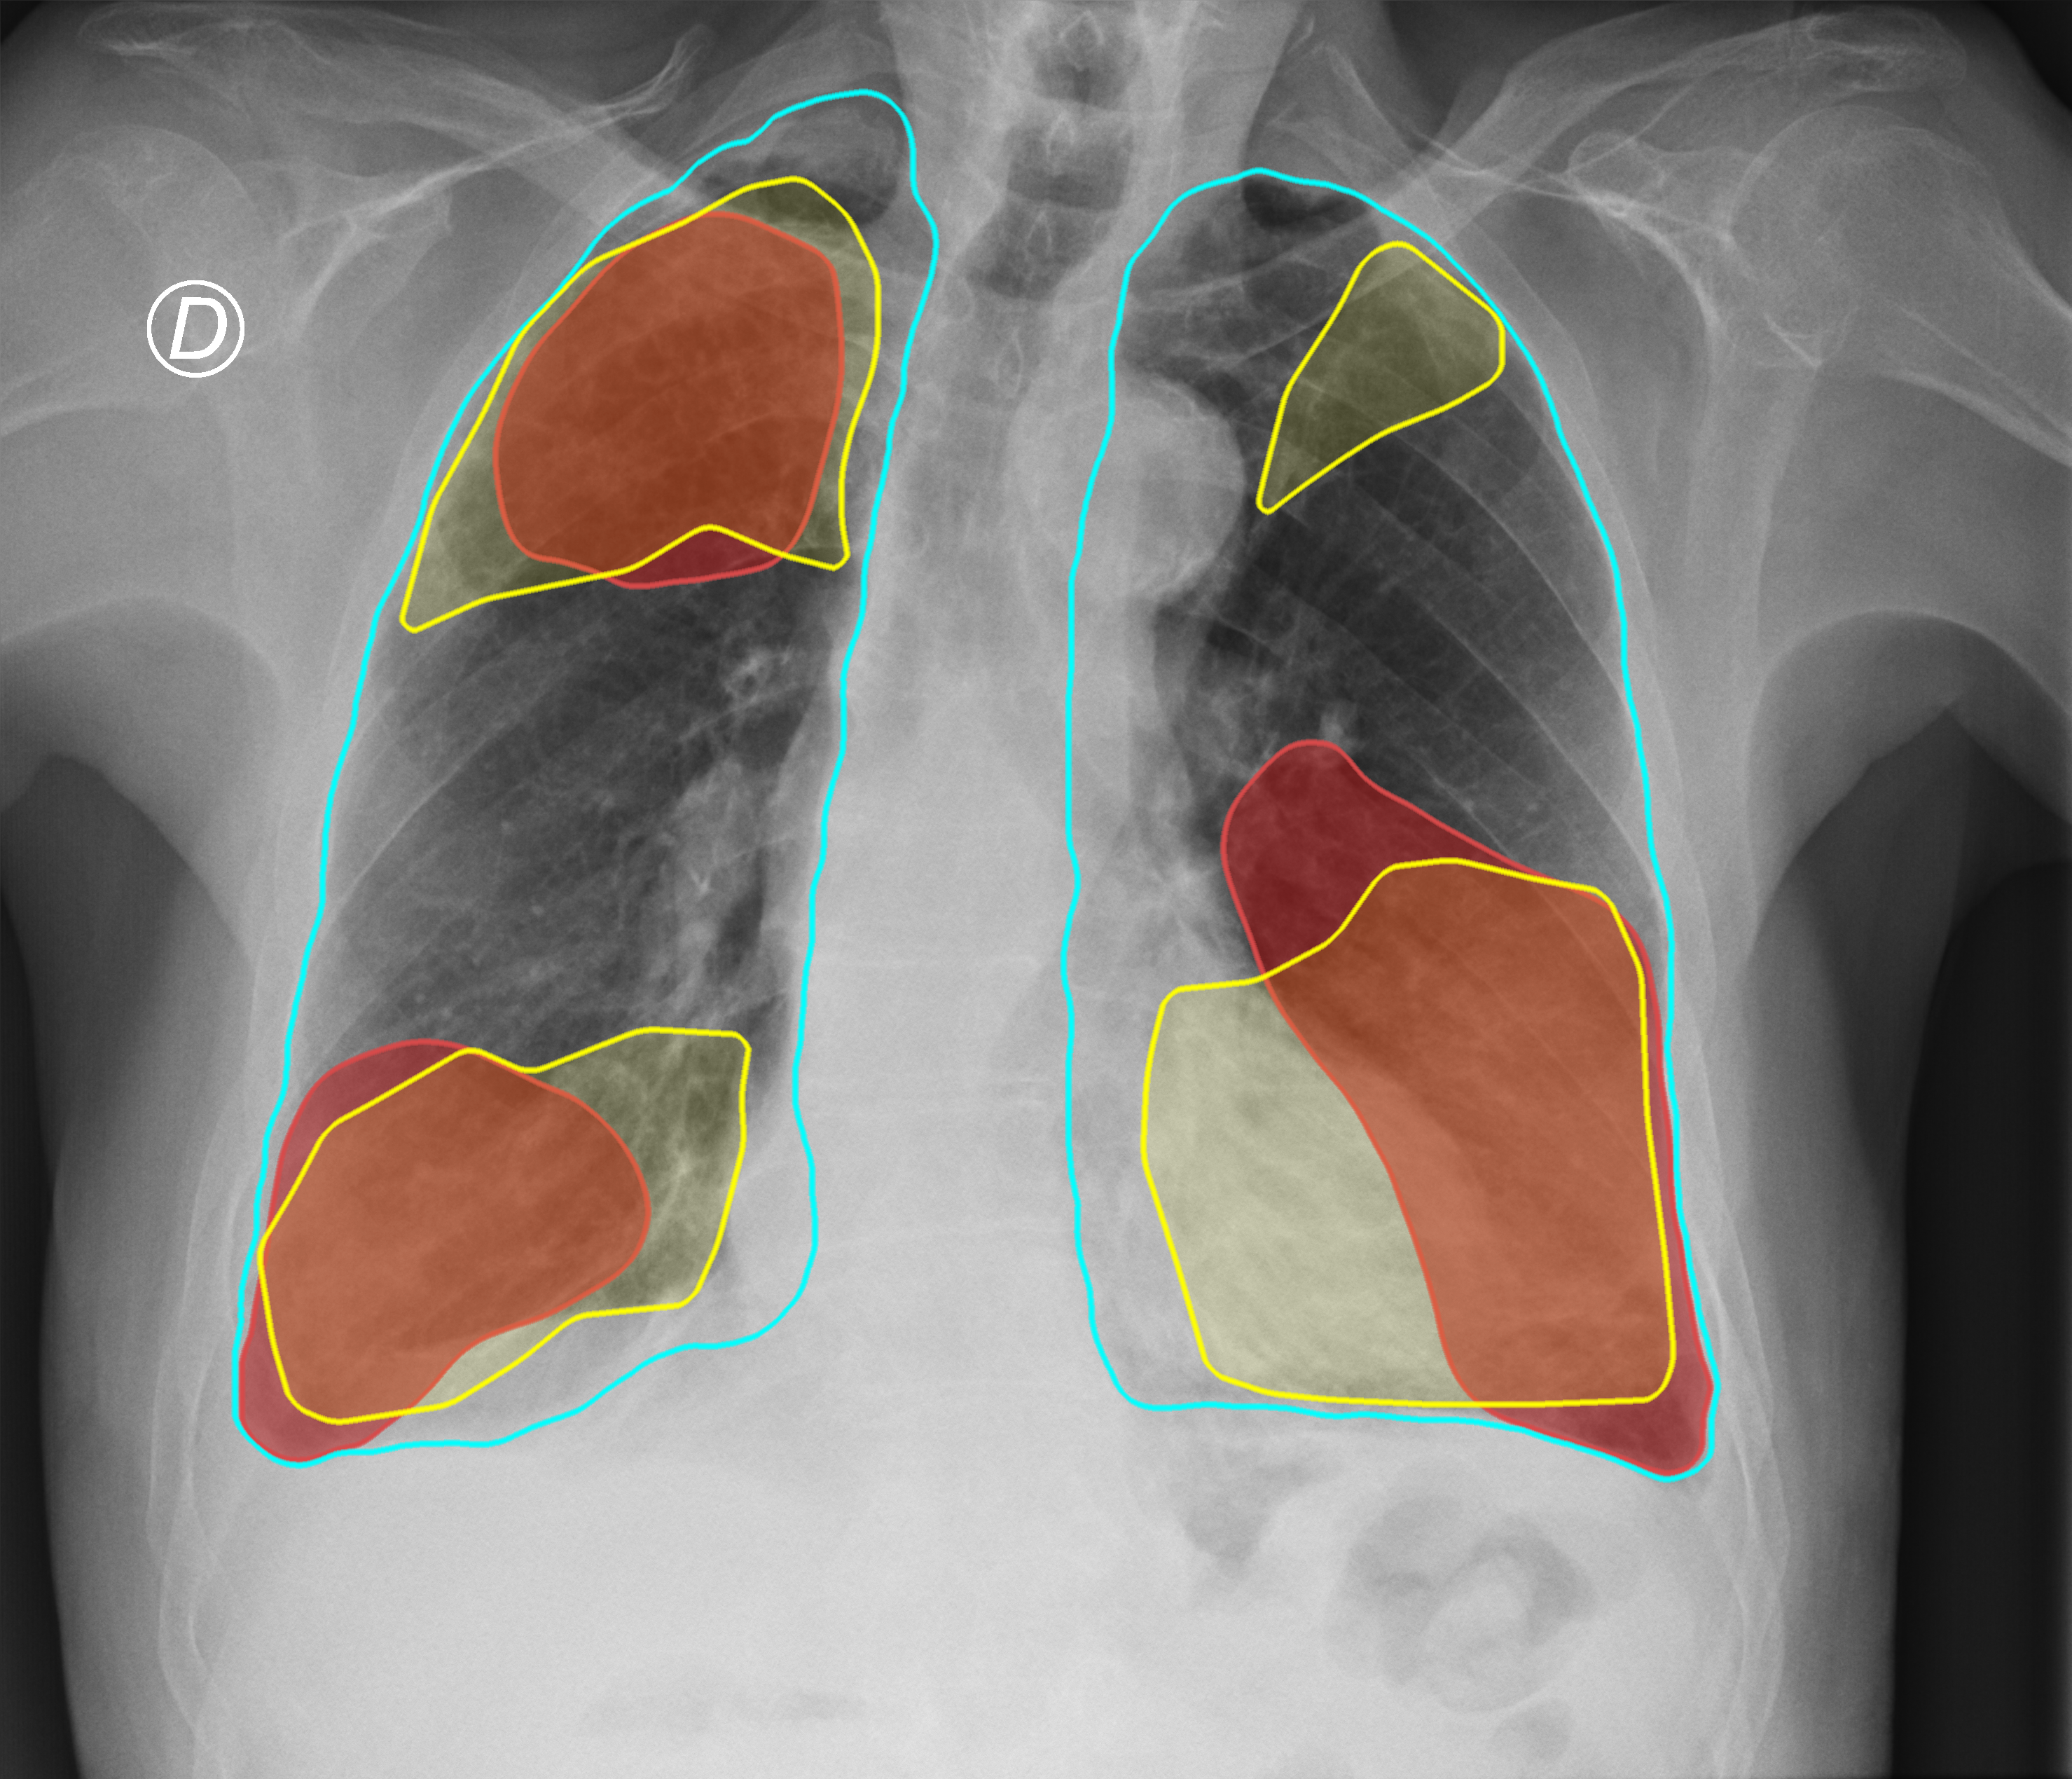
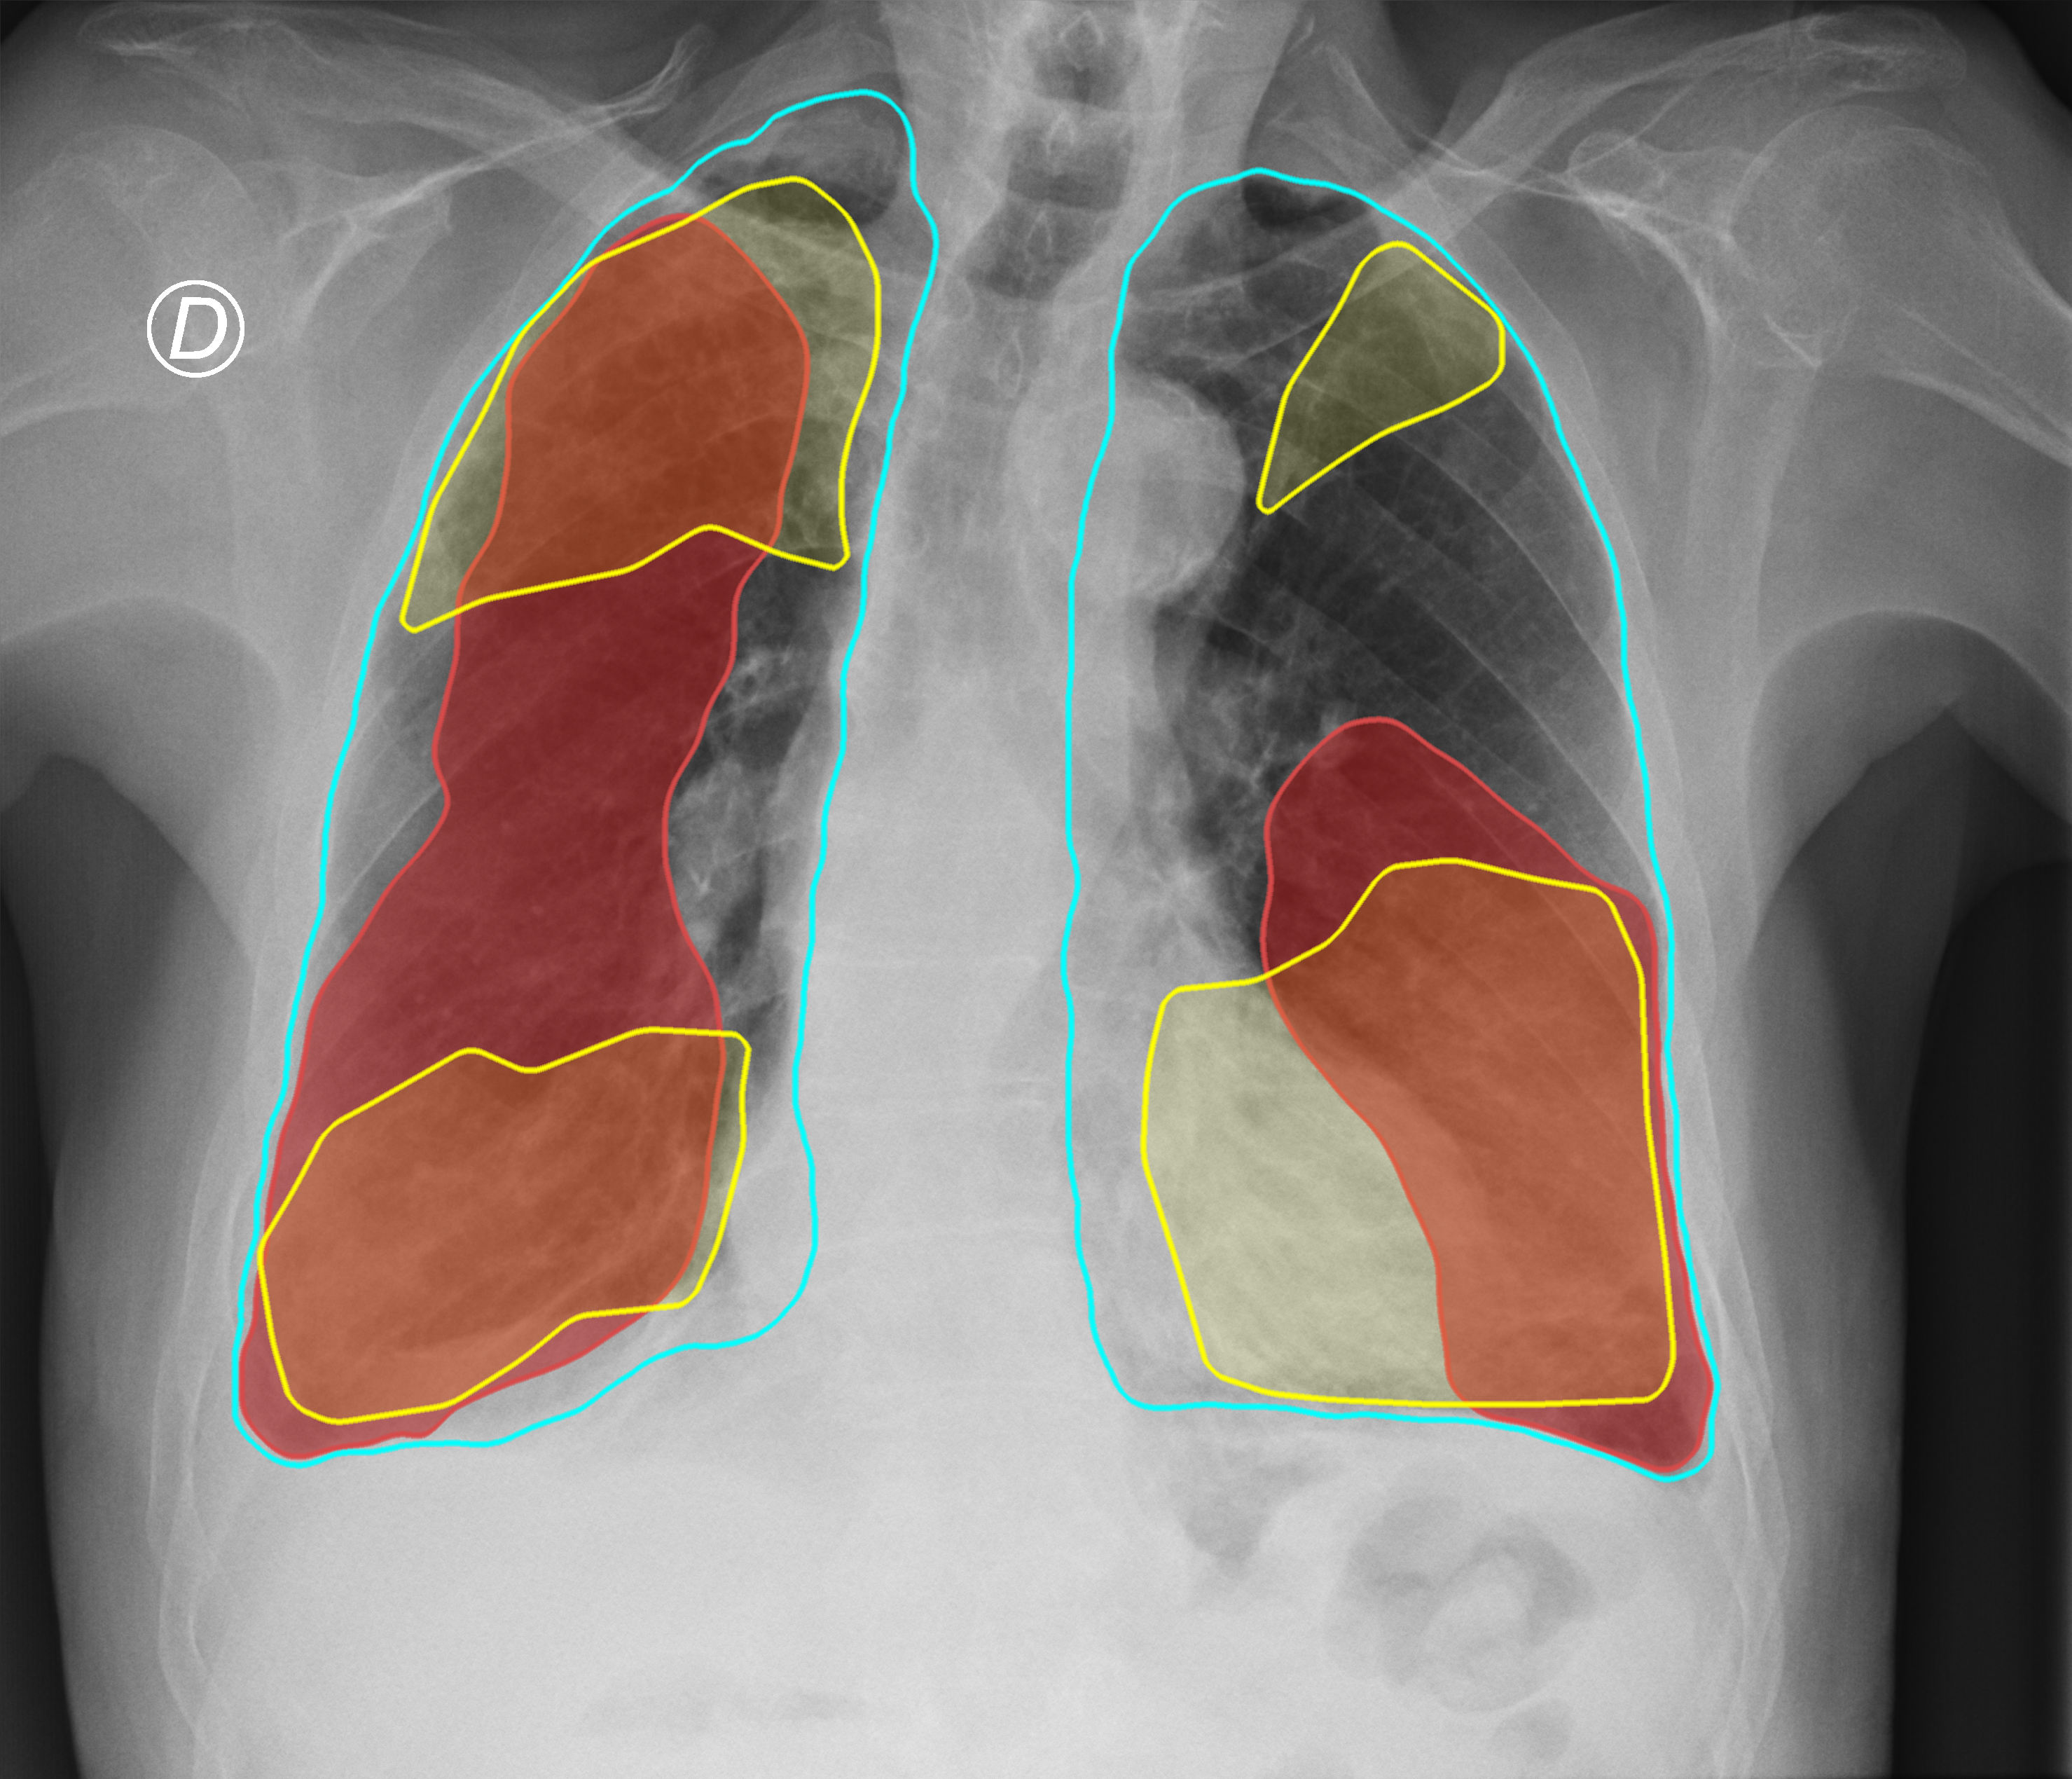
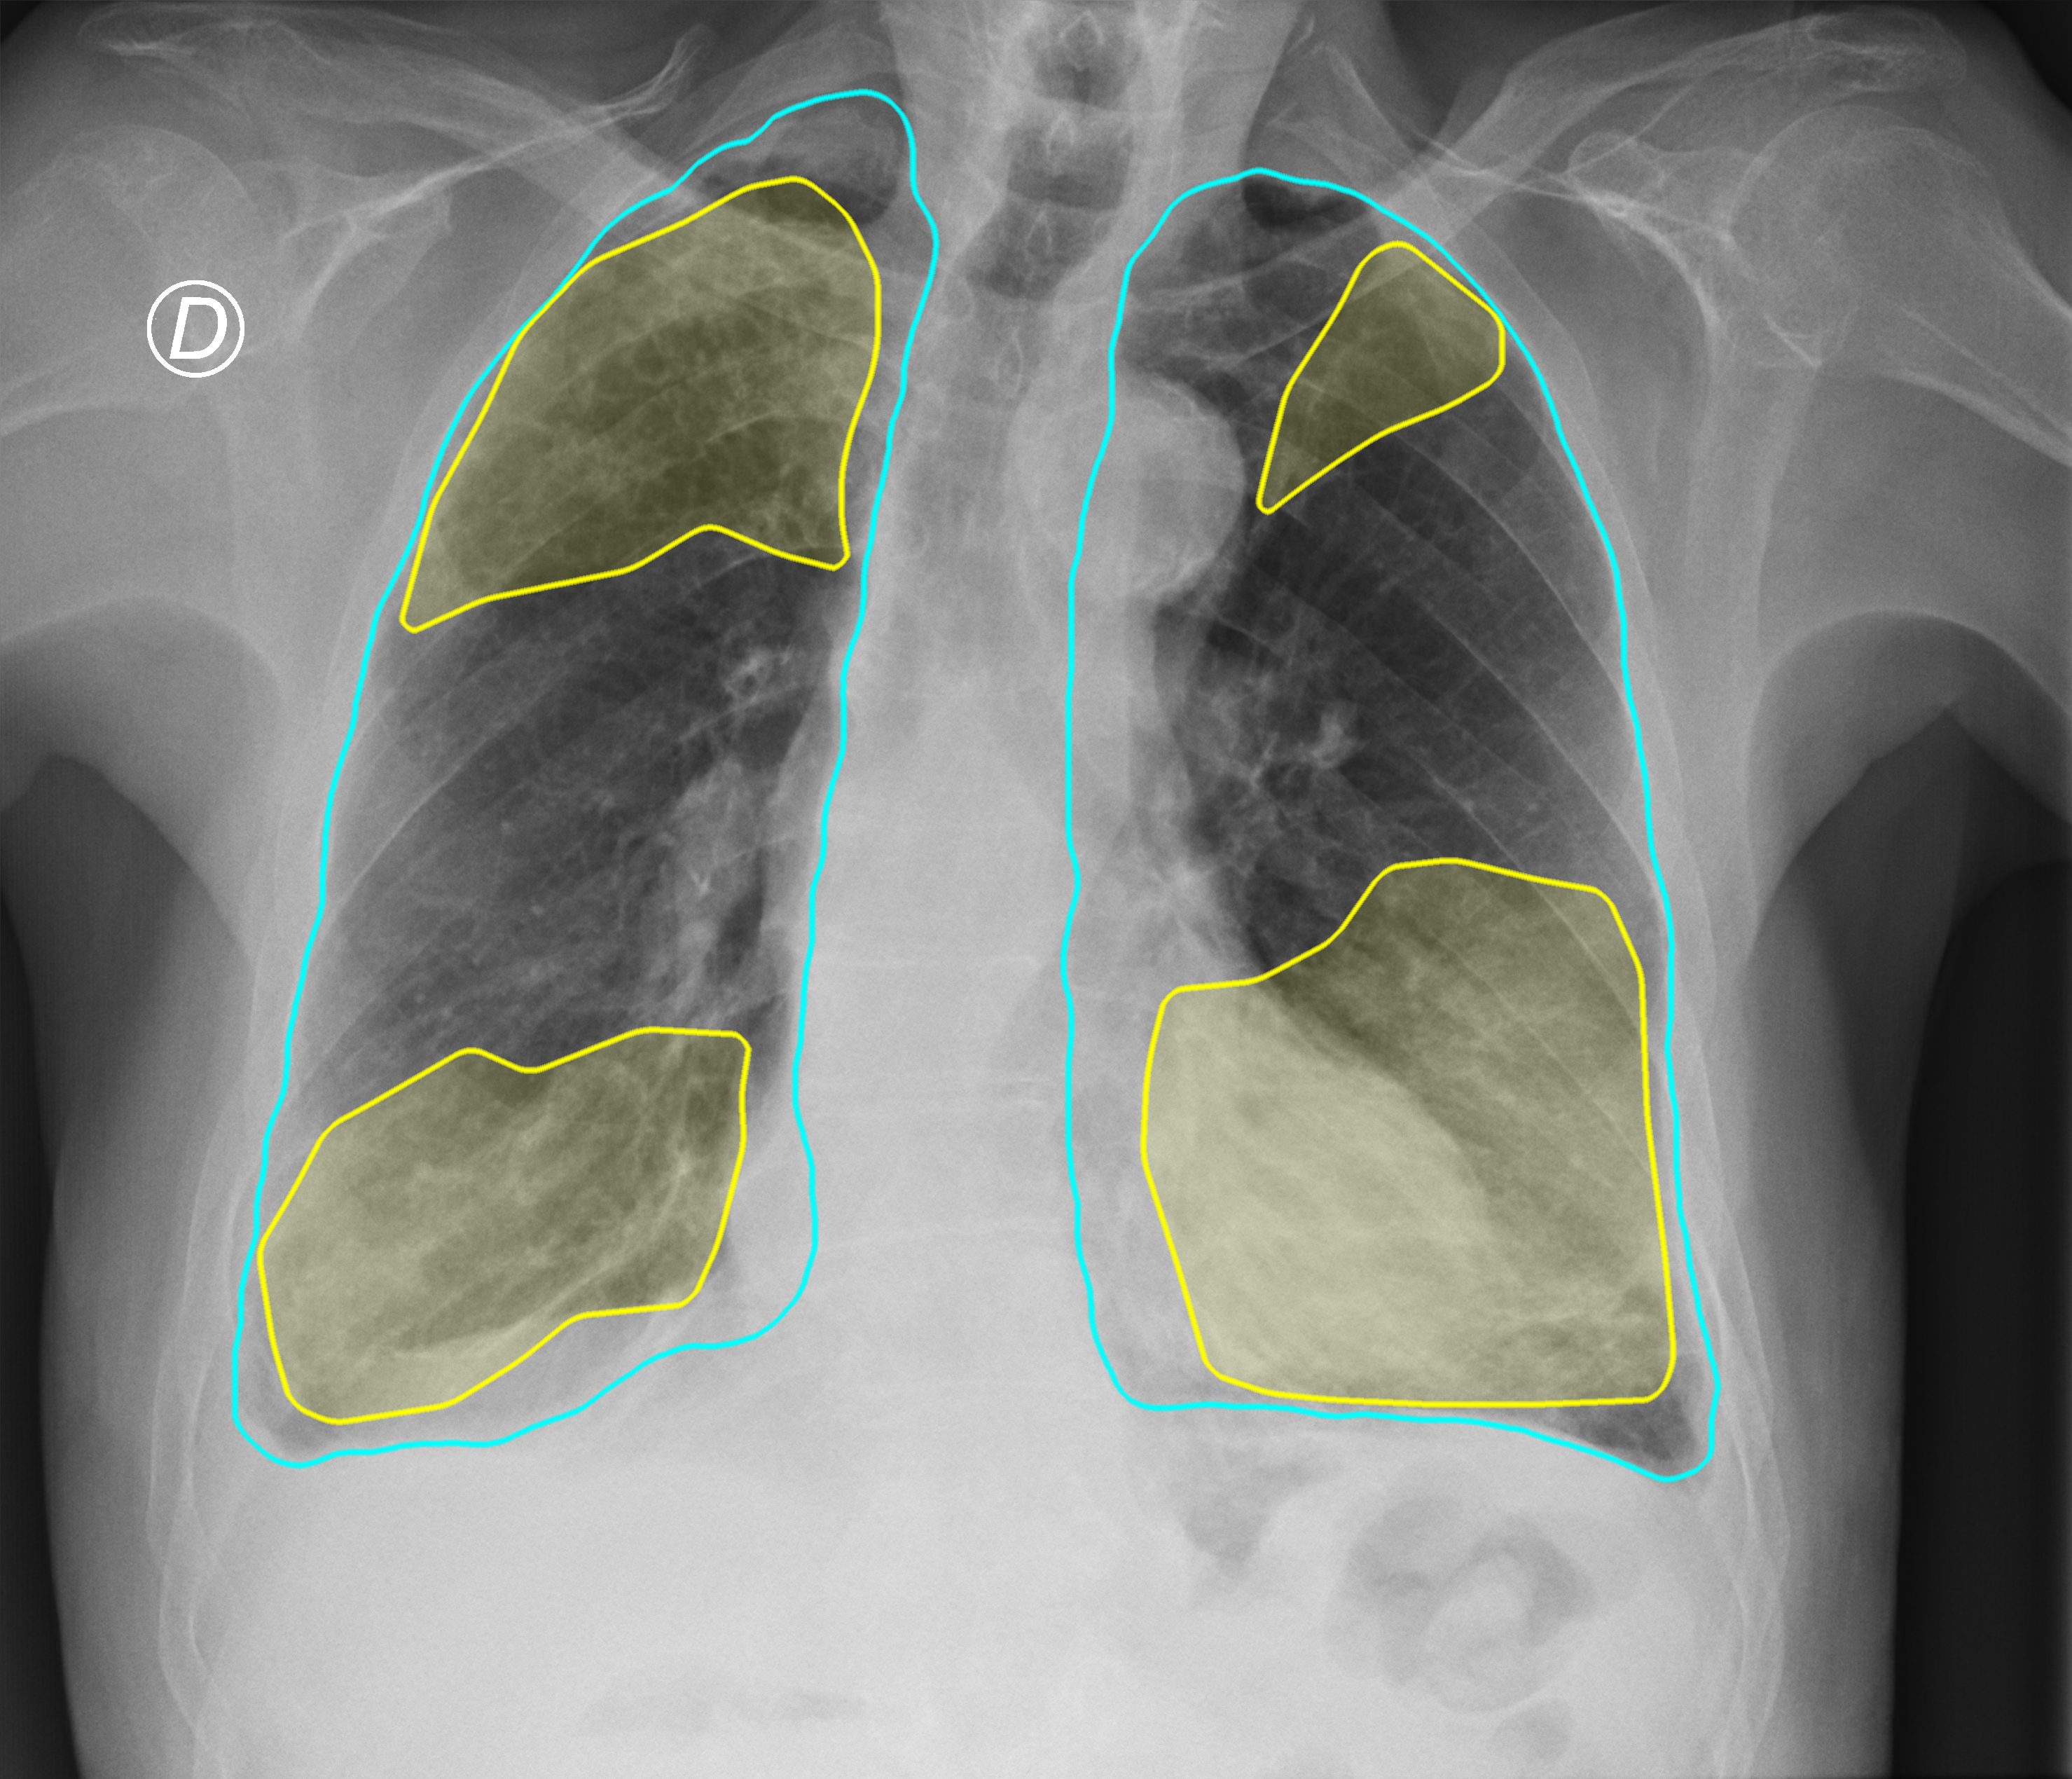
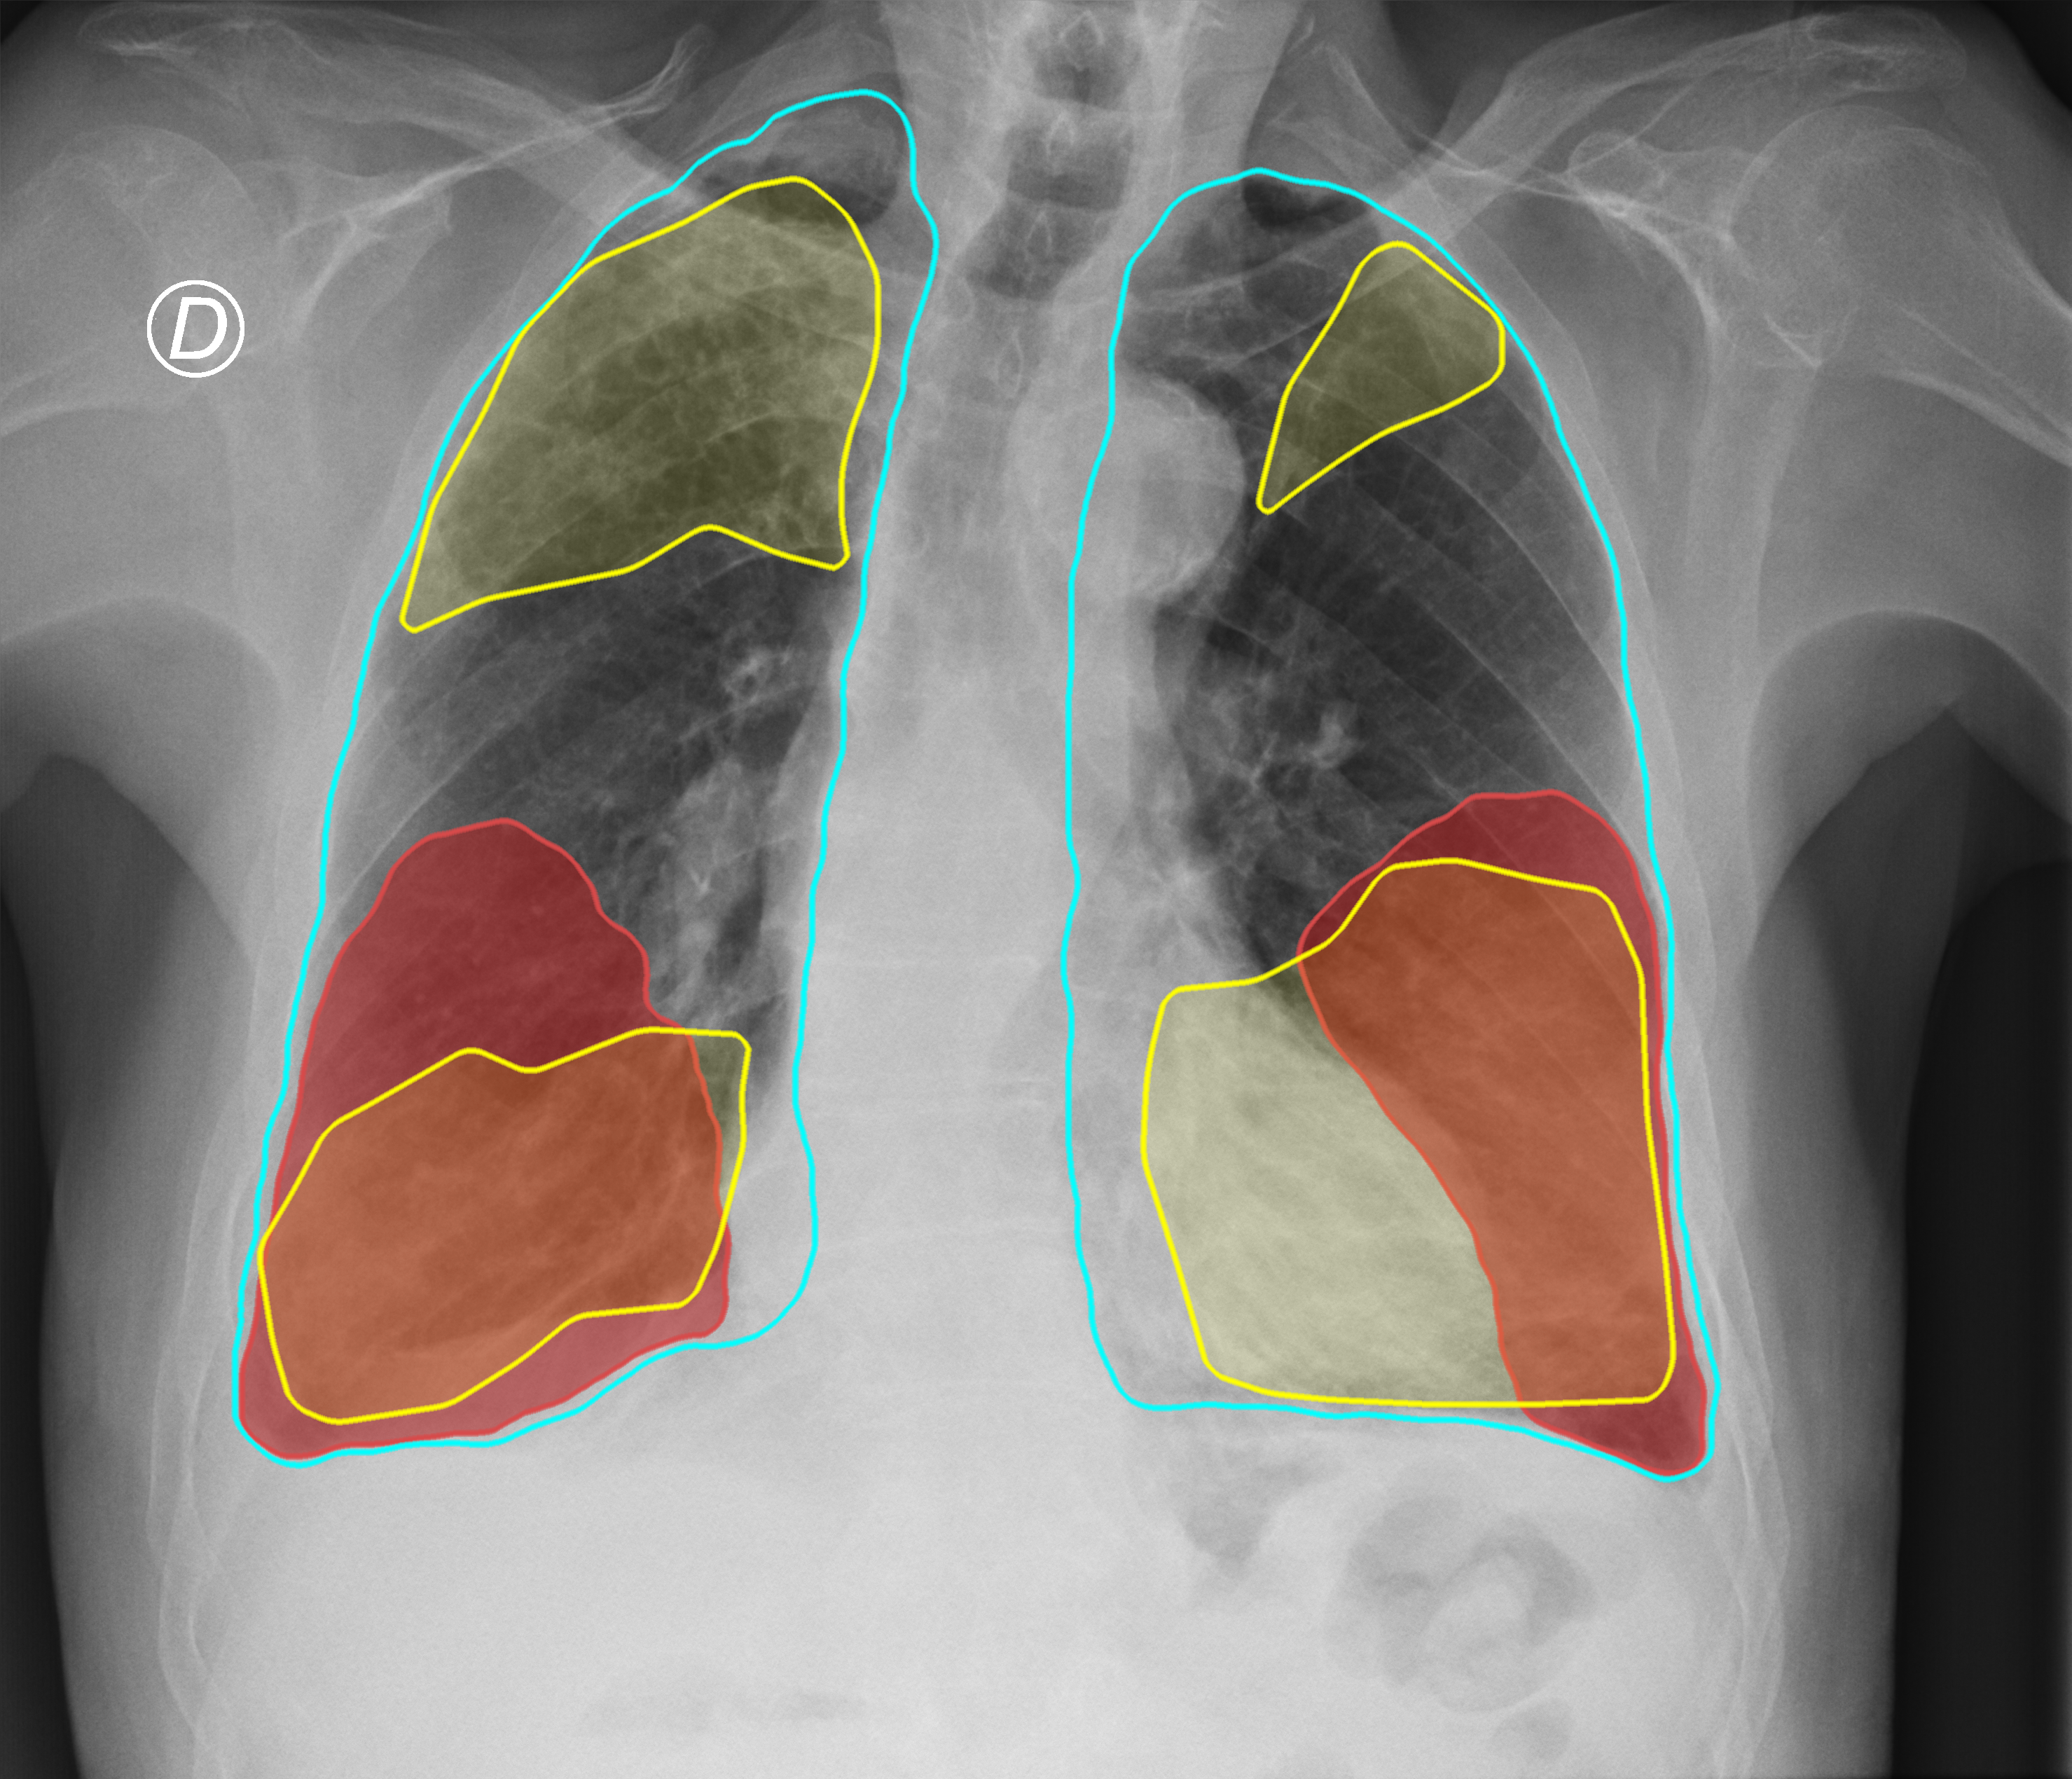
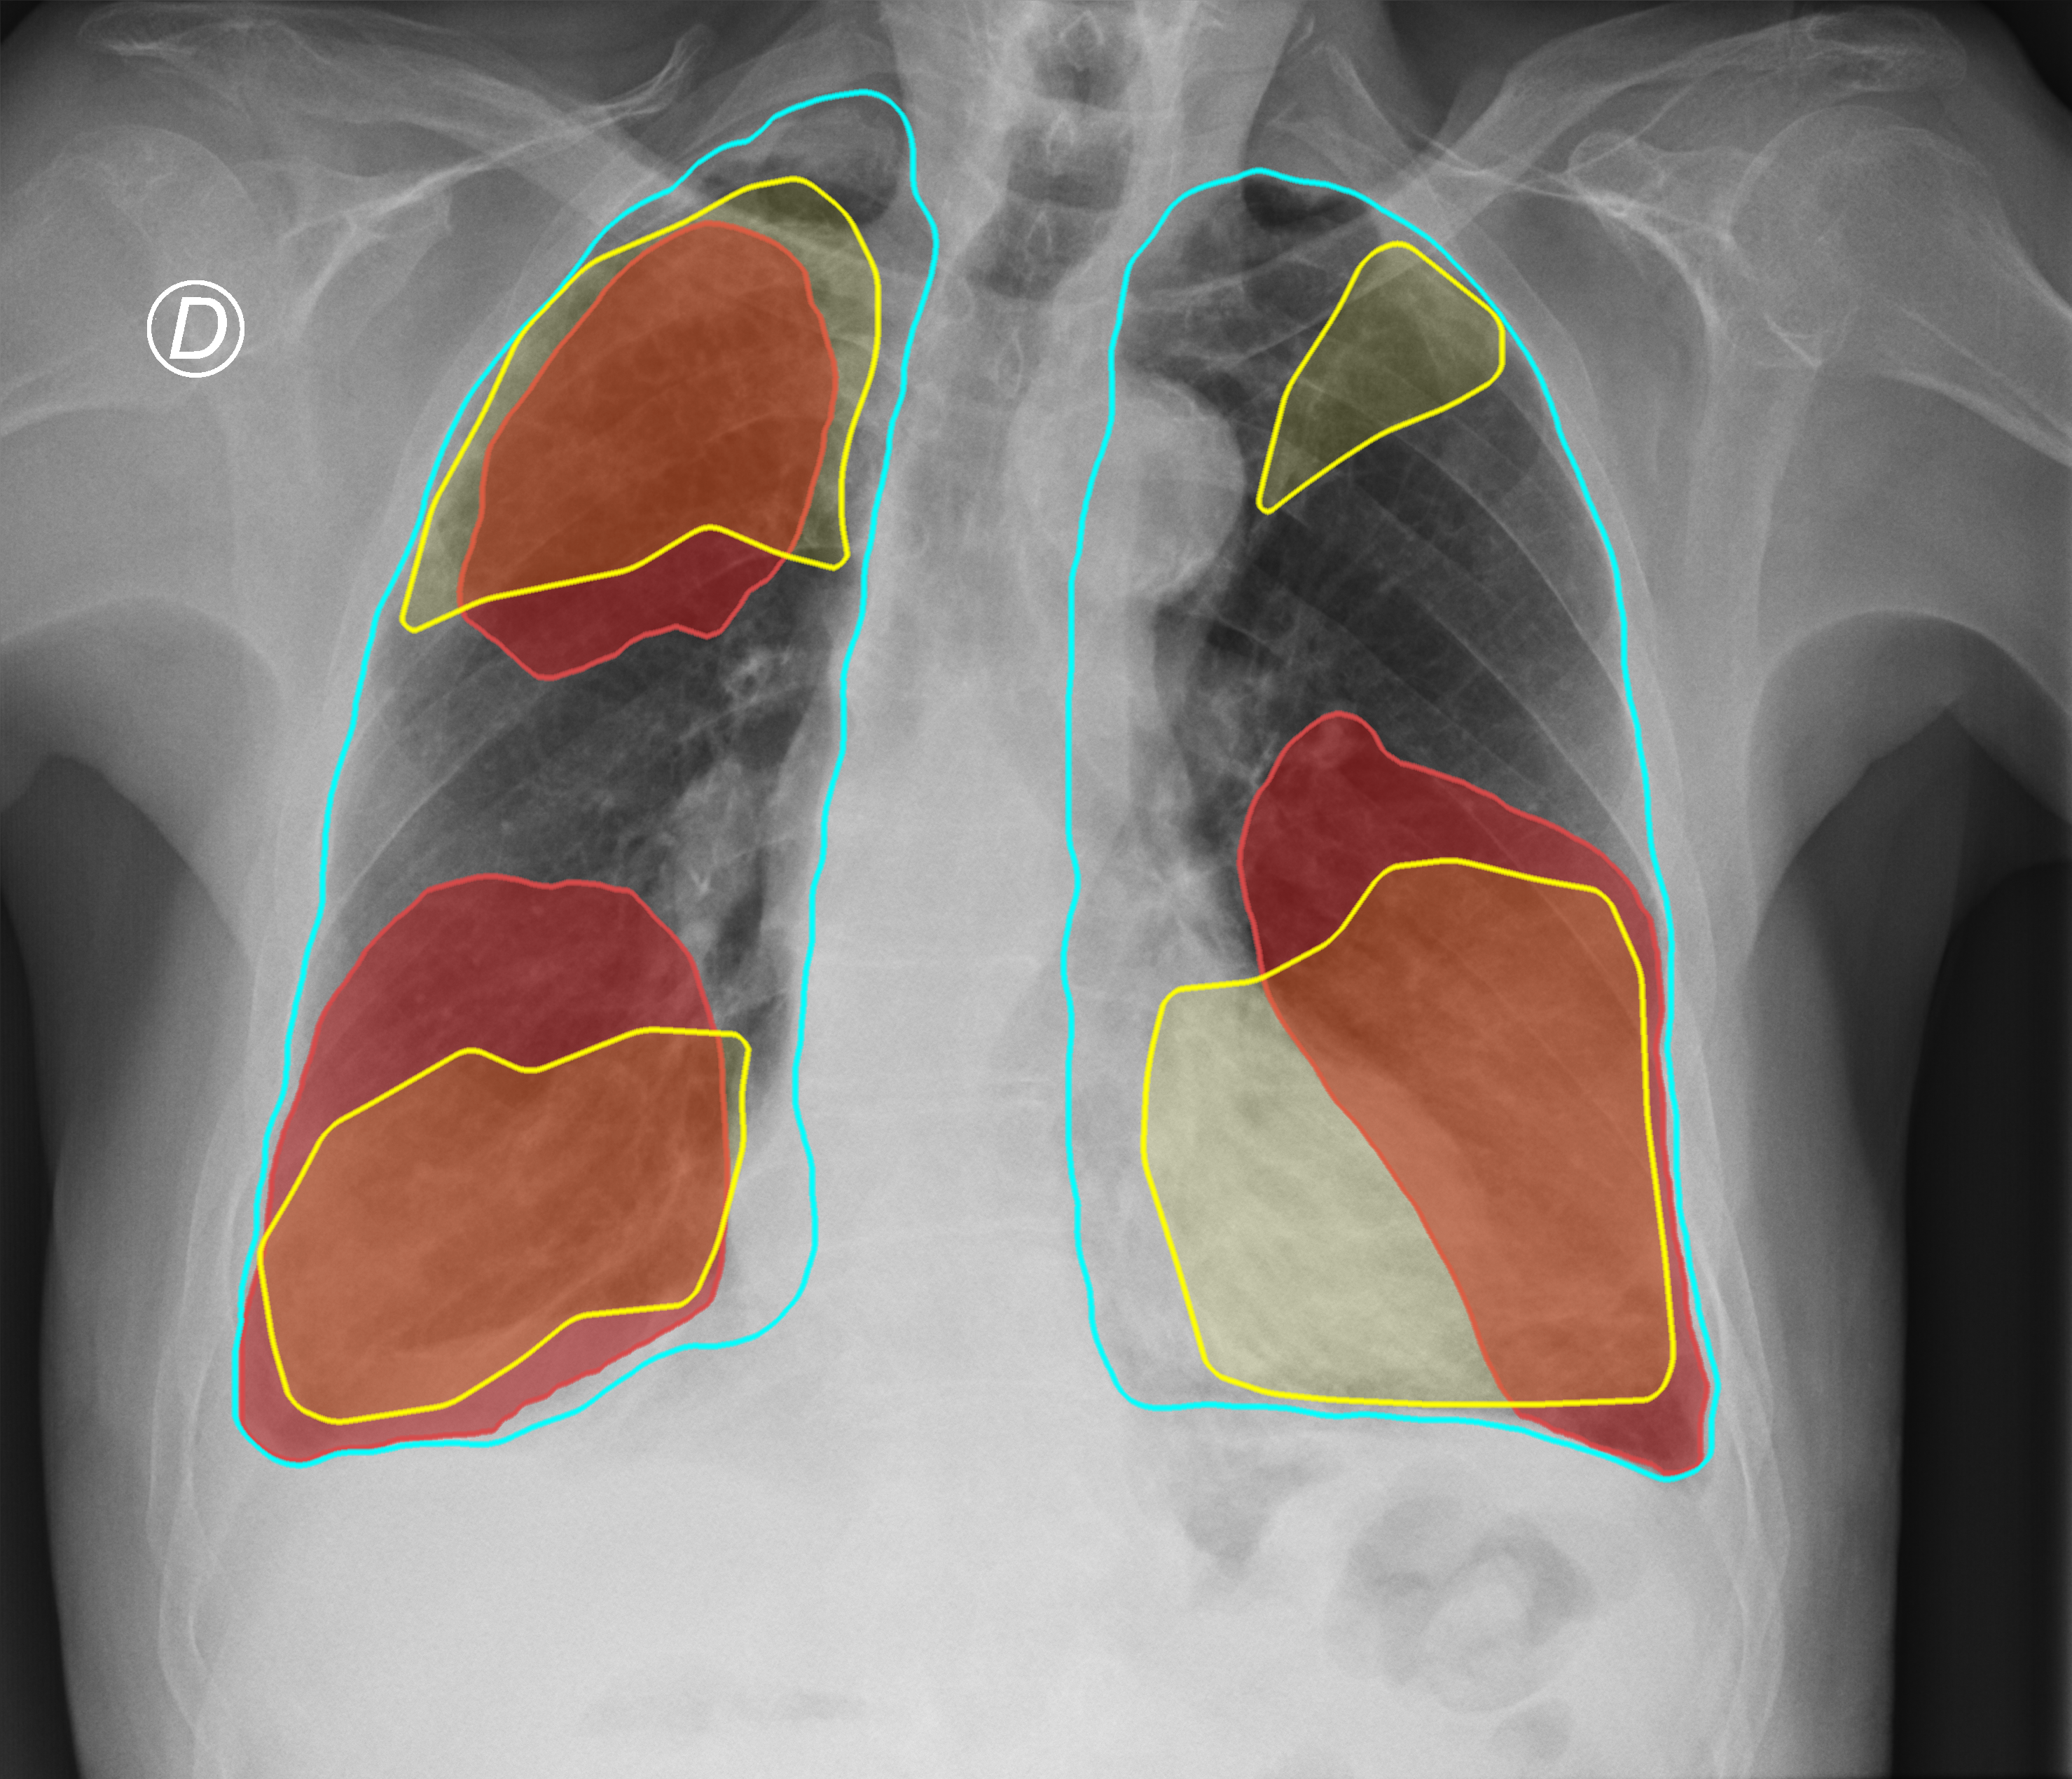
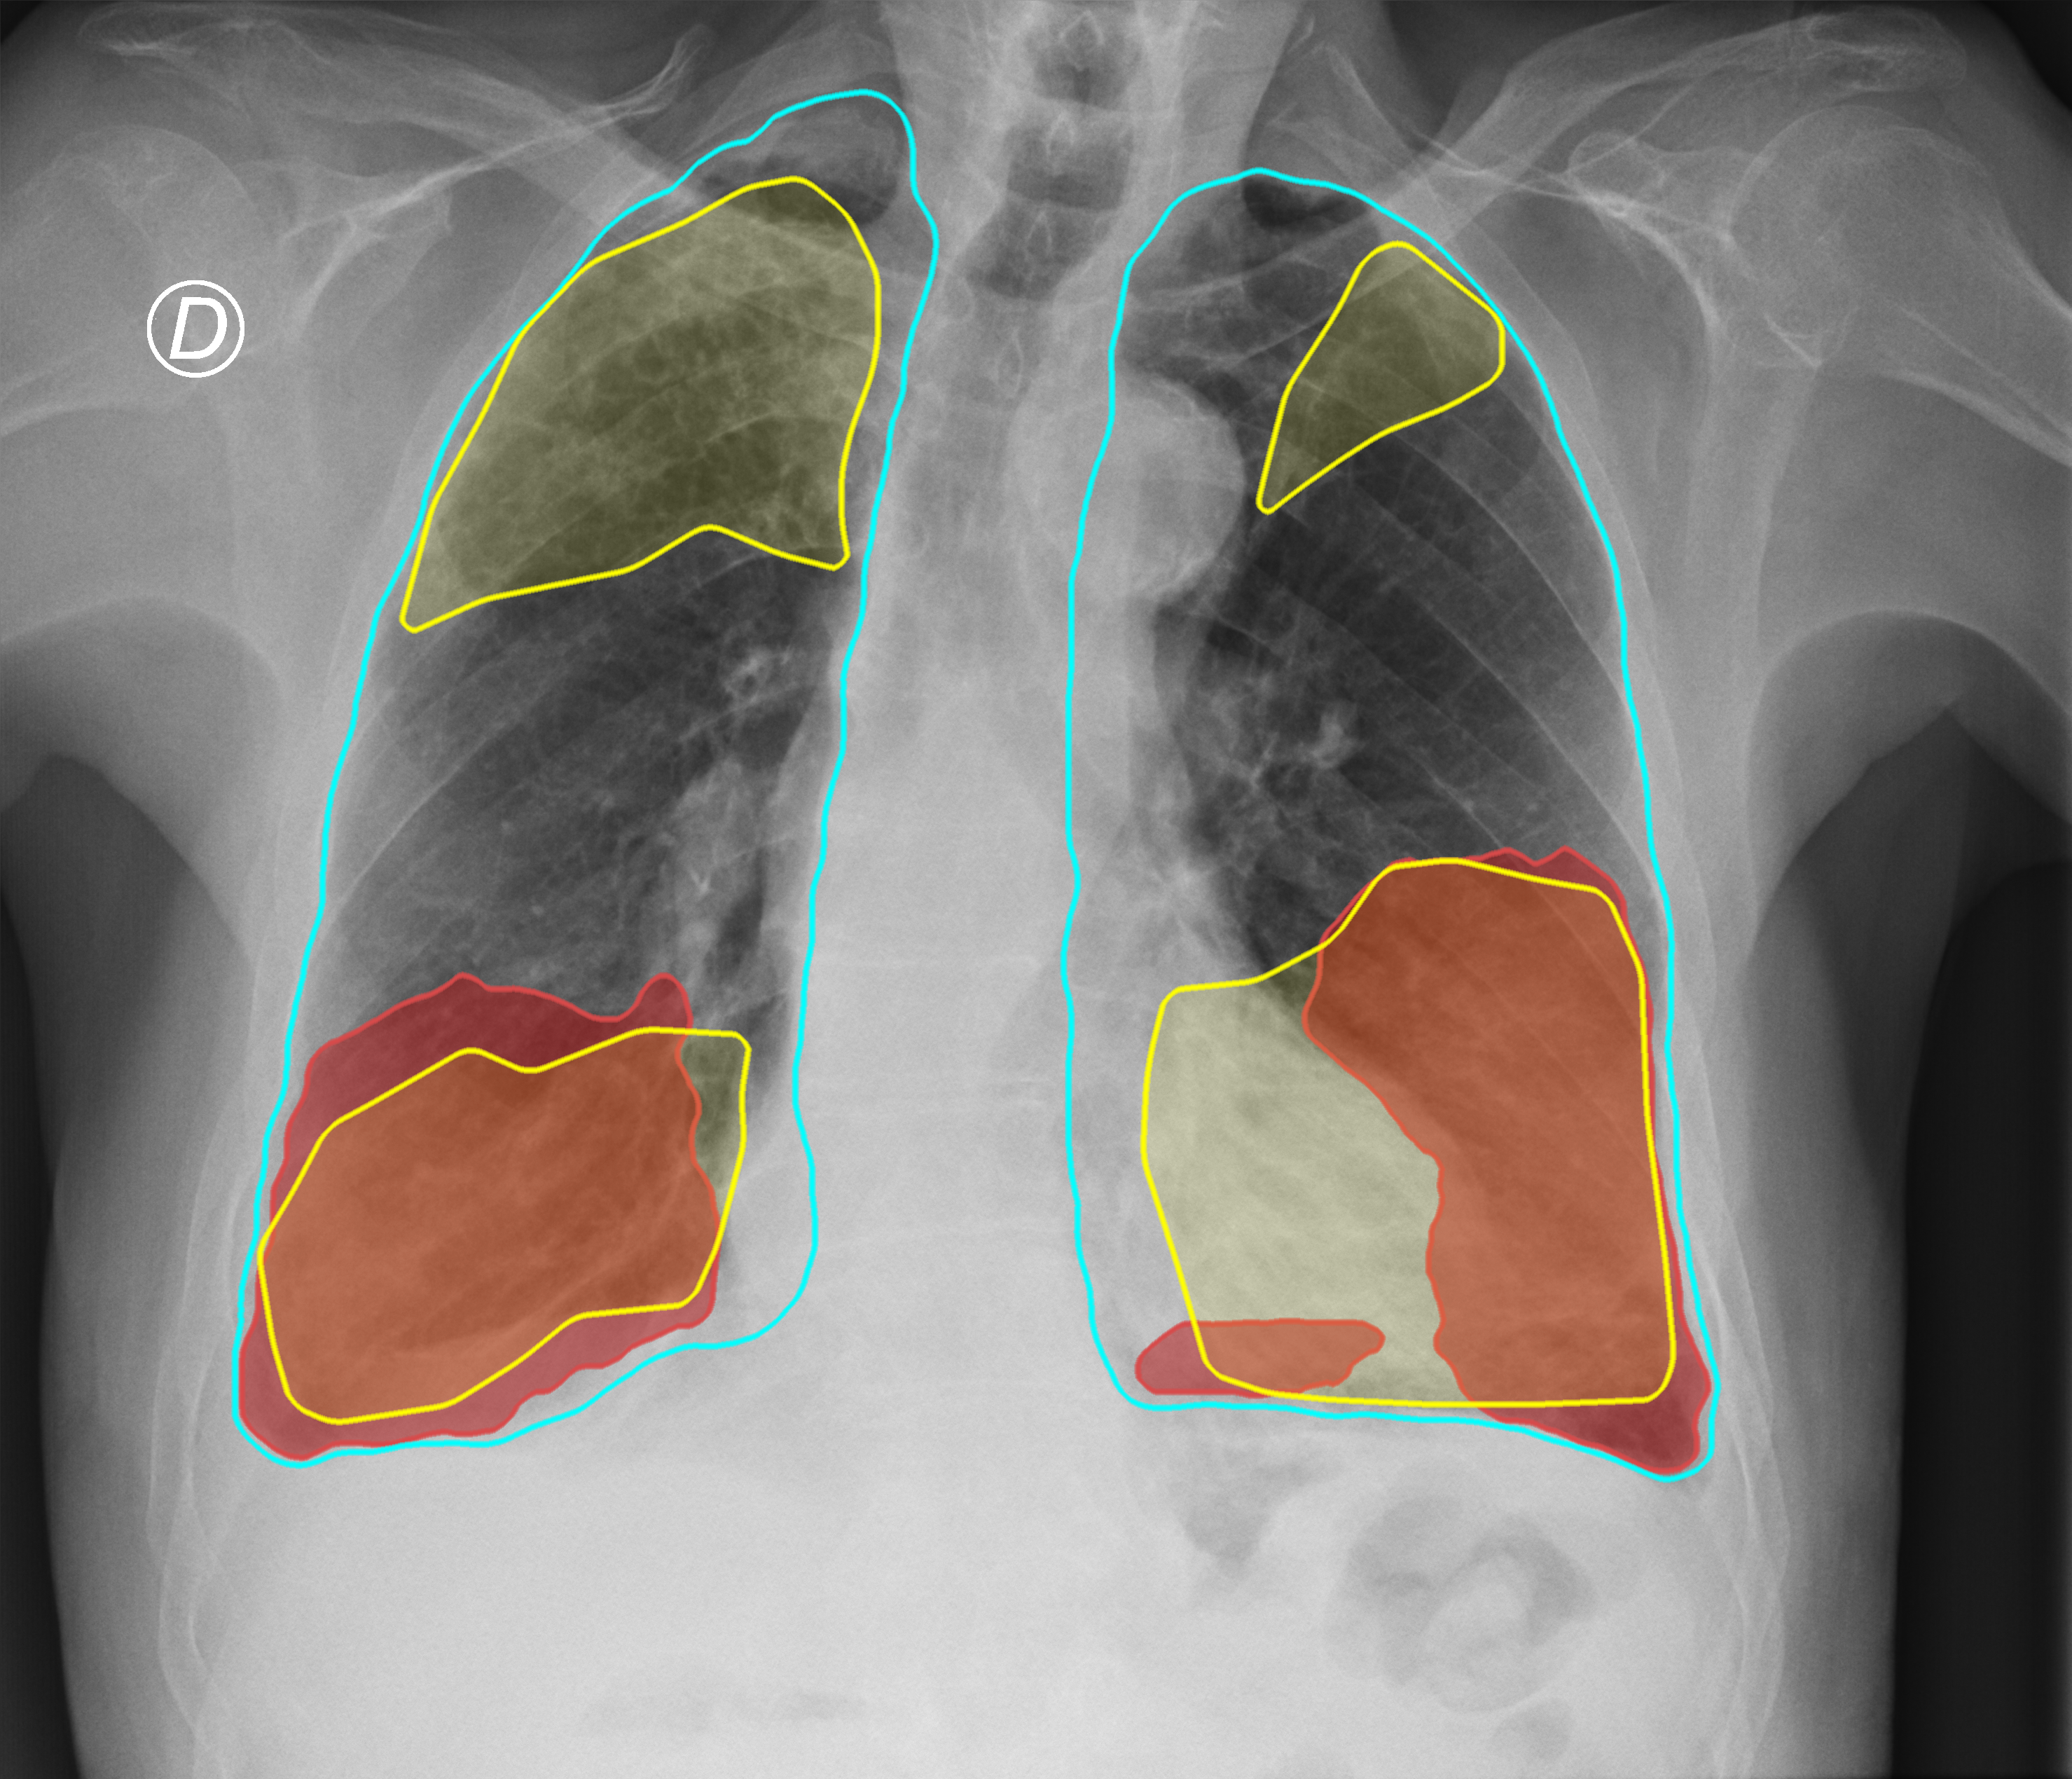
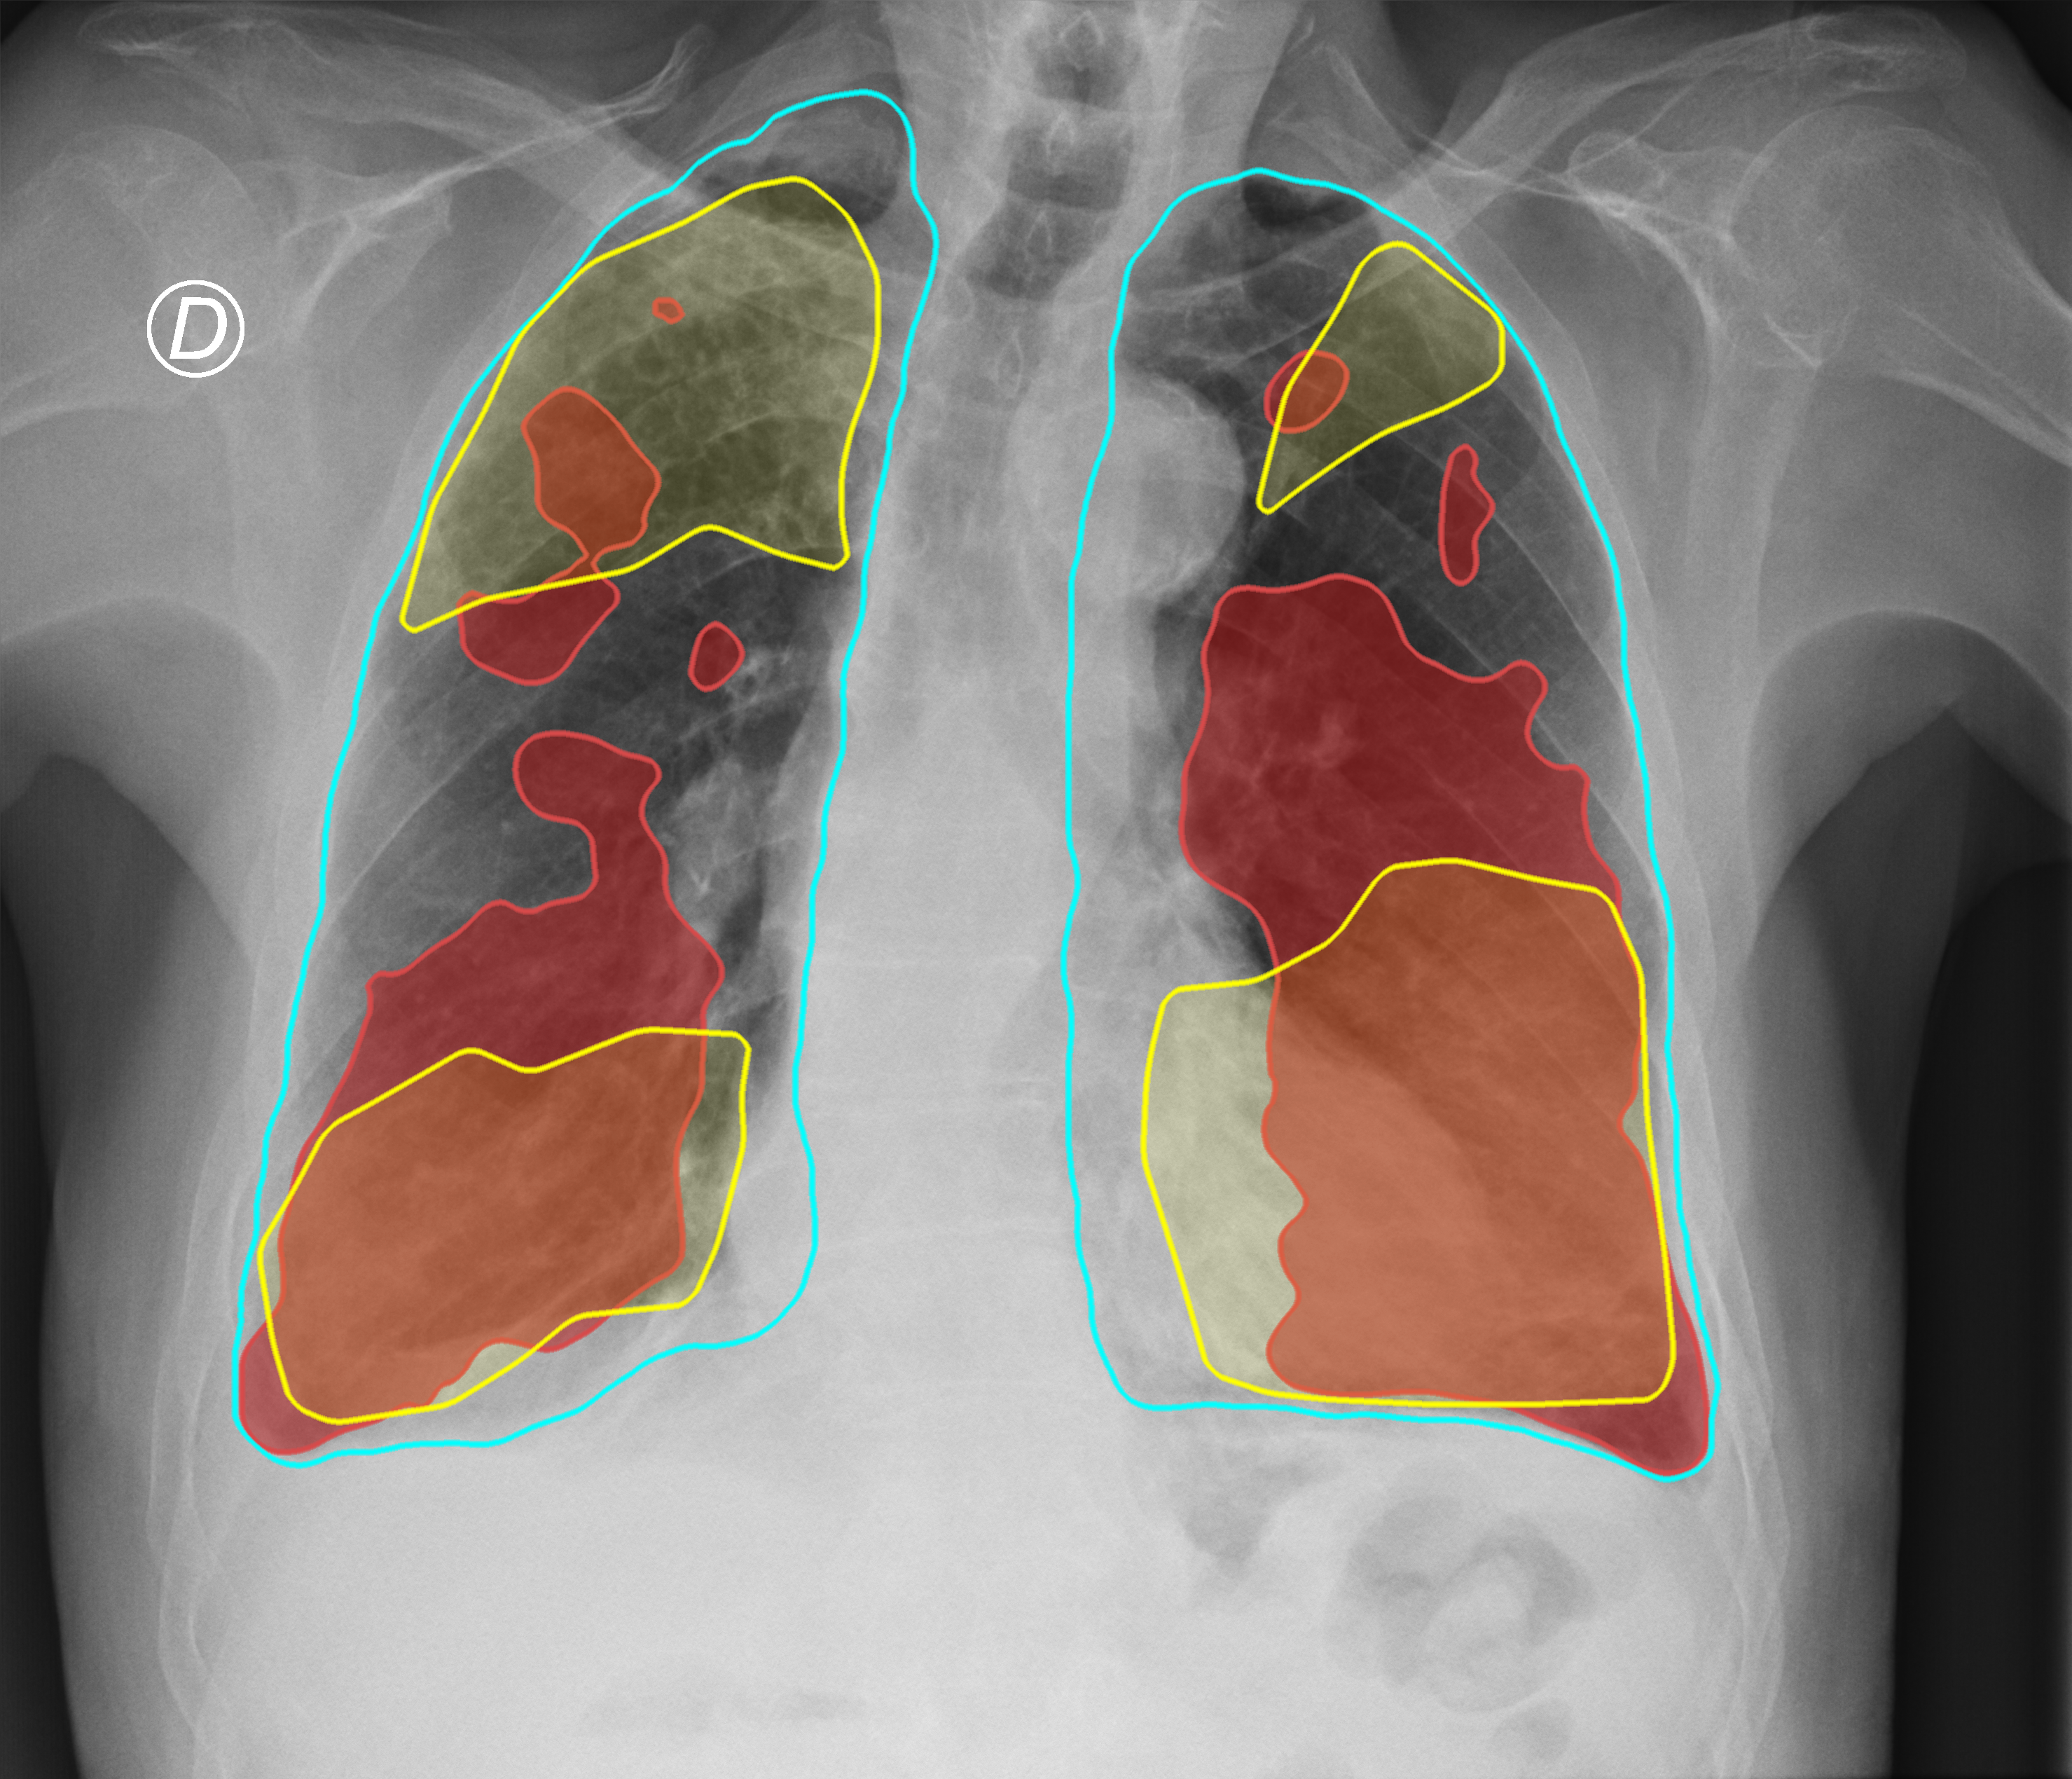
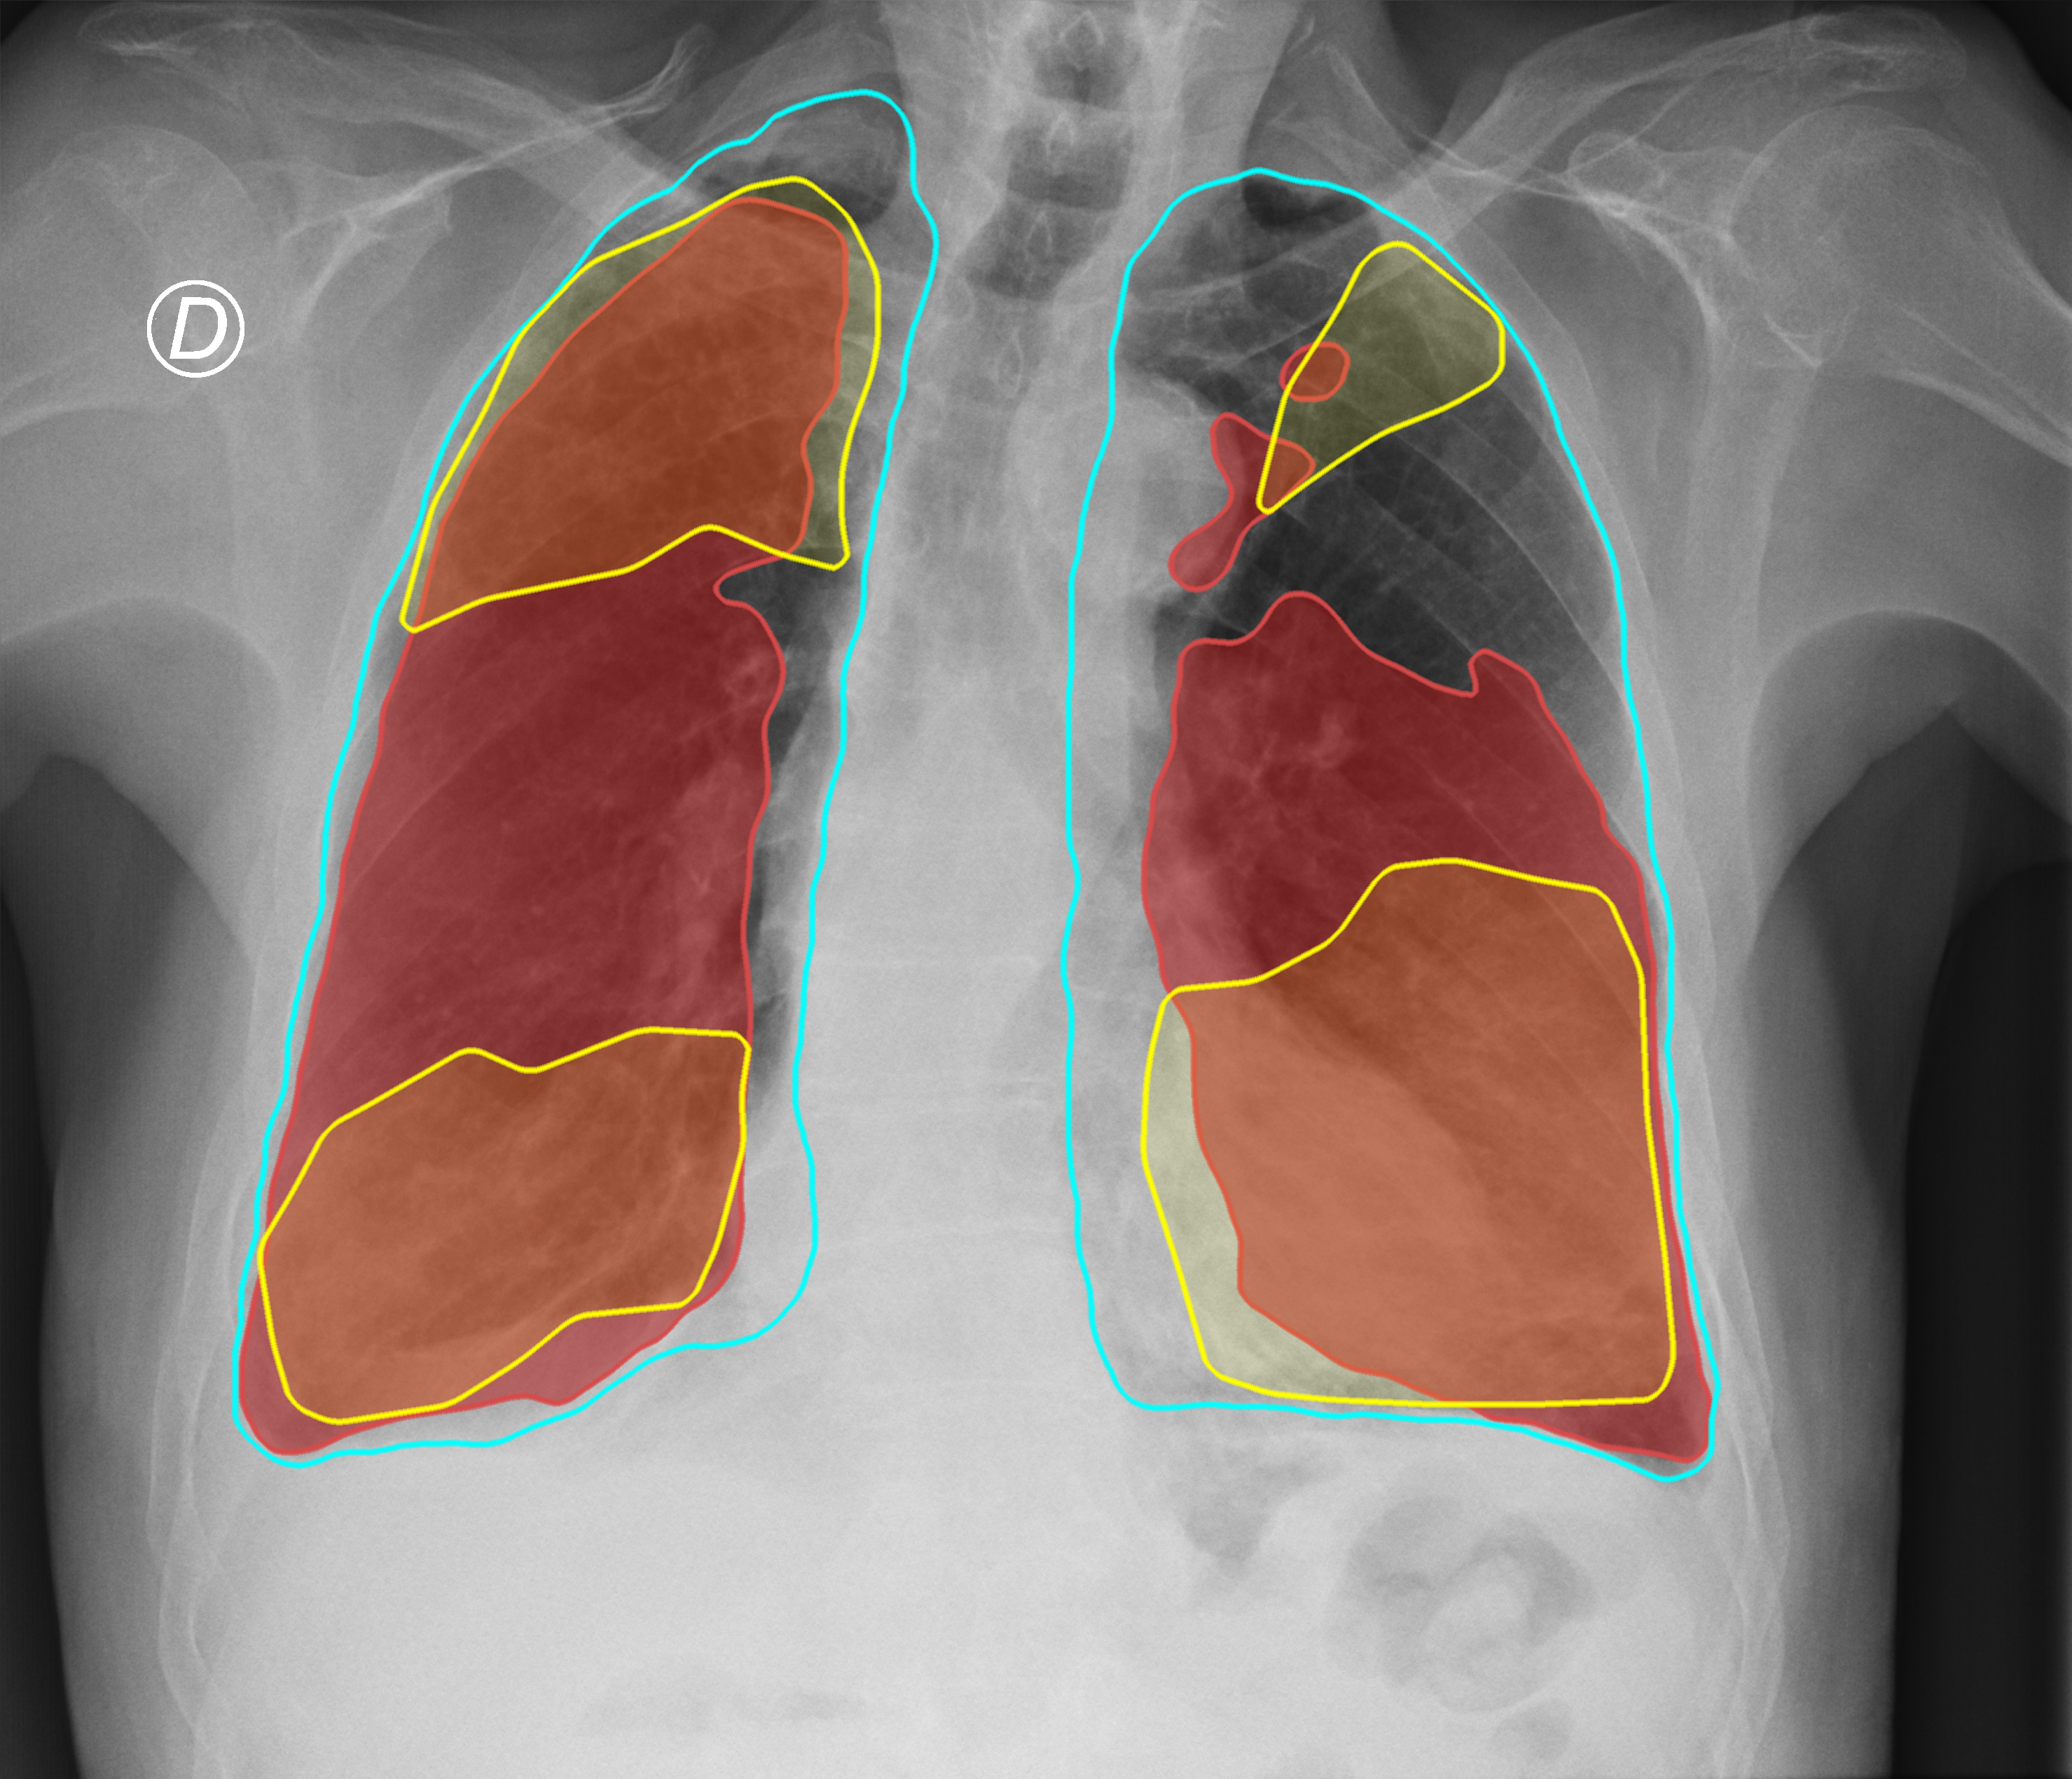
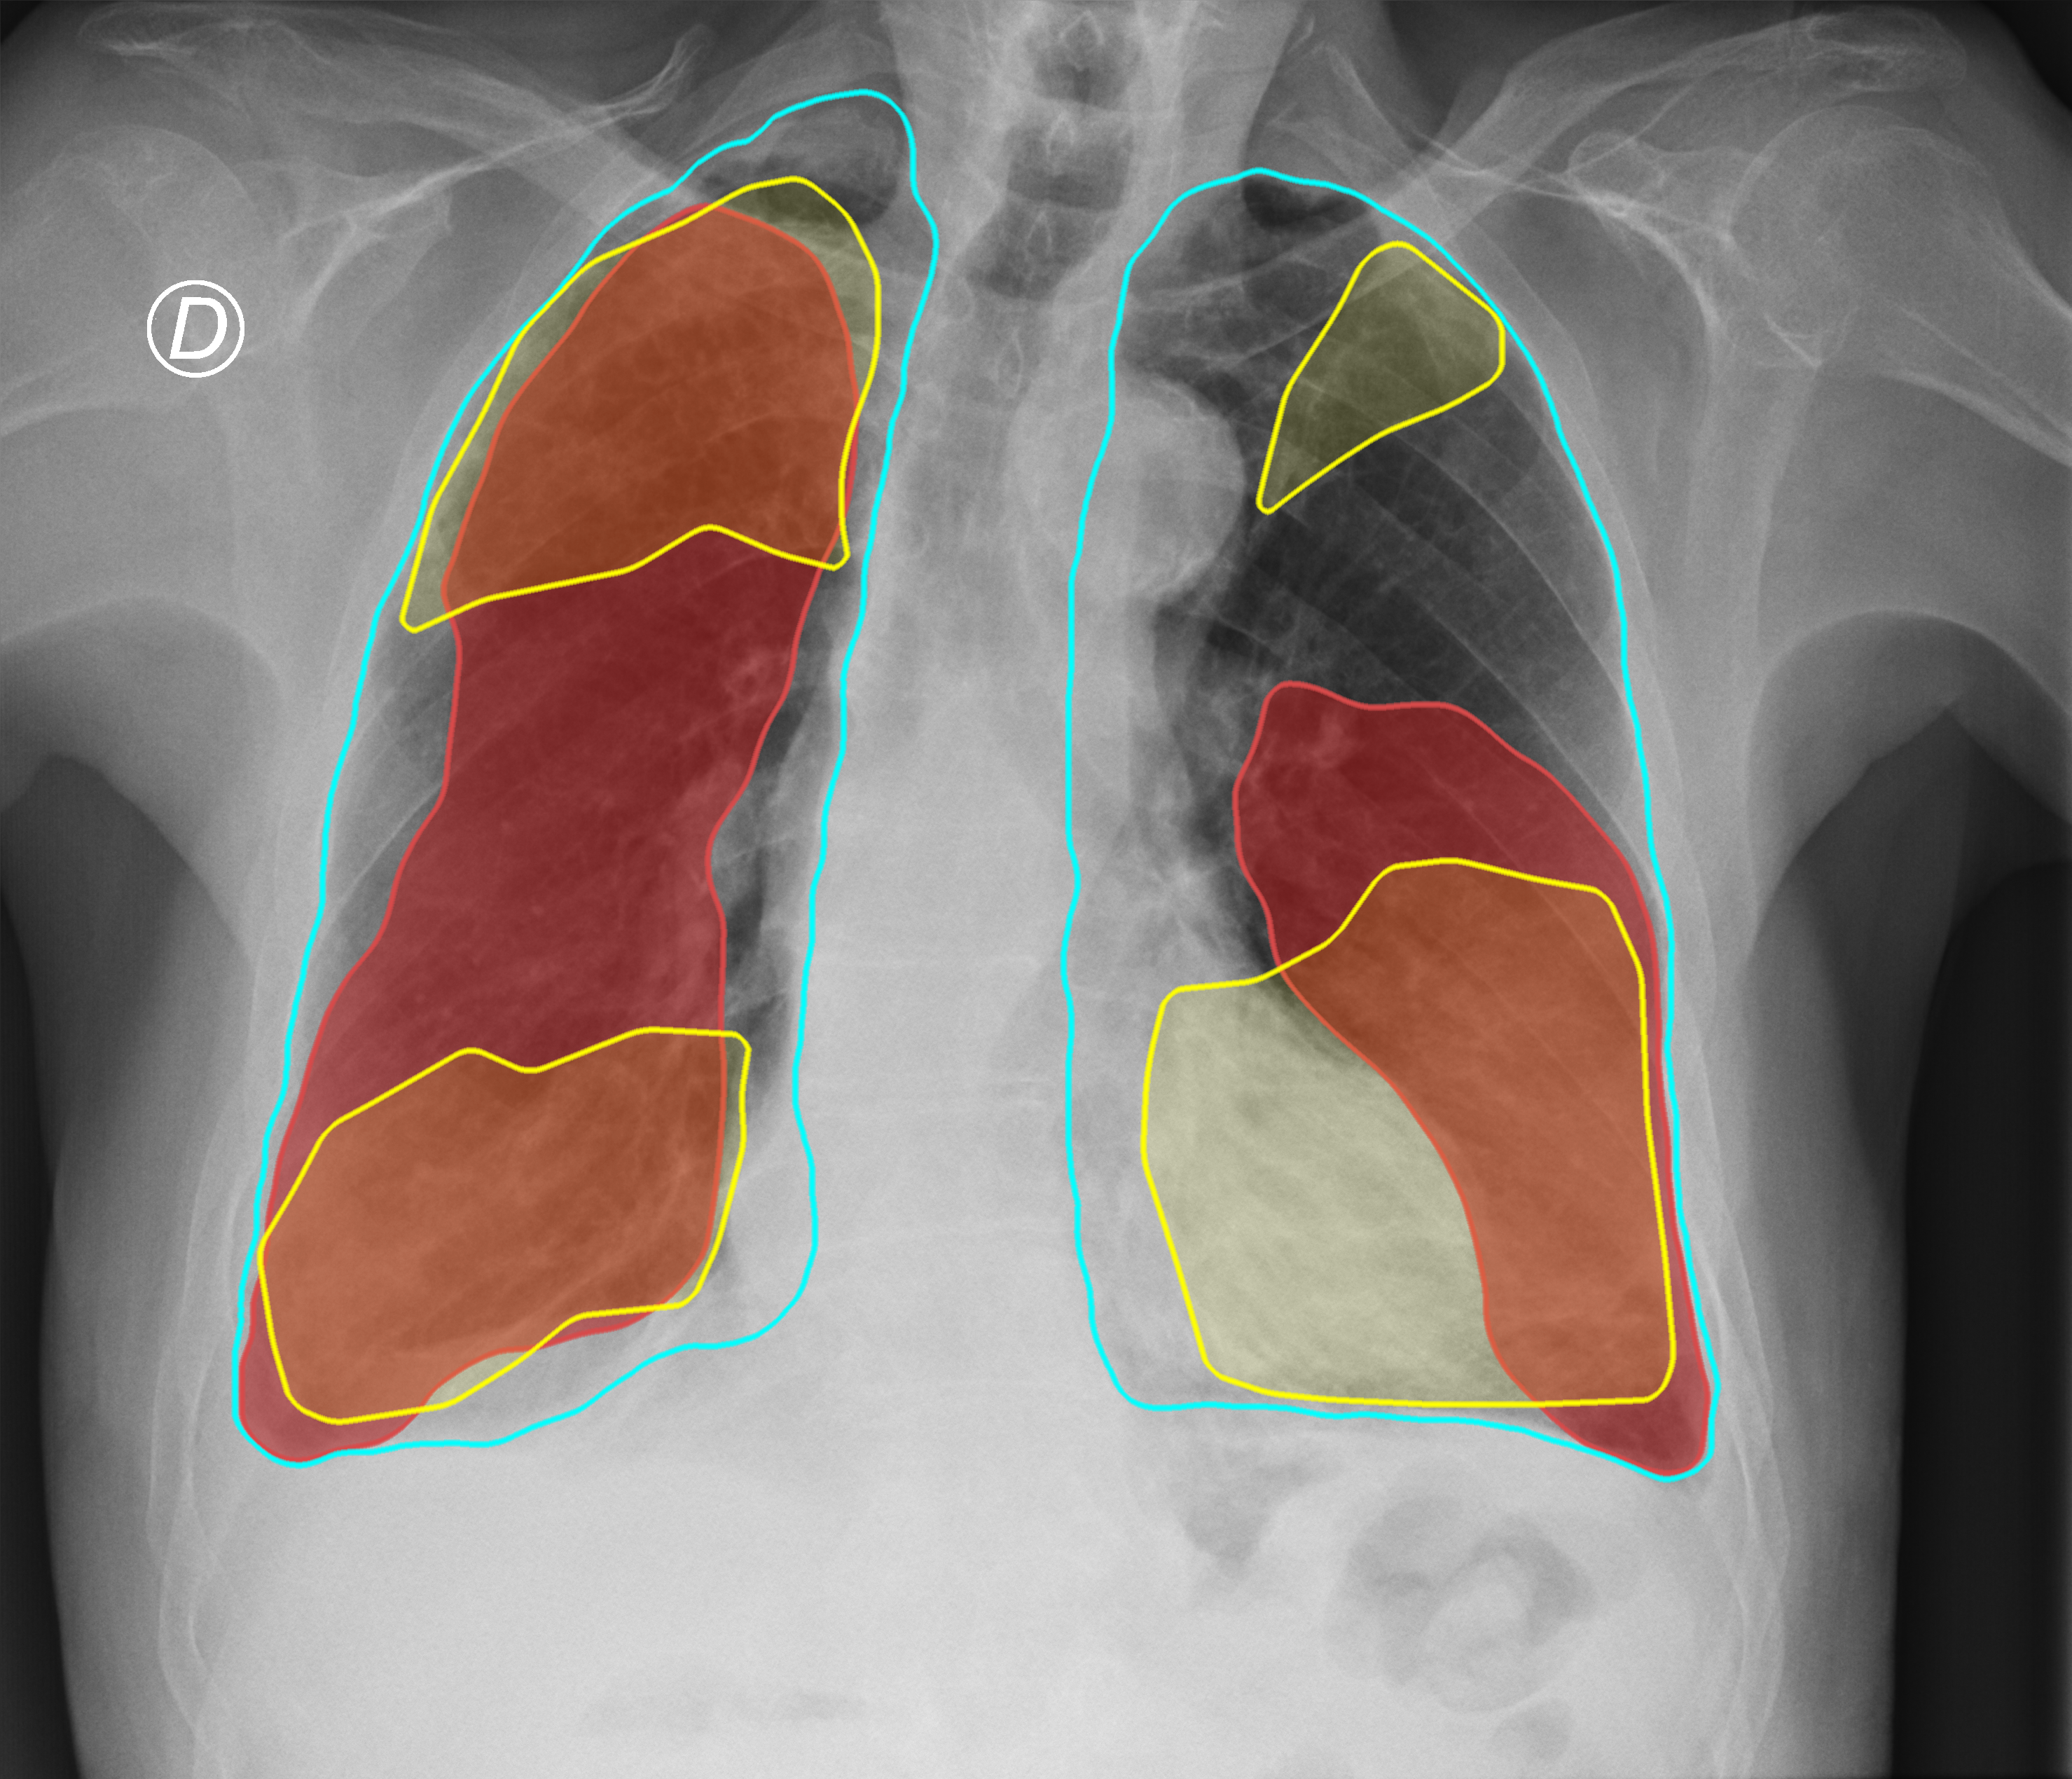
Figure 3. Comparison of the segmentation and severity score estimation of a COVID-19 subject from the ACCD dataset. A cyan delineation refers to the lung segmentation obtained by Stage I; a red mask is a disease mask obtained by Stage II; a yellow mask refers to the ground-truth segmentation of the disease

