Profile distributed training memory usage with just ONE GPU - Save time and resources while optimizing your large-scale models!
Training large models like LLMs requires careful memory management. Traditional profiling methods need full multi-GPU setups, making debugging expensive and time-consuming. This tool changes the game by allowing you to:
✅ Profile distributed training on a single GPU - No need for expensive multi-GPU setups
✅ Get instant insights - Identify memory bottlenecks in seconds, not hours
✅ Optimize before scaling - Fix memory issues early in development
✅ Save compute costs - Debug locally before deploying to clusters
Profile memory usage for TP/PP/EP configurations using just one GPU - simulate what would happen with hundreds of GPUs!
Precisely identify which layers and operations consume the most memory with PyTorch hooks integration.
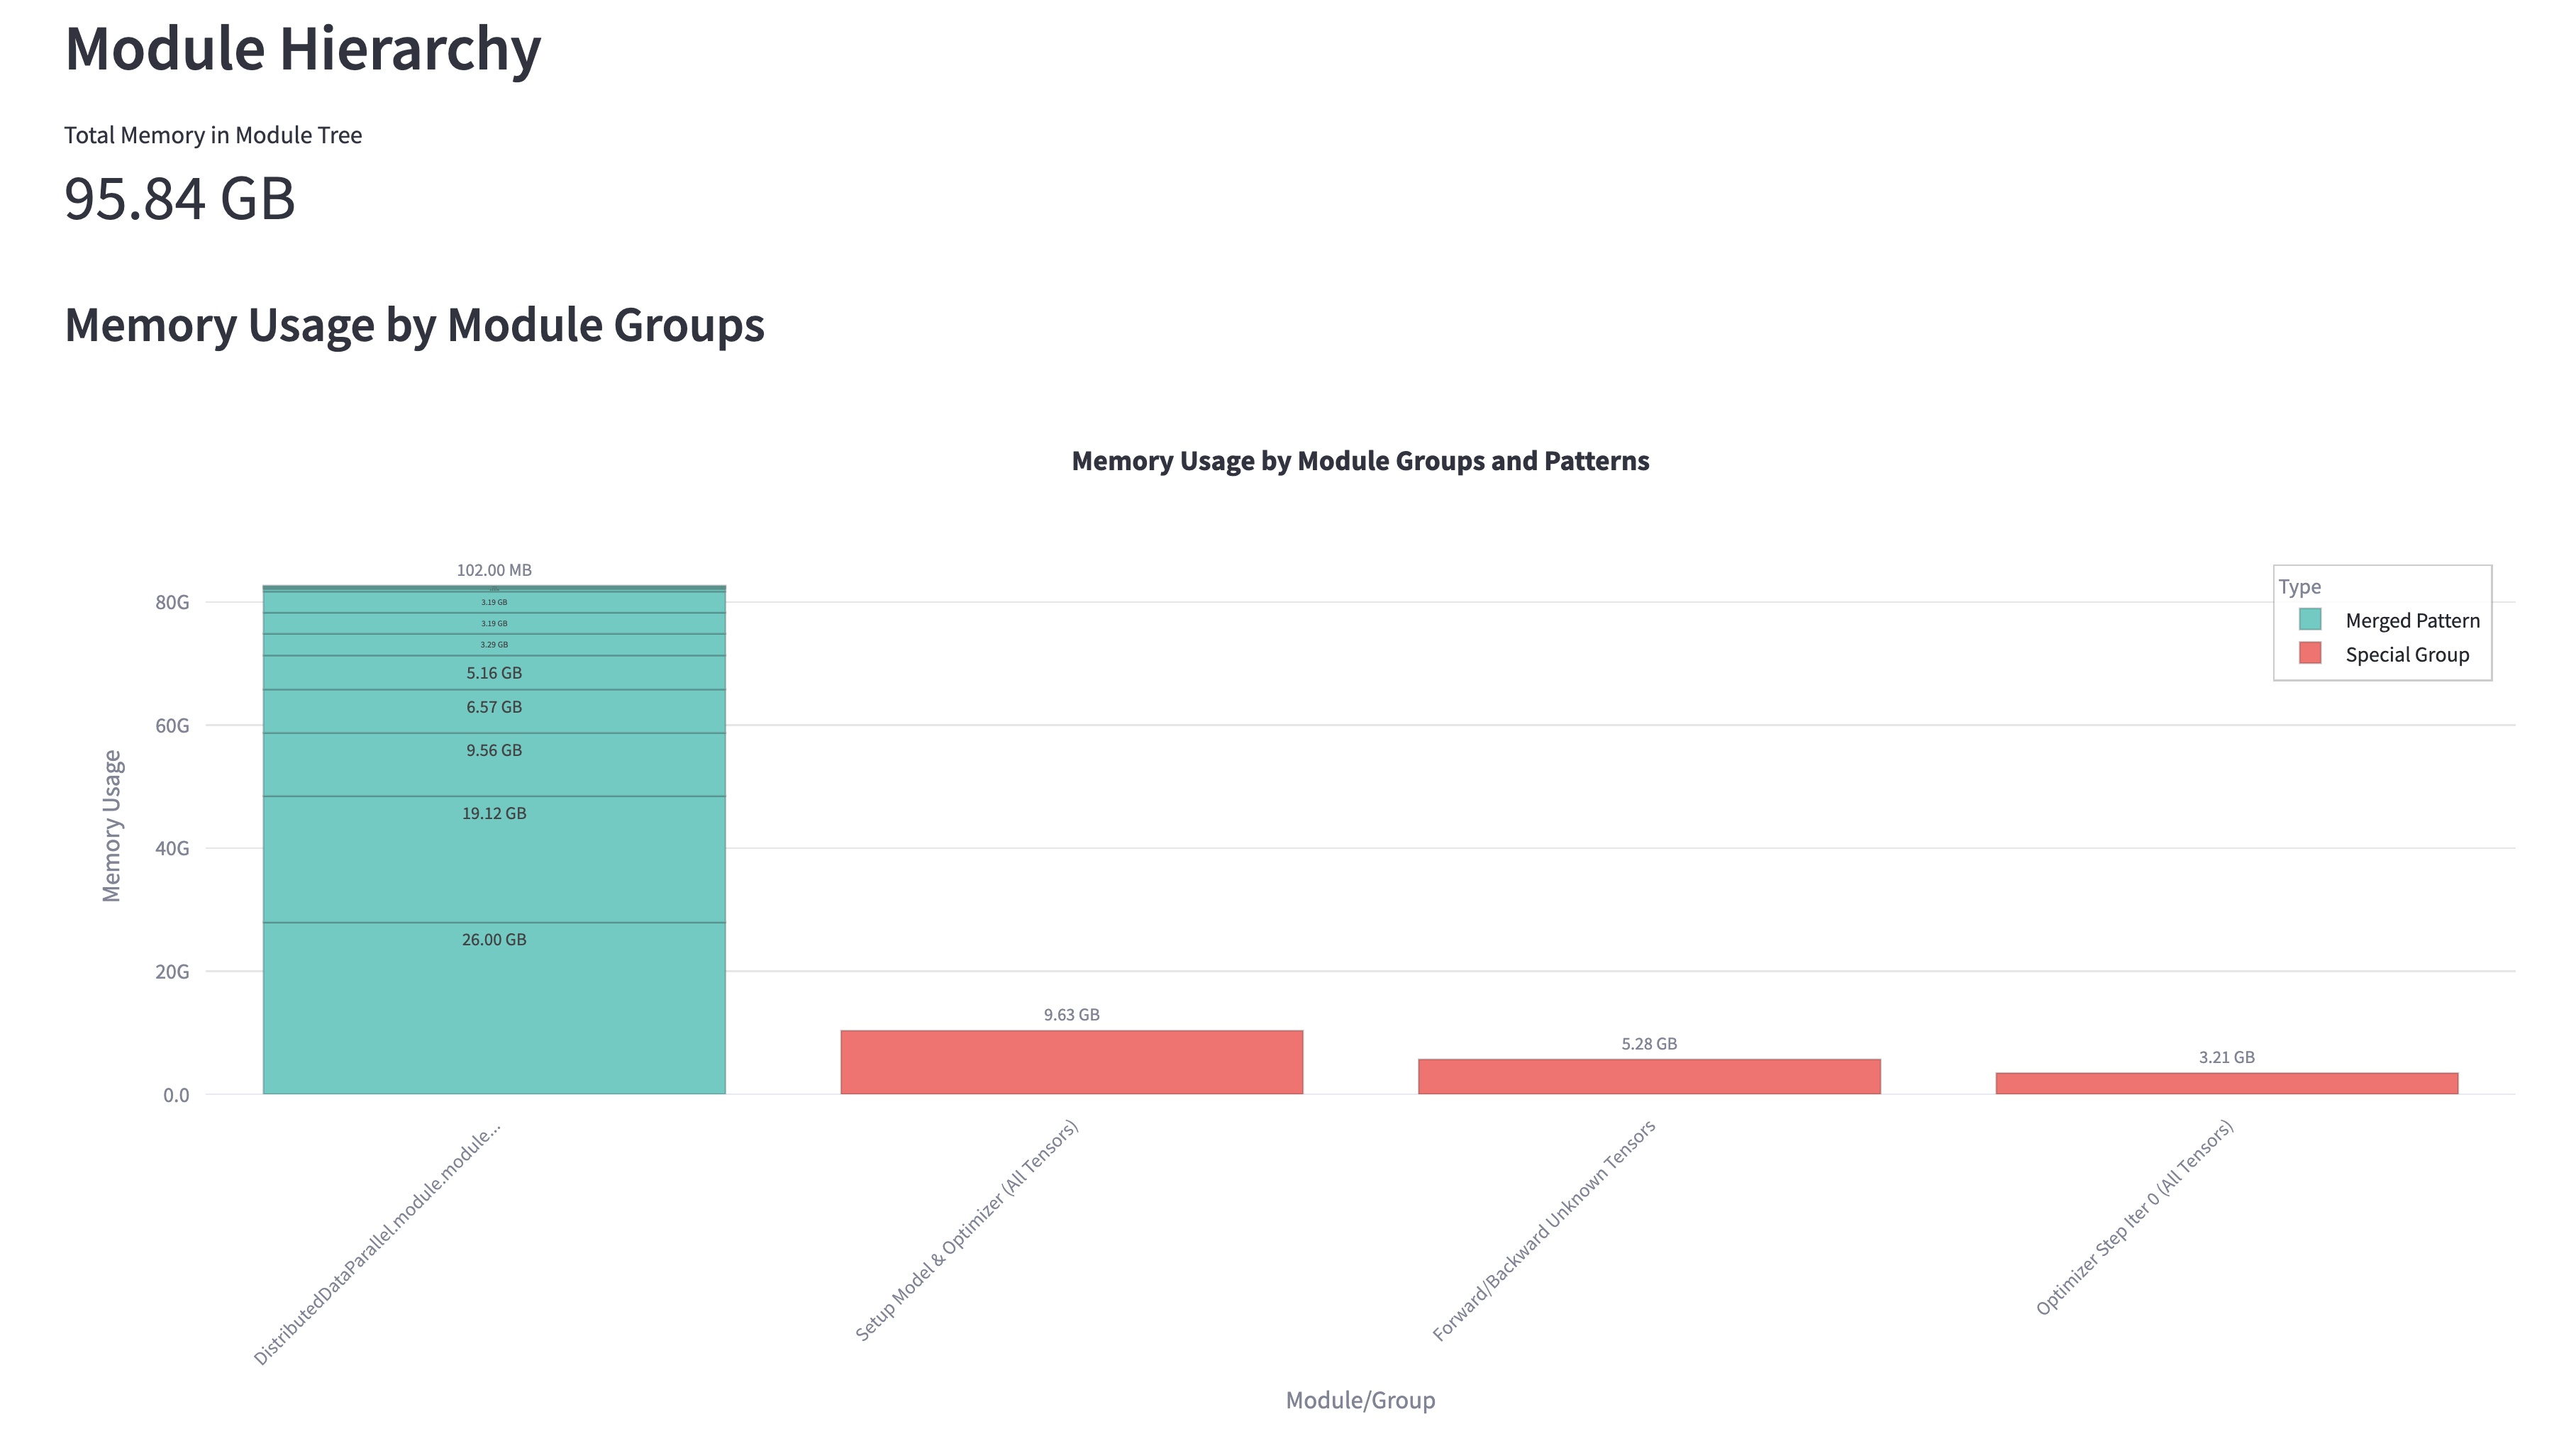
- Interactive memory usage charts
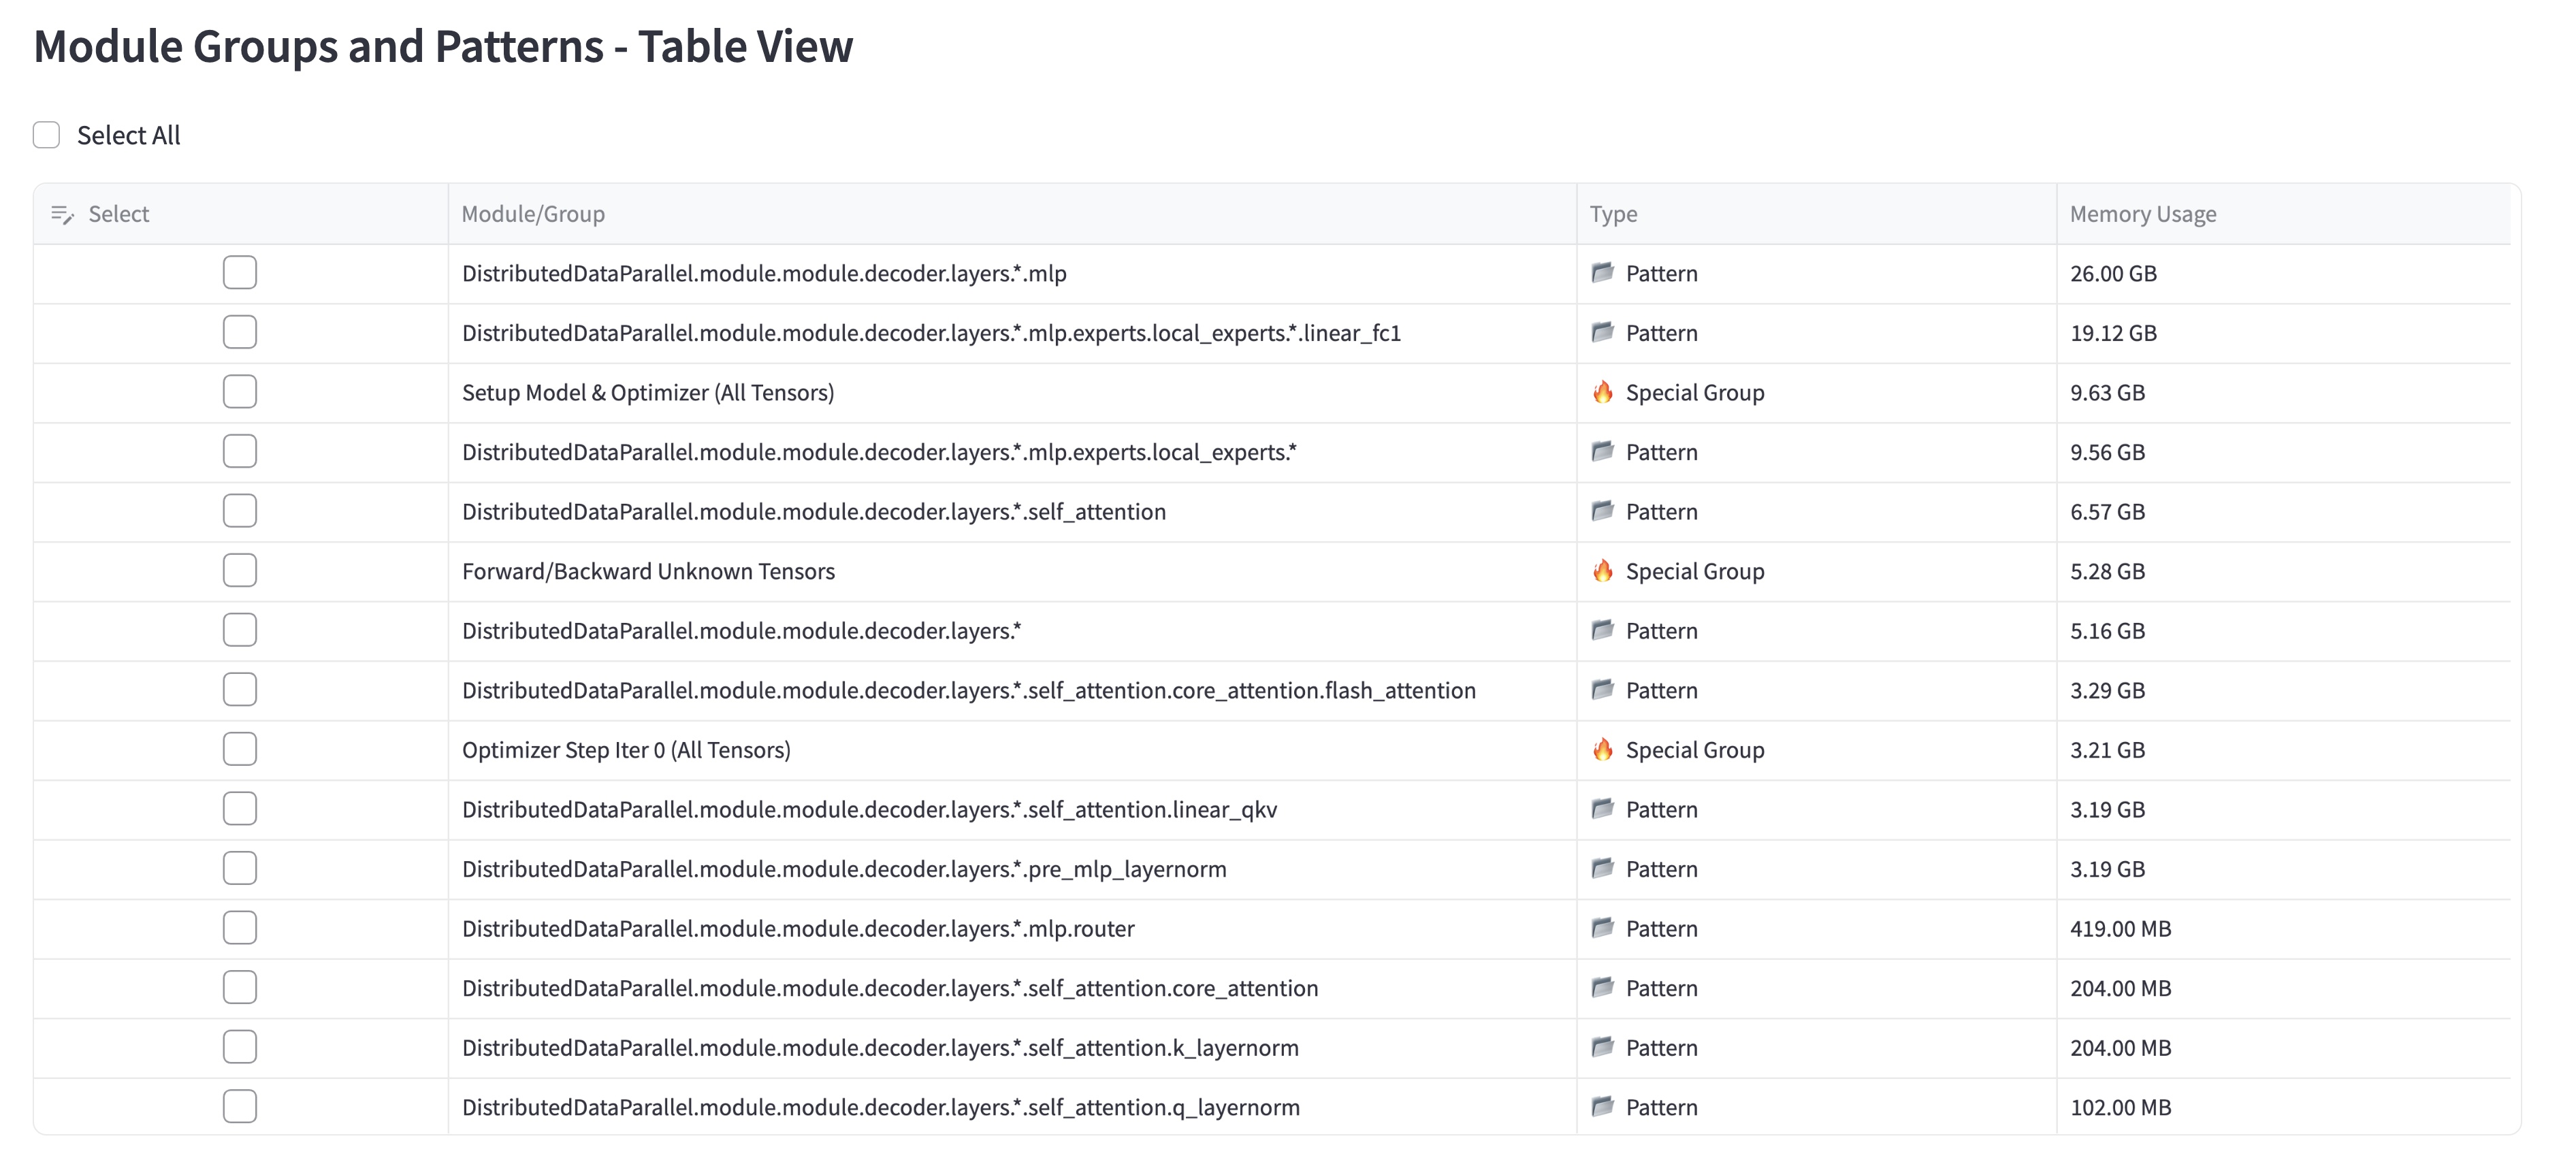
- Per-module memory breakdown
- Phase-by-phase analysis (forward, backward, optimizer)
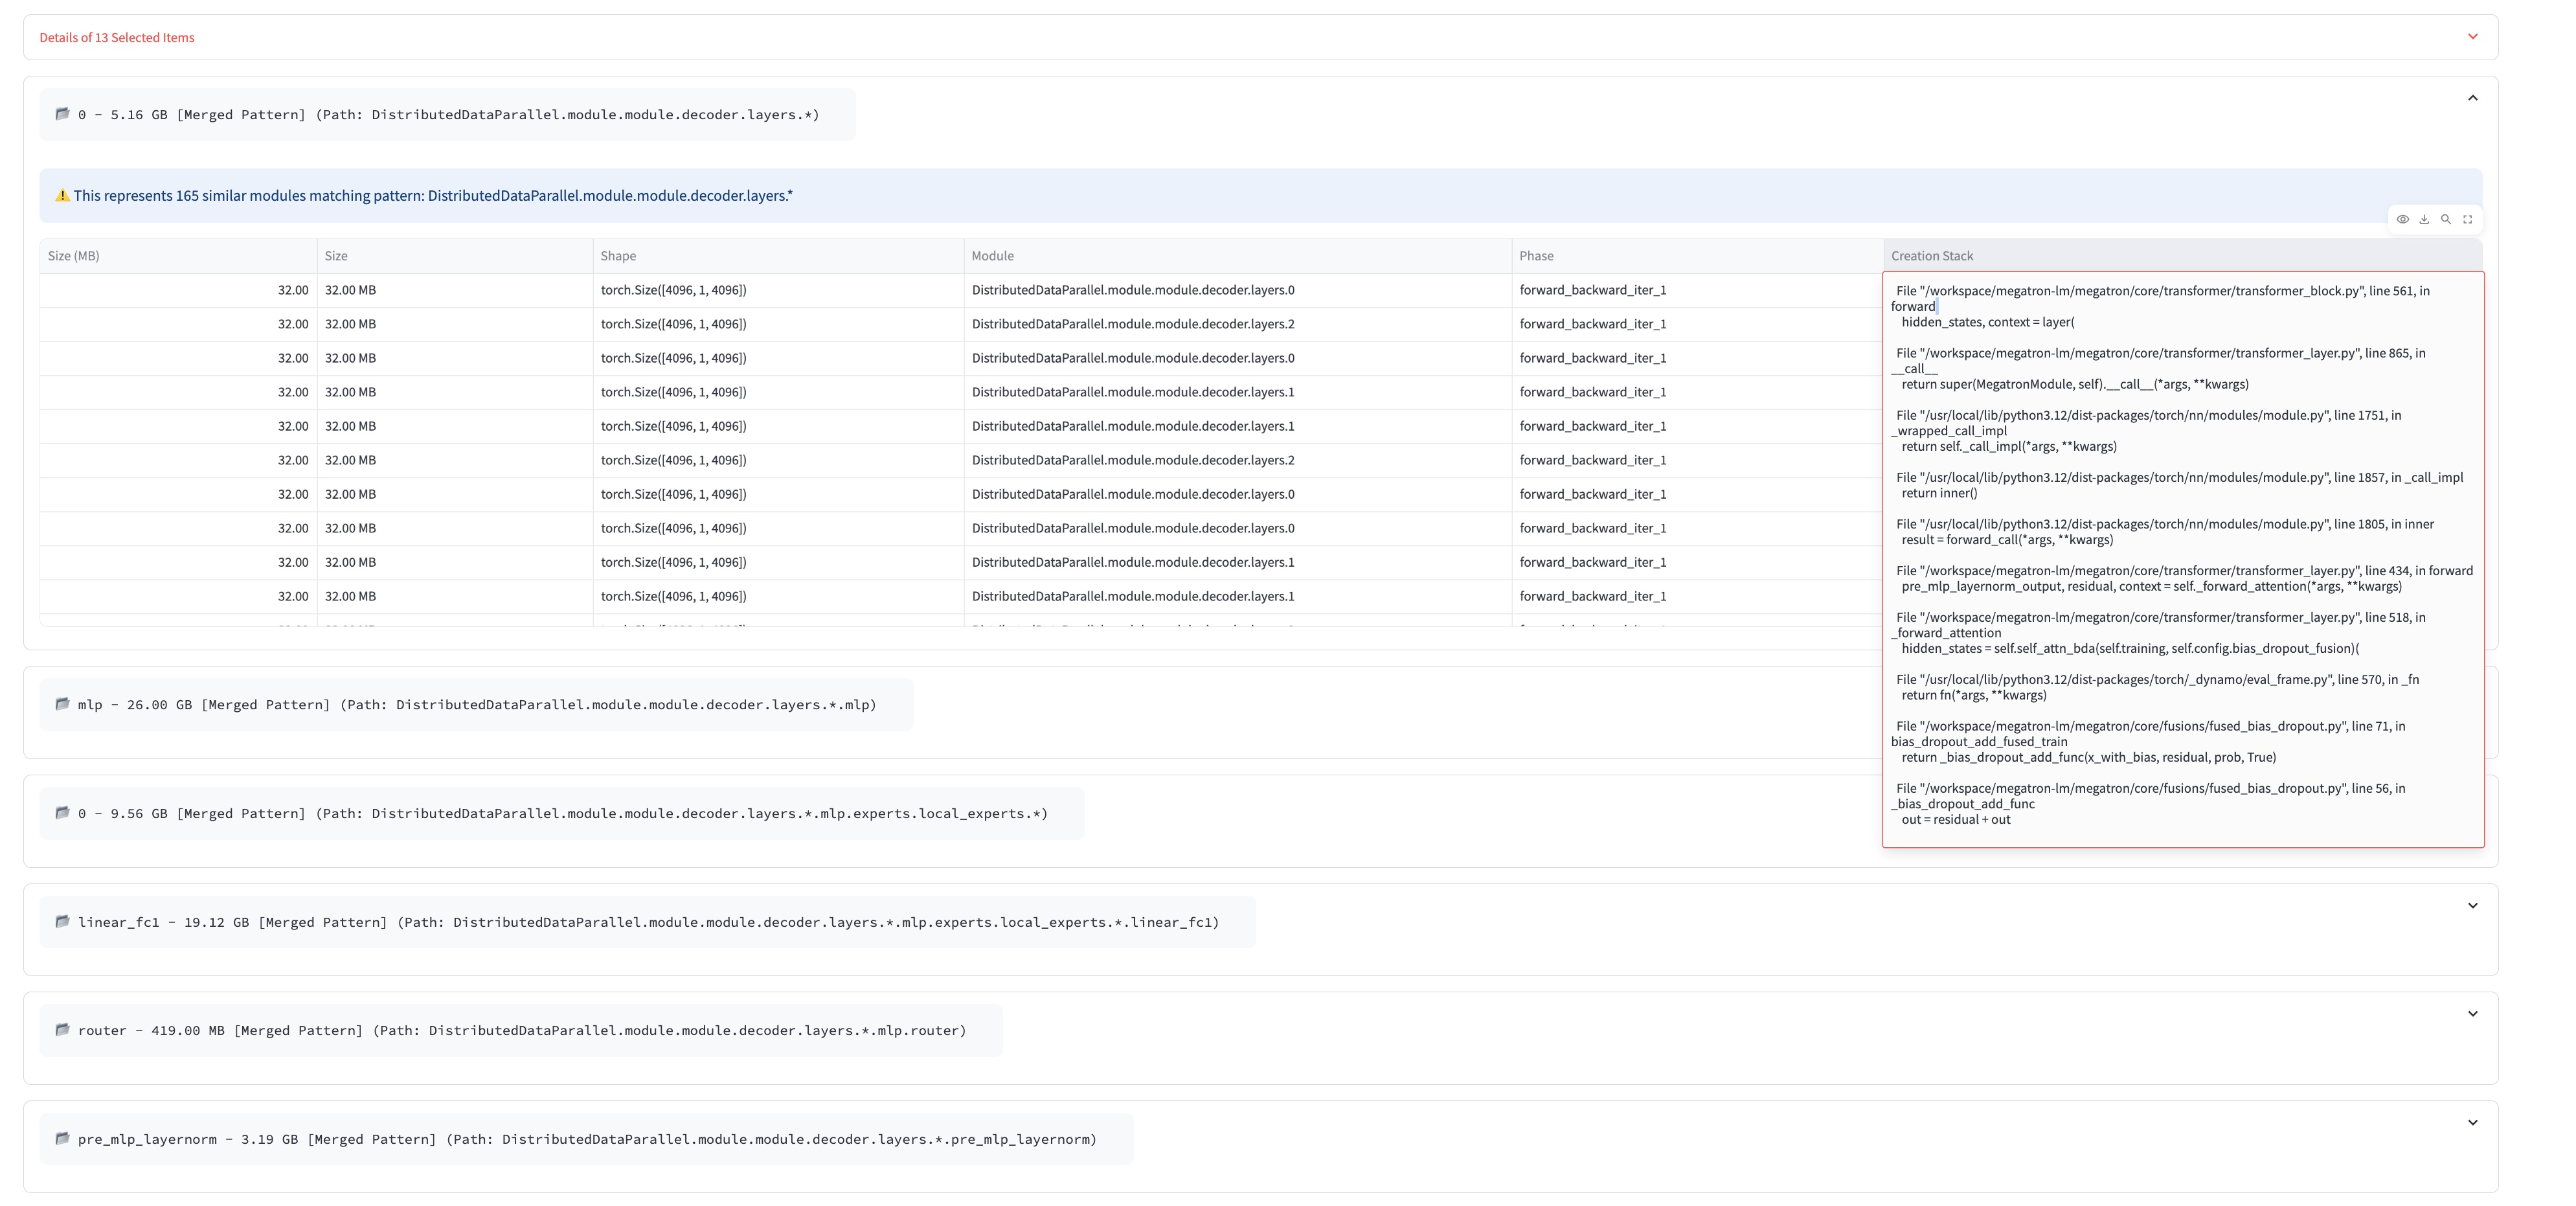
- Tensor creation statistics with stack traces
# Clone and install in one command
git clone https://github.com/Victarry/PyTorch-Memory-Profiler.git && \
cd PyTorch-Memory-Profiler && pip install .Get memory profiling running in under 2 minutes!
git clone https://github.com/Victarry/Megatron-LM.git
cd megatron-lm && git checkout denliu/patch_for_single_rank_proxycd YOUR_MEGATRON_PATH
git apply /path/to/PyTorch-Memory-Profiler/patches/memory_tracing_mcore.patchSimply add the --memory-tracing flag to your existing command:
# Your original command
torchrun --nproc-per-node=8 --nnodes=1 python pretrain_gpt.py --tensor-model-parallel-size 2 ...

# With memory profiling (runs on 1 GPU!)
export WORLD_SIZE=8 # total number of GPUs for training
export RANK=0 # rank of the tracked process
python pretrain_gpt.py --tensor-model-parallel-size 2 --memory-tracing ...| Flag | Description |
|---|---|
--memory-tracing |
Enable memory profiling (required) |
--save-peak-memory-snapshot $PATH_1 |
Save detailed memory snapshot in the peak memory point for visualization. It includes the shape and creation module and stack trace of the tracked tensors, allowing you to directly inspect tensor information or use the provided visualizer. |
--record-memory-history --save-memory-snapshot-path $PATH_2 |
Record CUDA allocator history for pytorch.org/memory_viz |
📁 Examples: Check out ./examples/megatron-lm for ready-to-use scripts!
🔹 Hacked torch distributed communication - Use hacked torch distributed communication to simulate distributed training on a single GPU.
🔹 Auto-stops after 2 iterations - Get results quickly
🔹 No dataset needed - Uses mock data automatically
🔹 Full distributed support - Works with TP, PP, EP configurations
🔹 Single process launch - No torchrun required!
Get instant insights like this:
🔍 Peak Memory Analysis Report
━━━━━━━━━━━━━━━━━━━━━━━━━━━━━━━━━━━━━━━━━━━━━━━━━━━━━━━━━━━━━━━━━━━━━━━━━
Phase                     │ Device │ Before (MB) │ After (MB) │ Delta (MB)
━━━━━━━━━━━━━━━━━━━━━━━━━━━━━━━━━━━━━━━━━━━━━━━━━━━━━━━━━━━━━━━━━━━━━━━━━
setup_model_and_optimizer │ cuda:0 │ 0.00        │ 36,466.30  │ +36,466.30
forward_backward_iter_0   │ cuda:0 │ 36,466.30   │ 140,969.36 │ +104,503.06
optimizer_step_iter_0     │ cuda:0 │ 140,969.36  │ 140,969.36 │ 0.00
forward_backward_iter_1   │ cuda:0 │ 140,969.36  │ 142,789.21 │ +1,819.85
optimizer_step_iter_1     │ cuda:0 │ 142,789.21  │ 142,789.21 │ 0.00
━━━━━━━━━━━━━━━━━━━━━━━━━━━━━━━━━━━━━━━━━━━━━━━━━━━━━━━━━━━━━━━━━━━━━━━━━
💡 Pro Tip: The profiler shows allocated memory only. Additional overhead includes:
- NCCL communication buffers
- CUDA runtime
Rule of thumb: Leave > 10 GB memory for CUDA runtime, NCCL communication buffers, and even more considering MoE imbalanced routing.
Transform your memory snapshots into actionable insights with our Streamlit-powered visualizer!
# Quick setup and launch
cd PyTorch-Memory-Profiler/tools
uv sync && uv run streamlit run visualizer.py -- --file /path/to/memory_snapshot.jsonTrack memory evolution across training phases (model setup → forward → backward → optimizer)
 Automatically groups similar layers (e.g., all transformer blocks) for pattern recognition
 Sort, filter, and drill down into specific modules and tensors
 Inspect individual tensors: shapes, dtypes, creation stack traces, and more
- Custom Integration Guide - Integrate with your own training loops
- API Reference - Complete API documentation (Coming Soon)
- Best Practices - Memory optimization tips (Coming Soon)
We welcome contributions! Please see our Contributing Guide for details.
This project is licensed under the MIT License - see the LICENSE file for details.
- Issues: GitHub Issues