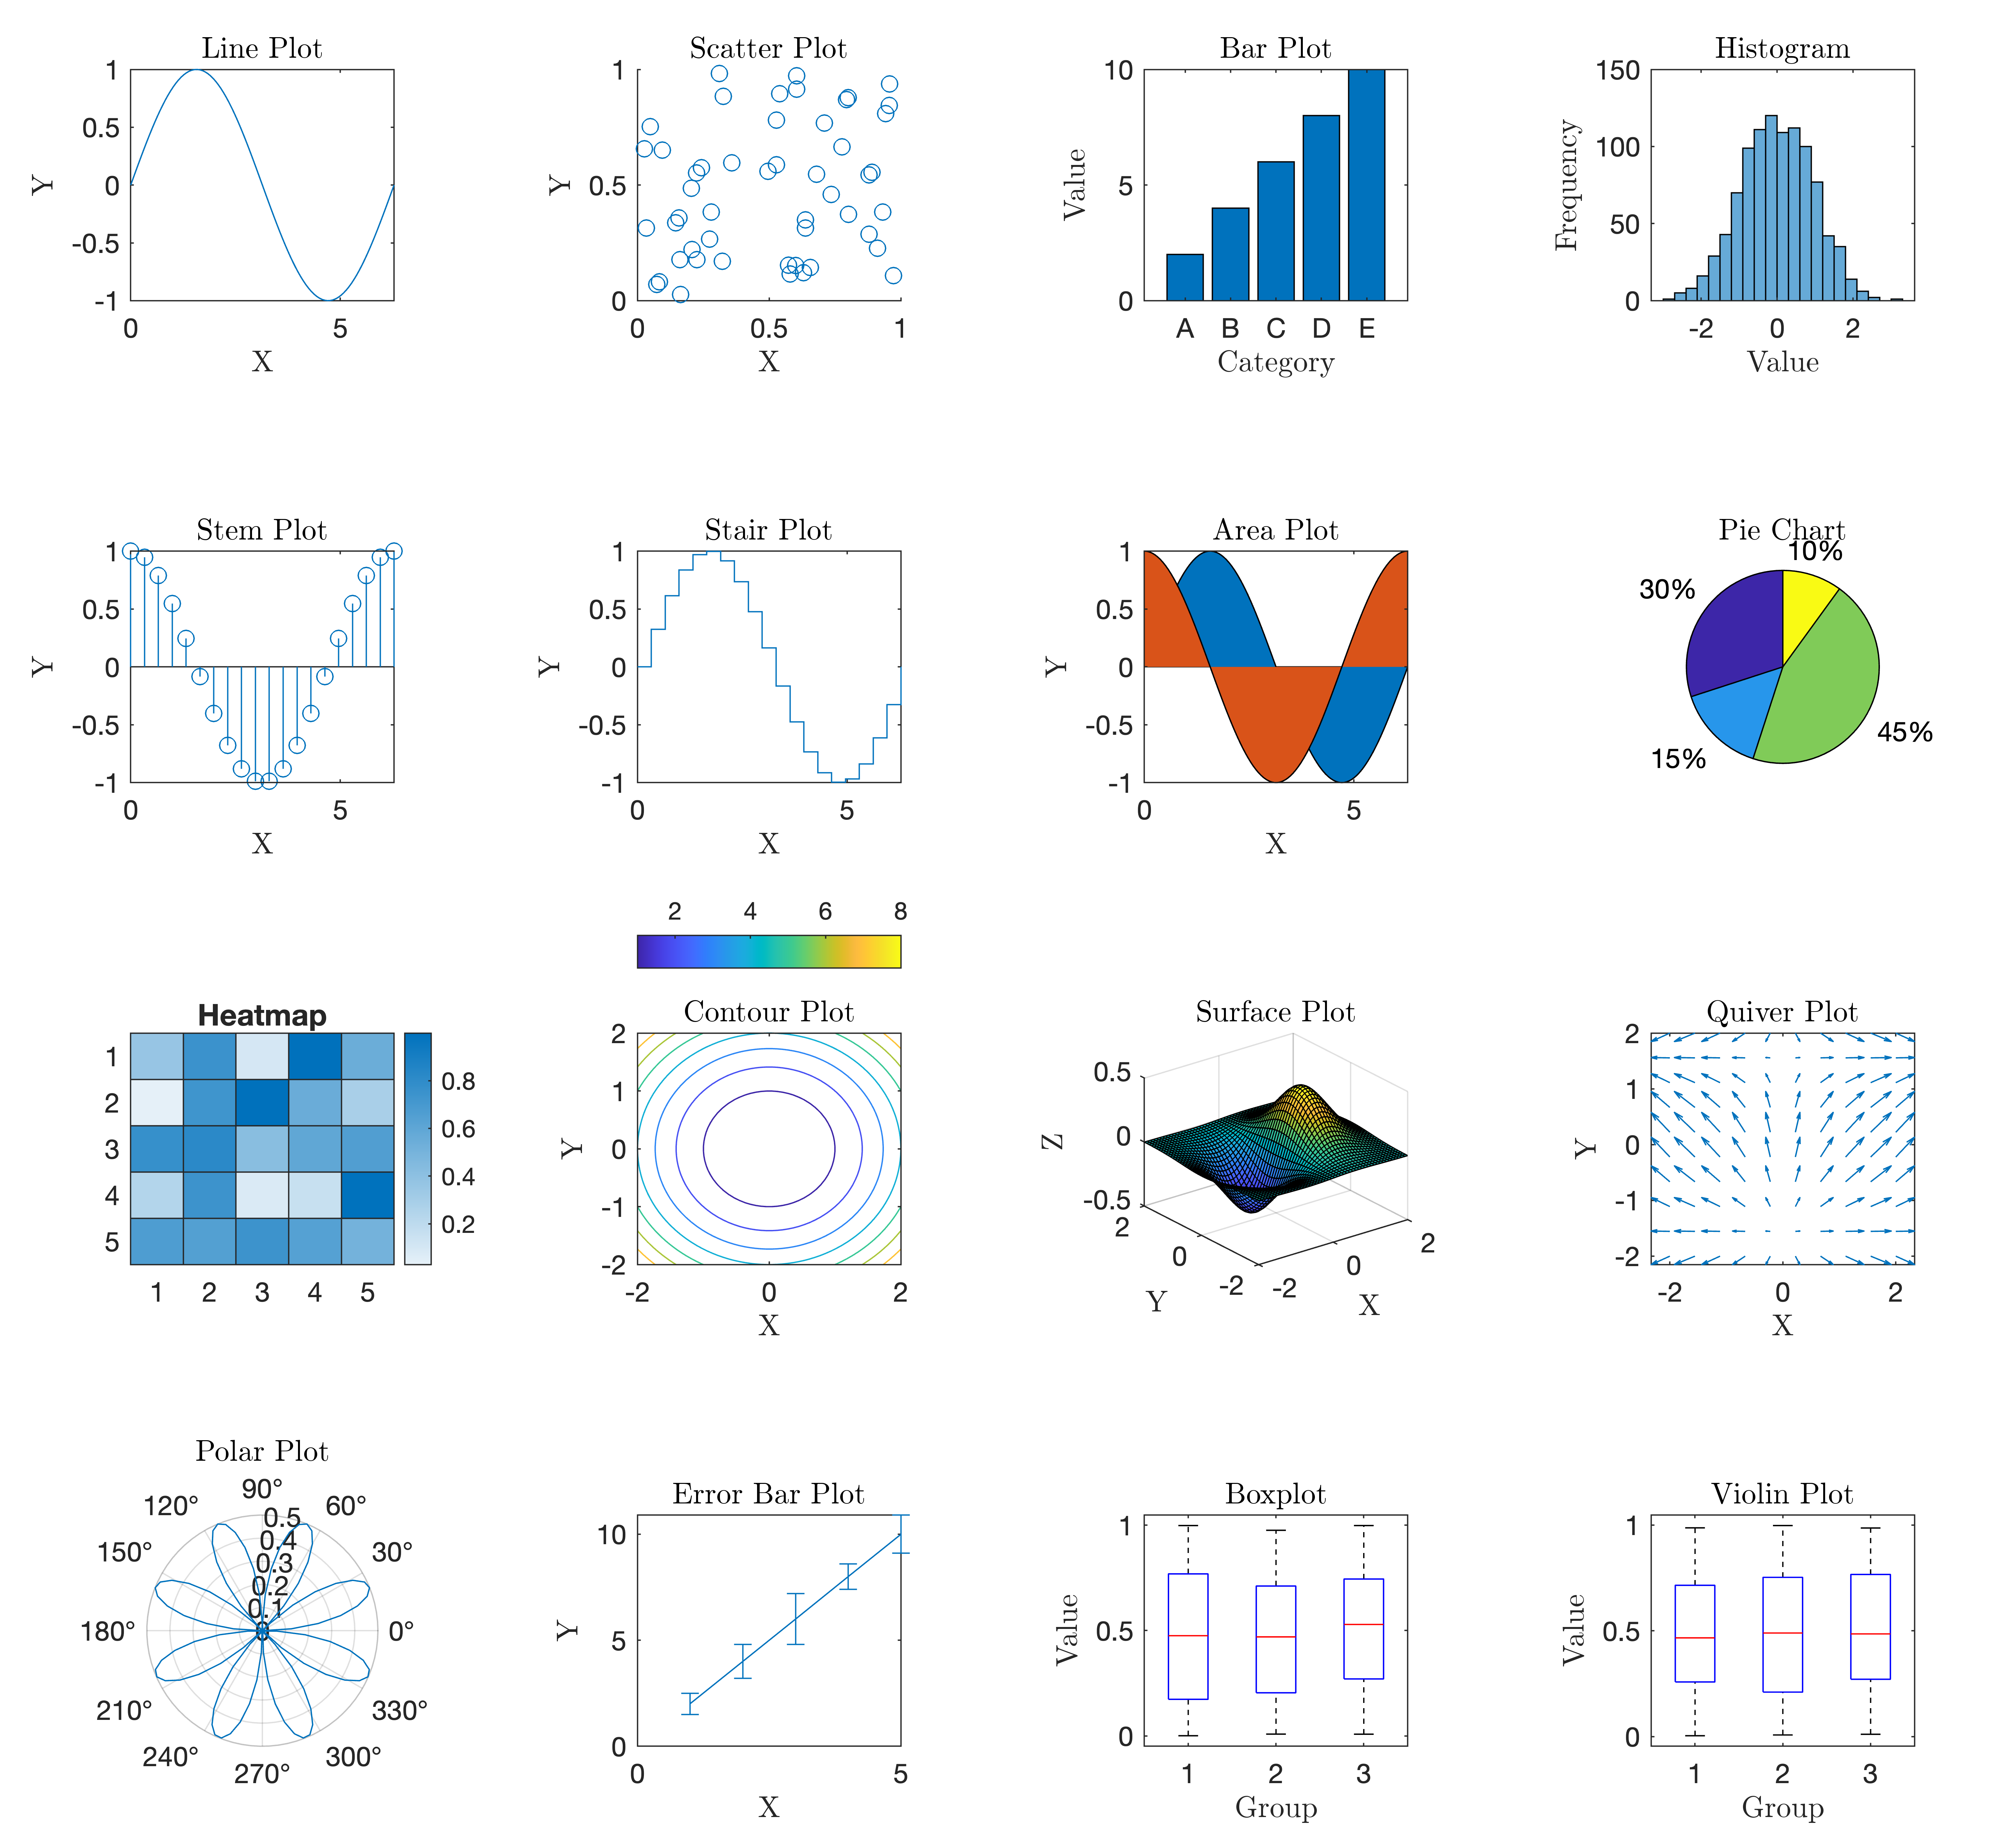
function Nplot_figure_tiledlayout(figureHandle, numPlotsPerRow, numRows, varargin) A versatile function for creating publication-quality figures with multiple plots
I often found myself spending countless hours trying to create figures that met the strict formatting guidelines of various scientific journals. It was a tedious and time-consuming process, especially when dealing with multiple plots within a single figure. That's when I decided to take matters into my own hands and develop a MATLAB function that would streamline the figure preparation process, specifically tailored to the requirements of journals.
One of the key features I incorporated was the ability to accommodate a top colorbar, seamlessly integrated into the figure layout. This addition proved to be invaluable for many research projects, allowing for clear and concise representation of data without affecting the aspect ratio of the figure.
Feel free to explore the capabilities of the function, open issues, and share ideas, customize it to suit your specific needs.
This example demonstrates how to create a figure with multiple subplots using the Nplot_figure_tiledlayout function and MATLAB's tiledlayout function.
