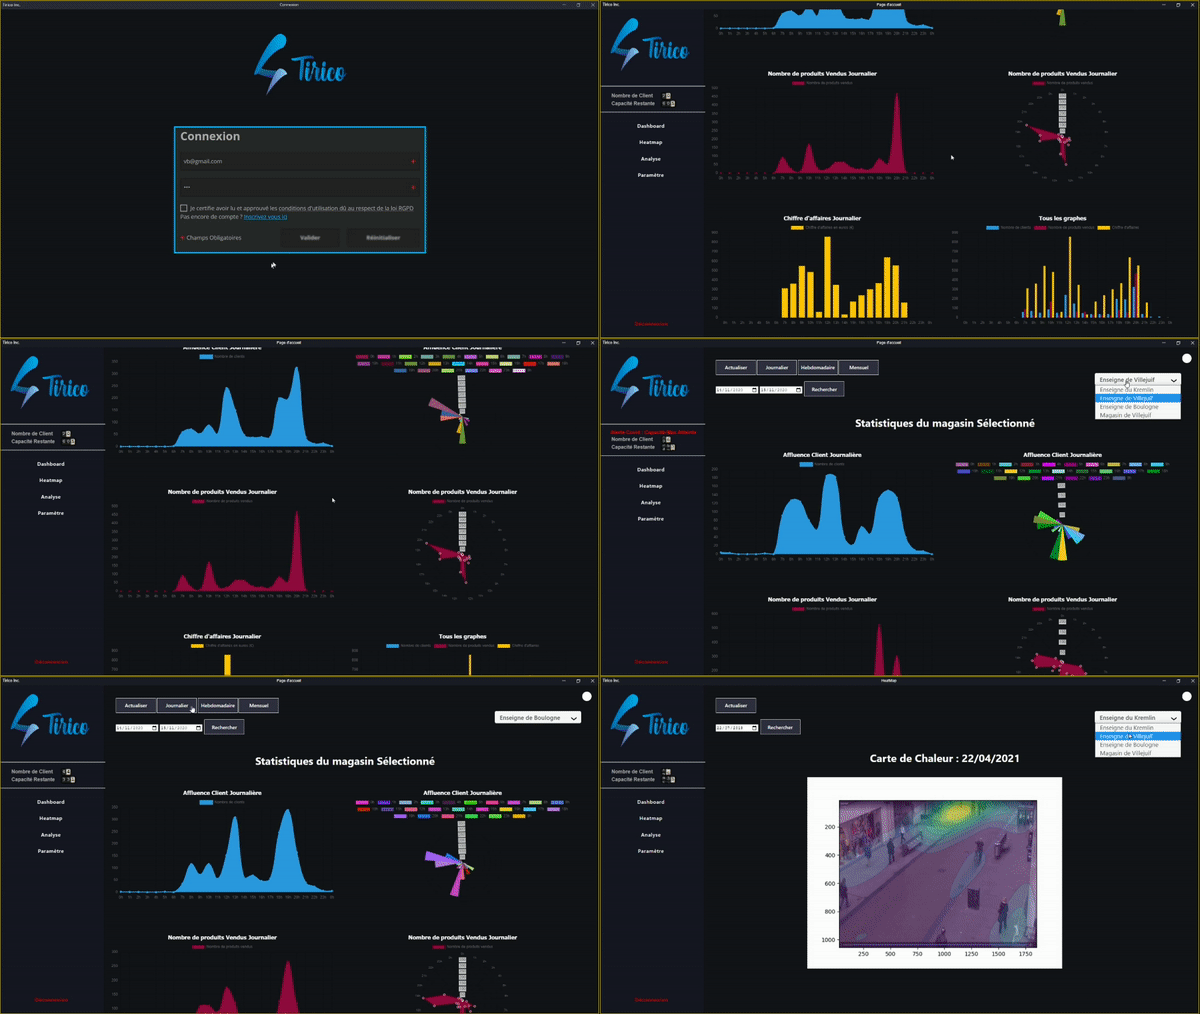
Tirico is a web-based decision support application for all store managers. It allows, from the analysis of camera images, to obtain valuable information, statistics and graphs on customer behavior, allowing your store managers to make the best decisions on the layout of the shelves. Notably on the customer journey in your shelves, via for example heat maps, or graphs on the relationship between the time spent in a department and the money spent at the cash register for the products of this same department. All our studies aim to put into perspective the correlation between the customer behavior analyzed via our camera and the analysis of the receipts. Finally, our AI-generated tips help you to better decipher our graphs and suggest possible initiatives.
We help you to better understand your customers behaviors, in order to optimize your sales!
Solution realized with :
- Electron for the front-end part (html, css, js)
- Tenserflow for the image analysis and the machine learning part (with some python for the IA part)
Find all the data in the form of graphs :
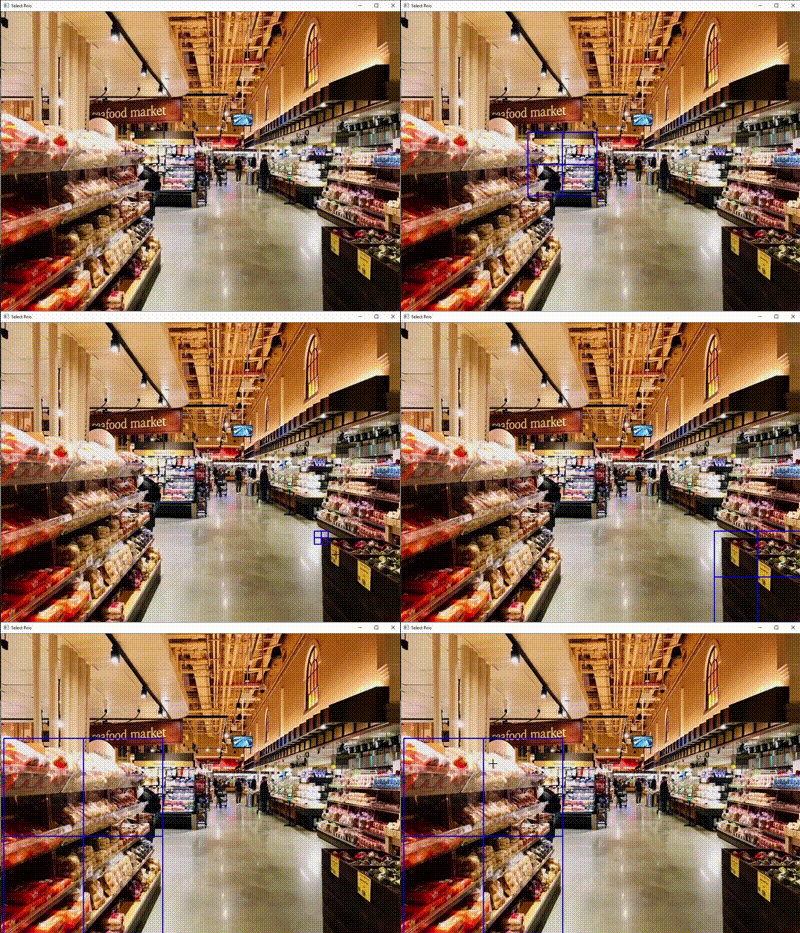
Select your sales area and indicate the types of products sold :
Find your heat maps of the different zones according to their popularity and the correlation with their specifics sells :
In your installation folder, create your git and connect it to this repository :
git init
git remote add origin https://github.com/VincentBernet/Tirico-ShopCameraAnalitics
git pull origin master
To then install all the components necessary for the application :
npm install
Installer dans Tirico_Server/code_python/data le fichier suivant :
https://drive.google.com/open?id=1cewMfusmPjYWbrnuJRuKhPMwRe_b9PaT (yolov4.weights)
To start the web-app :
npm startFor the python part (allowing generation of heat map, AI generated tips etc.) :
Install pip or anaconda to install libraries more easily :
pip install pandas                         (to create graphs)
pip install plotly                         (to create graphs)
pip install -c plotly plotly-orca          (to save in .png those graphs)
pip install seaborn                        (to create HeatMaps)
Sample login to test Tirico :
- Identifiant : vb@gmail.com | Mot de Passe : 123
On this application we have implemented multiple features such as :
- Login/Register/Logout/ForgottenPassword to access your account
- Define the number of shops you own, to compare their result and have all the diagrams on one board
- Several analytics such as heat maps, affluence graphs, purchase conversion in relation to the time spent by the customer in each department, department analysis etc. All of those analytics are for each shops, you have aswell combined analytics to compare them directly
The whole application was realized by a team of seven students during their engineering course at EFREI PARIS :
- Jean Hecke & Louis Gailhac & Serge Nicolas Excoffier
- Hélène Boersma & Emeline Bagoris
- Sébastien Friedberg & Vincent Bernet
Feel free to contact us on Github or on Linkedin
- MIT license
- Copyright 2021 © Tirico's Team.


