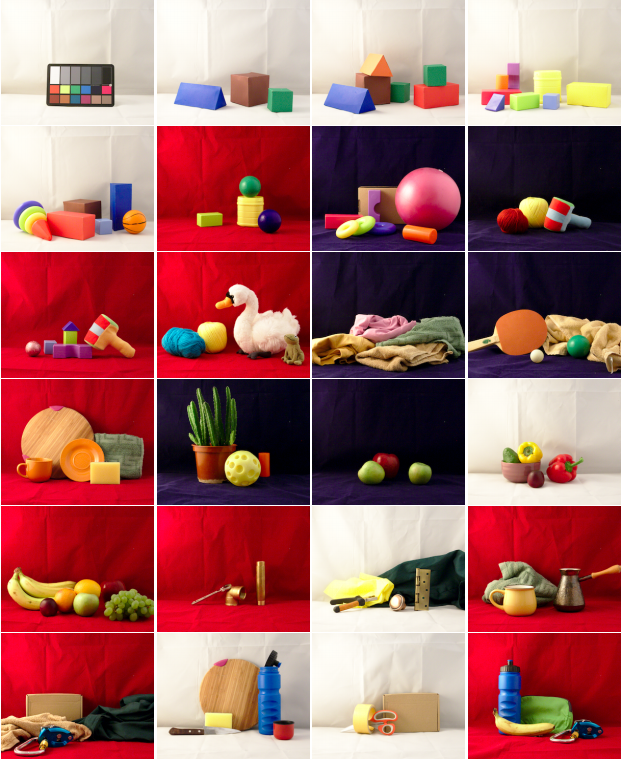
- Images of 24 multiple object scenes.
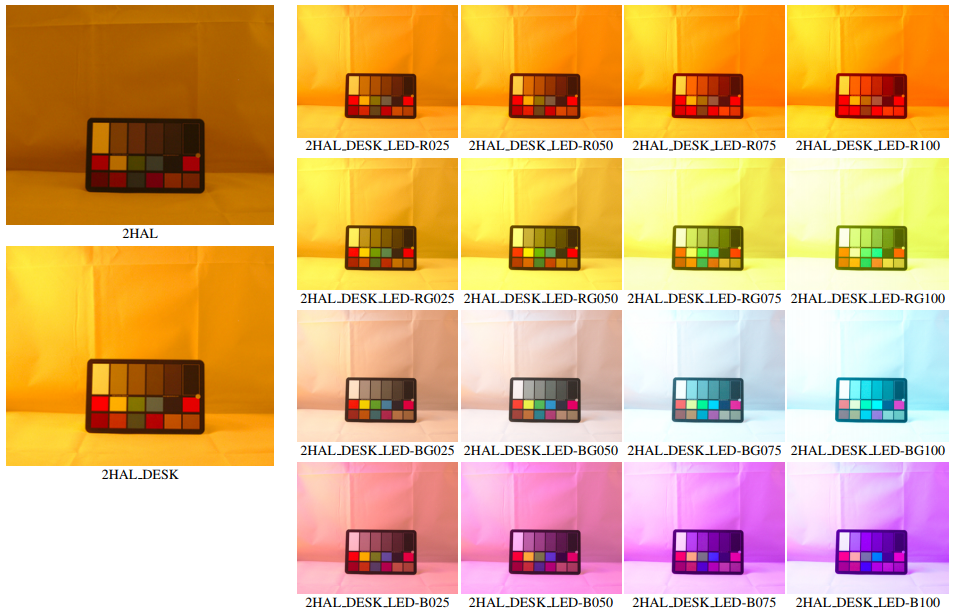
- Each scene is taken under 18 multiple light source illumination scenarios, the illuminants are varying in dominant spectral colours, intensity and distance from the scene.
- Spectral characteristics of the camera, illuminants sources and uniformly coloured object surfaces.
- Pixel-by-pixel masks of uniformly coloured object surfaces for each scene.
We mainly address the realistic scenarios for evaluation of computational colour constancy algorithms, but also have aimed to make the data as general as possible for computational colour science and computer vision. Details have been published in: Multiple Light Source Dataset for Colour Research.
If you use this dataset, please, cite the appropriate paper.
@article{smagina2019multiple,
title={Multiple Light Source Dataset for Colour Research},
author={Smagina, Anna and Ershov, Egor and Grigoryev, Anton},
journal={arXiv preprint:1908.06126},
year={2019}
}
An overview of all 24 recorded MLS scenes is given on the figure above.
Each scene was constructed inside a 60x60x60 cm softbox and illuminated from the outside. Illumination of each scene is varied in 18 configurations:
Each image of the scene is marked with a list of the turned-on light sources, which are ones of the following:
- 2HAL are two halogen lights, installed at the distance about 1.2 m each; form the lighting close to embient,
- DESK is a desktop lamp installed at 20 cm from the softbox,
- LED-R025, LED-R050, LED-RG025, LED-BG025 etc is a 3-colored (red, green, blue) LED strip mounted at the top of softbox; the letters R, RG, GB or B indicates turned-on colored components of the LED-lapm, while the numbers 025, 050, 070 and 100 indicates the percentage of the emitting power.
The shooting was performed with the white balance adjusted to 6500K. No additional white balance correction was performed during the post-processing of the images.
Each scene is also provided with the pixel-by-pixel colouring annotation given in a 8-bit PNG file, in which unique pixels colour corresponds to uniform colouring of the scene presented in a spectral data (see section below).
Full resolution (2314 x 1900)
16-bit single channel raw images ftp://vis.iitp.ru/mls-dataset/images_16bit_raw.zip 2.9 GB
masks ftp://vis.iitp.ru/mls-dataset/masks_16bit_raw.zip 4 MB
Half-resolution (1157 x 950)
16-bit linear color images ftp://vis.iitp.ru/mls-dataset/images_16bit_color.zip 2.0 GB
masks ftp://vis.iitp.ru/mls-dataset/masks_16bit_color.zip < 1 MB
To read 16-bit 3-channel PNG with Python use pypng package.
Note, that the images above are provided in hardware RGB. But some algorithms of colour vision, like colour-based image segmentation, may require not only the linearity of the colour space but also perceptually uniformity (at least more than a typical hardware RGB could provide). For that purpose, you can apply a transform to a “custom sRGB” calculated by adjusting observed with the camera and calculated from spectral data colour coordinates of colour chart patches in a linearized sRGB space (this is not a true sRGB since the image of the colour chat, used in this experiment, was taken under diffuse halogen illumination, e.g. 2HAL, instead of D65 illuminant). The linear part of this transform is given as
where alpha is a scaling coefficient for brightness normalisation (choose manually).
Quarter resolution (578 x 475) for preview
jpeg images ftp://vis.iitp.ru/mls-dataset/images_preview.zip 89 MB
masks ftp://vis.iitp.ru/mls-dataset/masks_preview.zip < 1MB
Images files are organized as following:
├── 01
│   ├── 01_2HAL_DESK_LED-B025.{tif, png, jpg}
│   ├── 01_2HAL_DESK_LED-B050.{tif, png, jpg}
│   ├── 01_2HAL_DESK_LED-B075.{tif, png, jpg}
│   ├── 01_2HAL_DESK_LED-B100.{tif, png, jpg}
│   ├── 01_2HAL_DESK_LED-BG025.{tif, png, jpg}
│   ├── ...
│   ├── 01_2HAL_DESK.{tif, png, jpg}
│   └── 01_2HAL.{tif, png, jpg}
├── 02
│   ...
├── 03
│   ...
where the subdirectory name and the first number in the file name — 01, 02, 03 etc — indicates scene number, while the other part of file name — 2HAL, 2HAL_DESK, 2HAL_DESK_LED-B025 etc — is a list of turned on illuminants (see description above in this section).
Masks files are named as <scene_number>.png.
The shooting was performed on Canon 5D Mark III, the spectral for which was measured by Baek et al. in Compact Single-Shot Hyperspectral Imaging Using a Prism. SH Baek, I Kim, D Gutierrez, MH Kim ACM Transactions on Graphics, 2017.
We also provide camera spectral data in csv-format extracted from the paper above with Web Plot Digitizer
camera spectral sensitivities ftp://vis.iitp.ru/mls-dataset/Canon5DMarkIII_spectralSensitivity.csv < 1 MB
illuminants ftp://vis.iitp.ru/mls-dataset/illuminants.zip 4 MB
surfaces ftp://vis.iitp.ru/mls-dataset/surfaces.zip < 1 MB
spectra measurement photo ftp://vis.iitp.ru/mls-dataset/spectra_measurement_photo_examples.zip 2 MB
Illuminants and surfaces spectra are given in the range from 380 nm to 780 nm with sampling every 0.6-0.7 nm.
Each illuminant and each surface has a unique name, by which the csv-file with the assotiated spectrum is named, e.g. <surface name>.csv.
The file with the spectrum contains two columns: "wavelength" and "value".
The illuminants spectra are provided along with the experimental setup scheme and the photo. All source spectra are measured through the light box, to characterize the real spectra illuminating the objects. Also, the spectrum of both halogen lamps measured near the camera lens to get some imformation on relative spectral intensities. Note, that spectra of red, green and blue lights of 3-colored LED strip are additive.
The reflectance spectra were measured relative to white matte polytetrafluoroethylene standard (please, see paper for the details).
With the surface spectra we also provide a correspodence between scene masks and the surfaces names in mask_to_surface.csv file.
By default, for each surface we provide a reflectance spectrum, measured at an angle 45 degrees.
For metallic surfaces we also measured reftance spectrum at 90 degrees, which is given in additional file named <surface name>.specular.csv
Contributions (bug reports, bug fixes, improvements, etc.) are very welcome and should be submitted in the form of new issues and/or pull requests on GitHub.
Copyright 2018 Visillect Service LLC Developed for Kharkevich Institute for Information Transmission Problems of the Russian Academy of Sciences (IITP RAS)
Licensed under a Creative Commons Attribution-ShareAlike 4.0 International License


