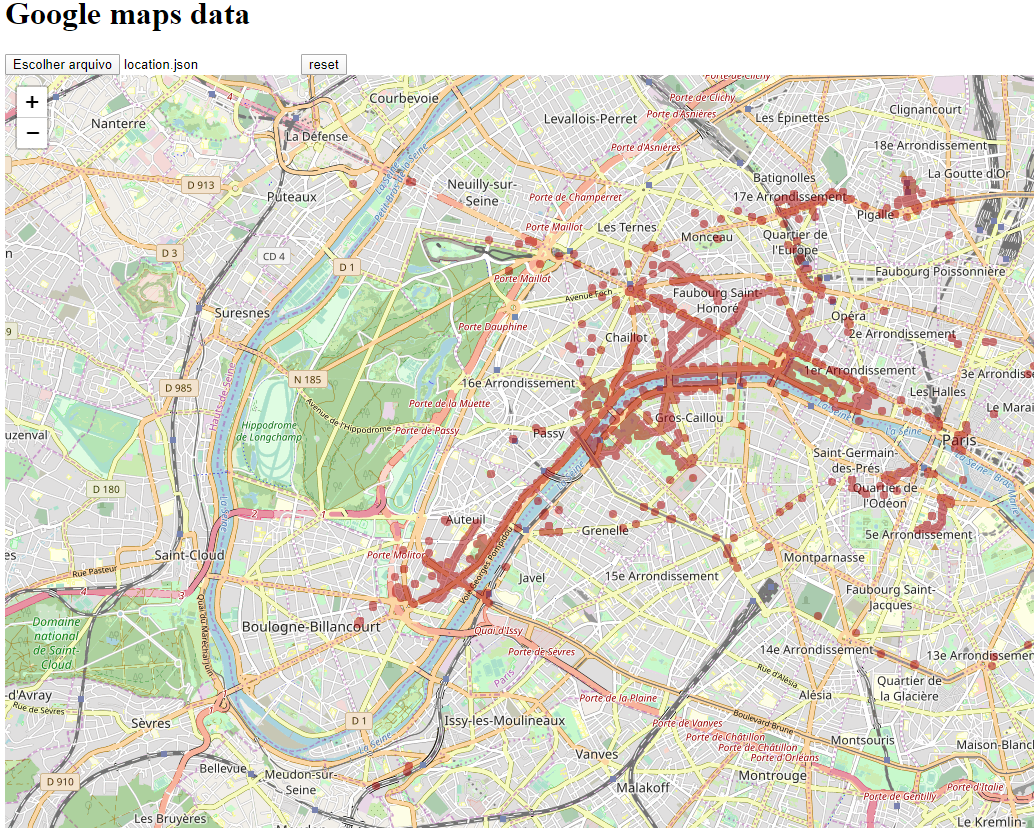
This is a feature that I miss from the google maps timeline (https://www.google.com/maps/timeline), that doesn't plot all of your data at once.
Export your data from Google using the URL https://takeout.google.com/takeout/custom/mymaps,local_actions,location_history
Extract the locations from the location_history.json file located inside the takeout*.zip and load into the site
- leaflet is the map engine (https://github.com/Leaflet/Leaflet)
- openstreetmaps as map tiles server (https://wiki.openstreetmap.org/wiki/Slippy_map_tilenames)
- leaflet-maskcanvas responsible to draw the coverage map (https://github.com/domoritz/leaflet-maskcanvas)
Google maps data format
{
  "locations" : [ {
    ...
    "latitudeE7" : 533455708,
    "longitudeE7" : -62638089,
    ...
  },
  ...
  ]
}
How to converte latitudeE7, longitudeE7 to latitude, longitude
if (latitudeE7 > 900000000)
    latitudeE7 = latitudeE7 - 4294967296;
if (longitudeE7 > 1800000000)
    longitudeE7 = longitudeE7 - 4294967296;
latitudeE7 /= 1e7;
longitudeE7 /= 1e7;- Restrict the coverage area by clicking in 4 points on the screen.
