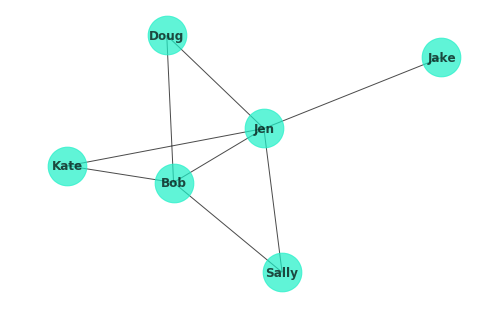
The primary package for analyzing network graphs in Python is NetworkX. In this lesson you'll get a brief introduction to the package, recreating the basic graphs from the previous lesson by adding nodes and edges and then creating a visual.
You will be able to:
- Create basic network graphs with networkx
- Add nodes and edges to networkx graphs
- Visualize network graphs with networkx
Creating the initial graph is incredible simple. Observe:
import networkx as nx
G = nx.Graph()From there, adding nodes is just as easy. Simply call the .add_node() method from you graph instance.
G.add_node('Bob')Of course, you can also combine this with some of your previous Python prowess!
people = ['Sally', 'Kate', 'Jen', 'Jake', 'Doug']
for person in people:
G.add_node(person)Similarly, adding edges is also quite straightforward.
G.add_edge('Bob', 'Sally')Once again, you can also take advantage of your knowledge of Python data structures to create a nested data structure and then feed these pairs into the .add_edge() method.
relations = {'Bob': ['Jen', 'Kate'],
            'Jen': ['Bob', 'Sally', 'Jake', 'Doug', 'Kate'],
            'Doug': ['Bob']
            }
for p1 in relations.keys():
    p2s = relations[p1]
    for p2 in p2s:
G.add_edge(p1, p2)Finally, let's take a look at visualizing this graph! The only required parameter to the nx.draw() function is specifying the graph itself. In addition, demonstrated below are a number of optional parameters:
with_labels(boolean) - would you like labels for your nodes?node_color(color) - what color do you want your nodes?node_size(real) - how big do you want your nodes? (300 is default)alpha(real) - node transparency, must be between 0 and 1, 1 being the defaultfont_weight(string) - additional formatting for the label text
%matplotlib inline
nx.draw(G, with_labels=True, node_color='#1cf0c7', node_size=1500, alpha=0.7, font_weight='bold')Well done! In this lesson, you got a brief introduction to using the NetworkX library to create and visualize graph networks. In the upcoming lab, you'll get a chance to practice these skills before moving on to common algorithms and metrics for processing and interpreting network graphs.
