- Environment setup
- Create Microservice with Quarkus
- Running PostgreSQL in Kubernetes
- Connect Quarkus service to PostgreSQL
- MicroProfile OpenAPI Specification
- MicroProfile Metrics
- View Metrics with Prometheus and Grafana
- Centralized Logging with EFK
- Securing Service with Keycloak
- Add OpenID Connect to Quarkus service
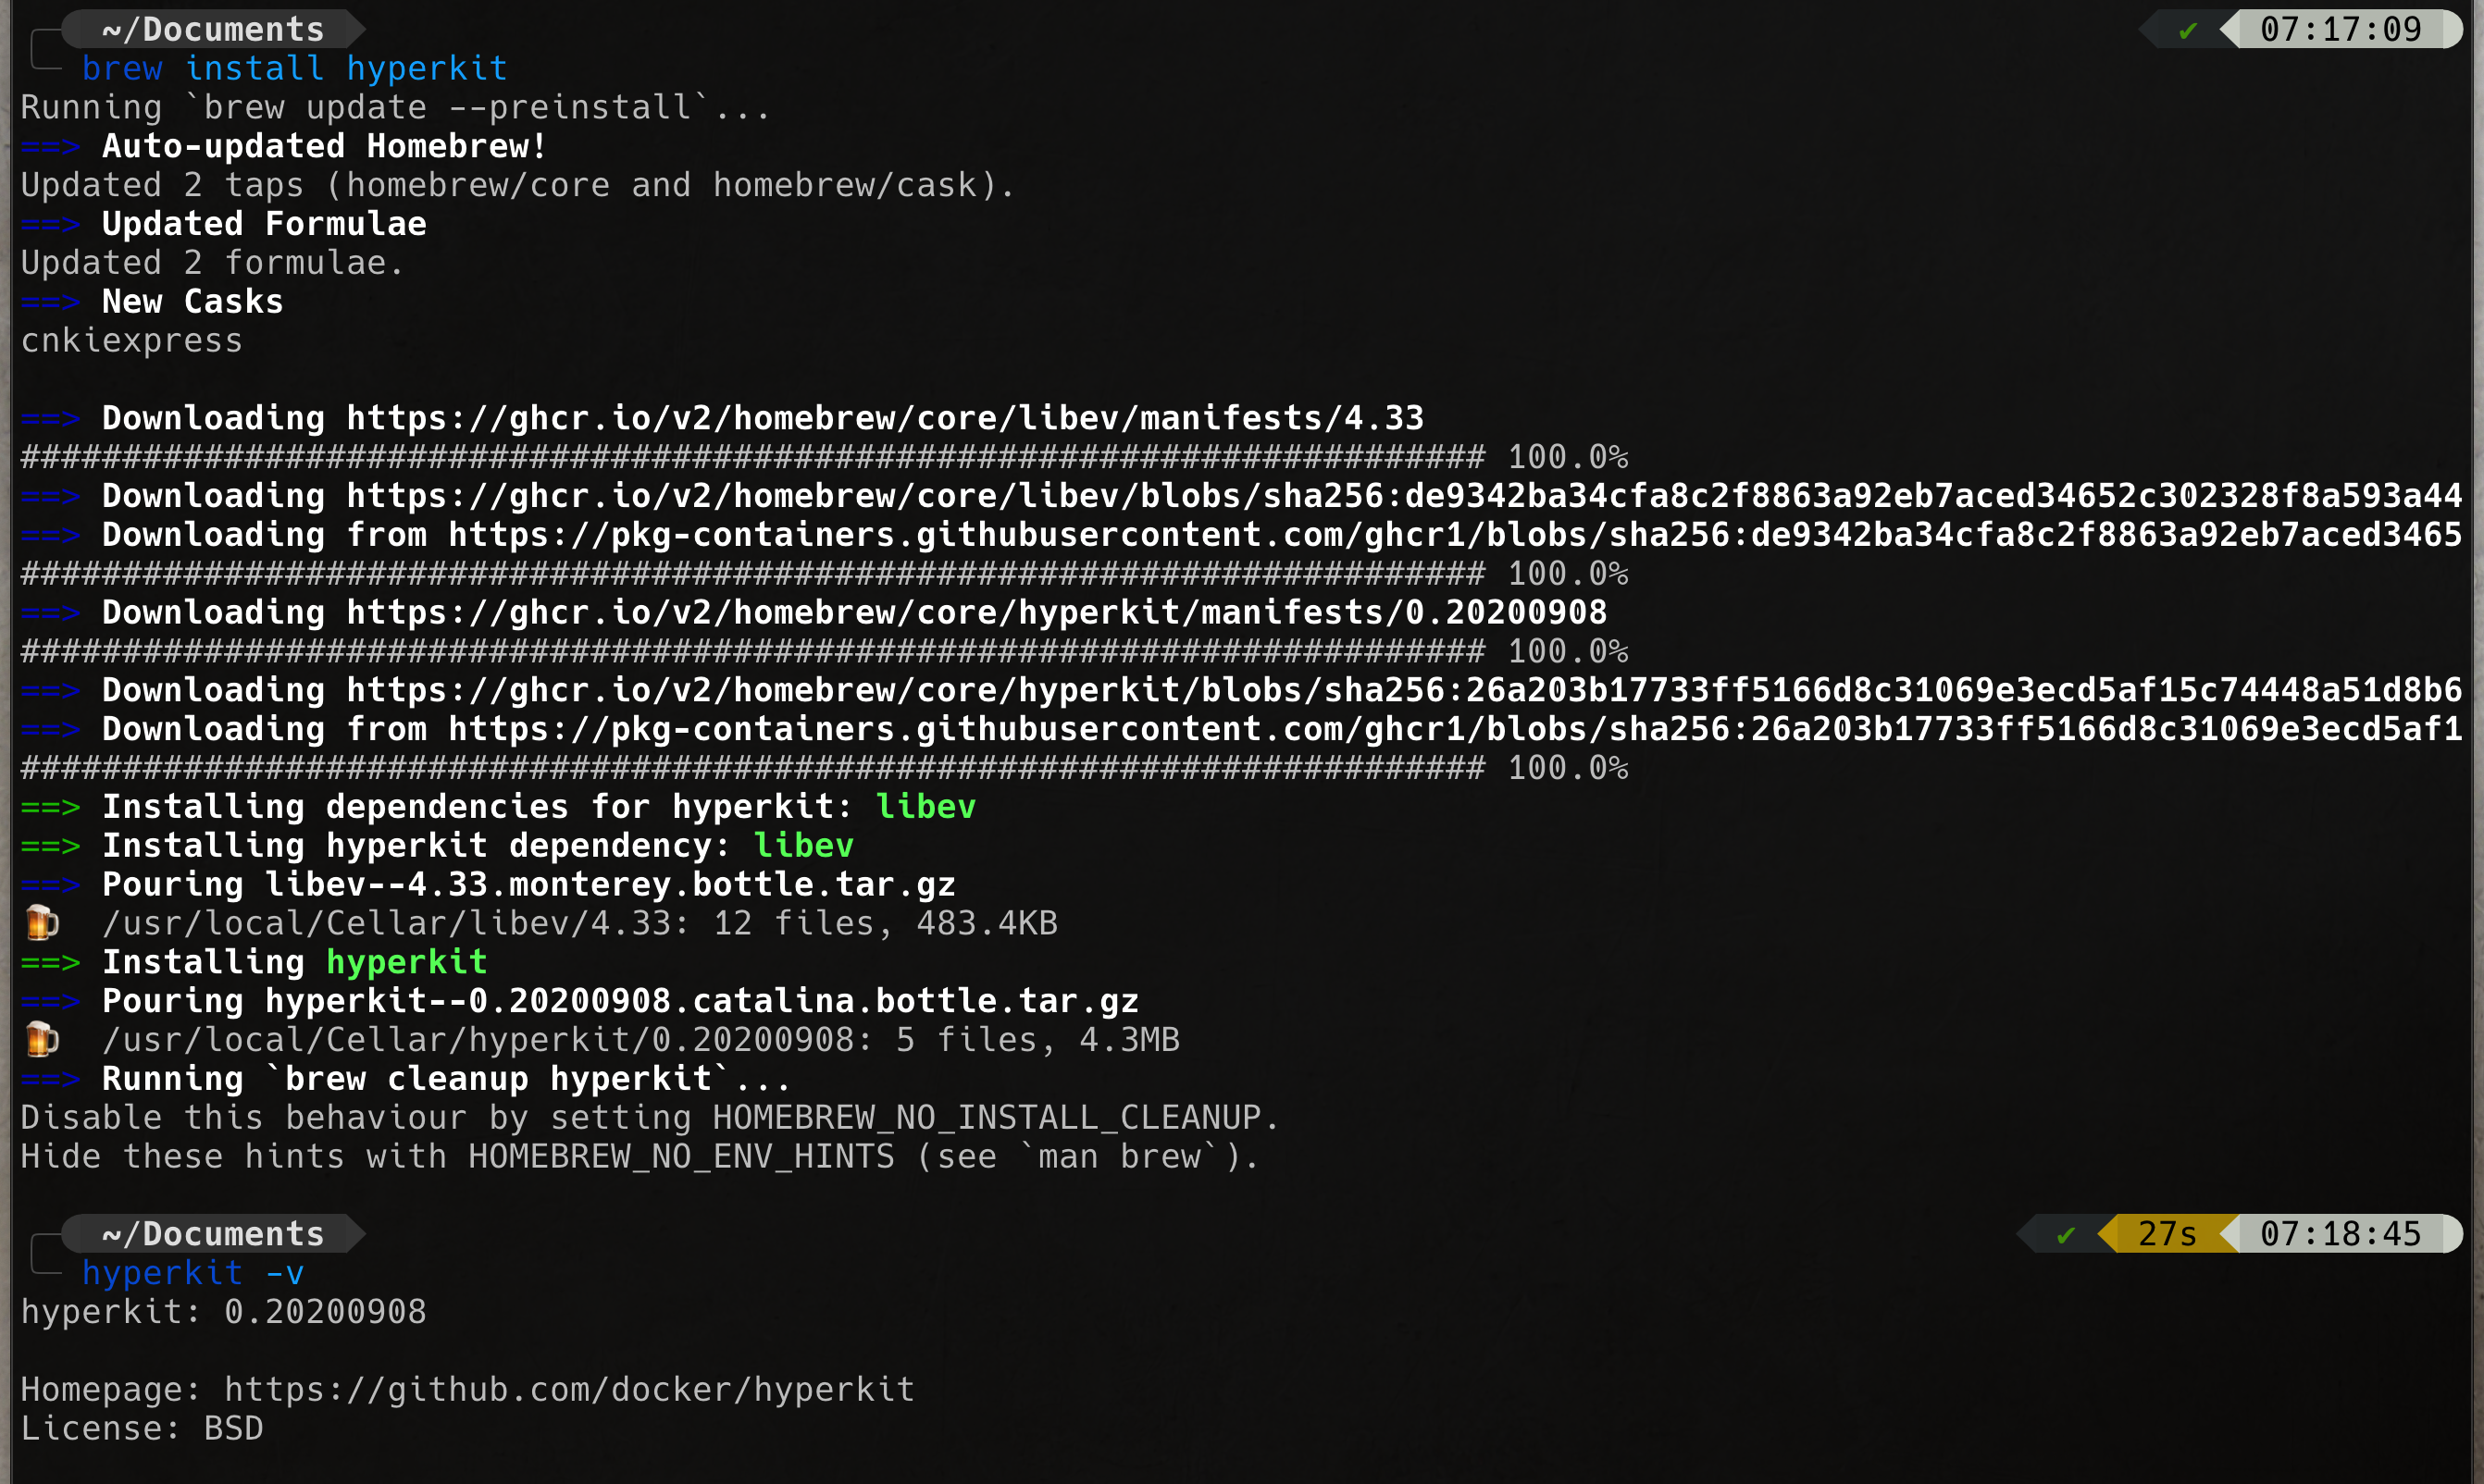
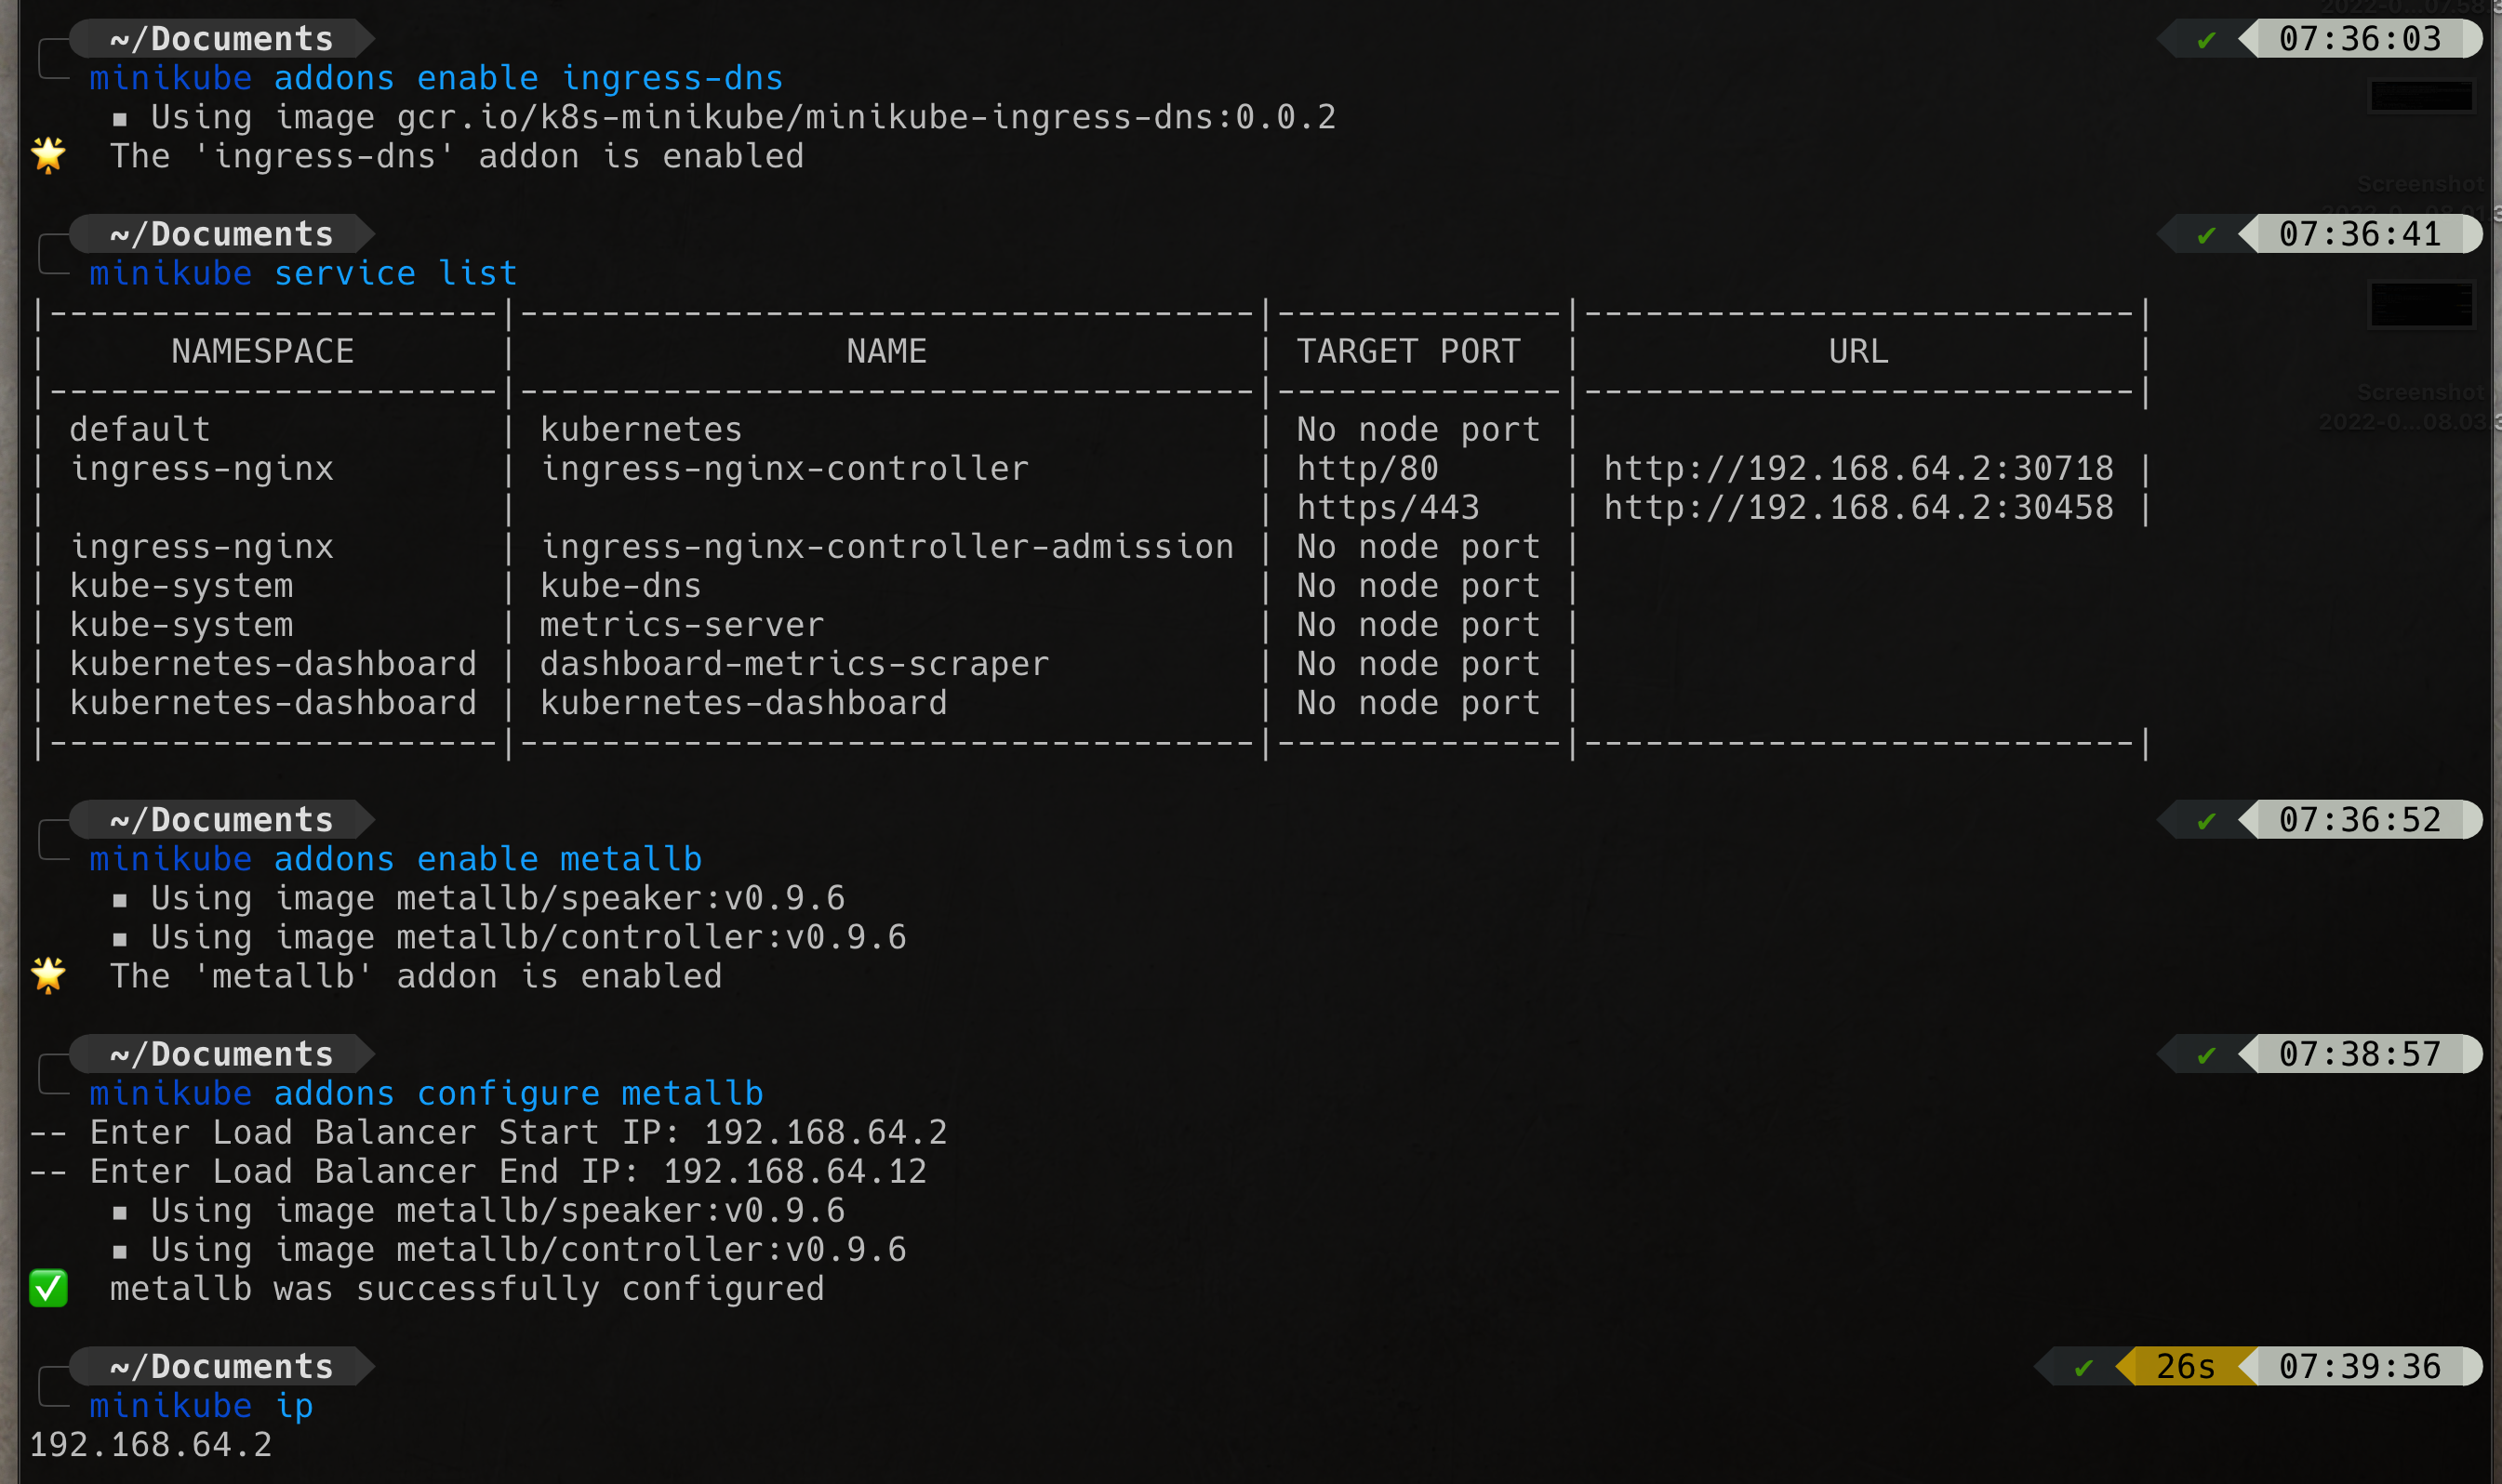
brew install hyperkitbrew install dockerNOTE: Do not run brew install --cask docker. This will install Docker Desktop and we will be back to where we started!
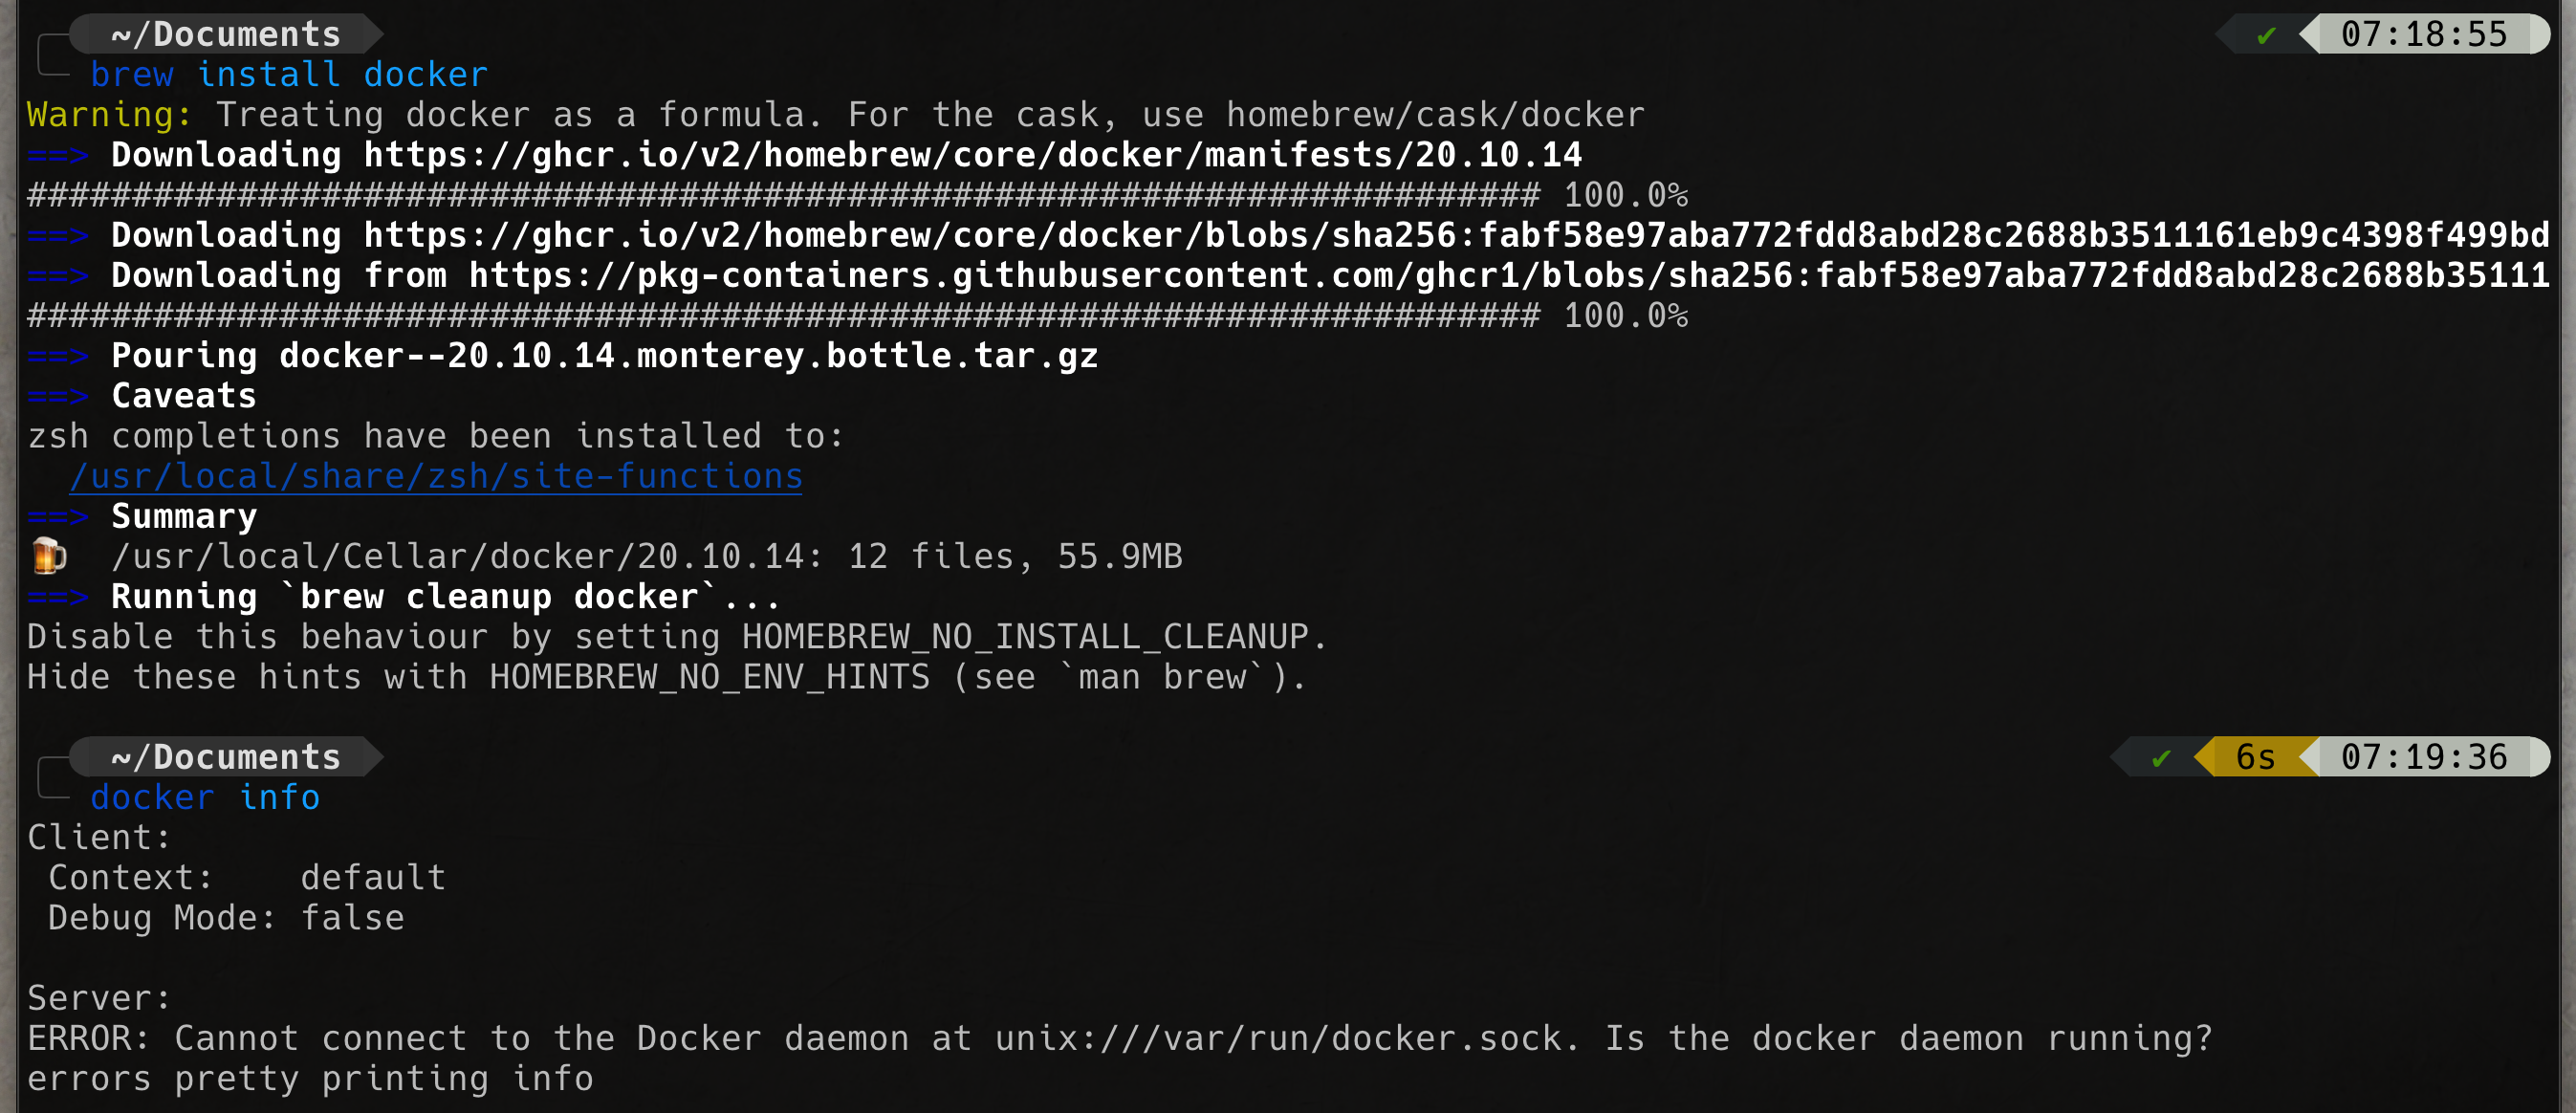
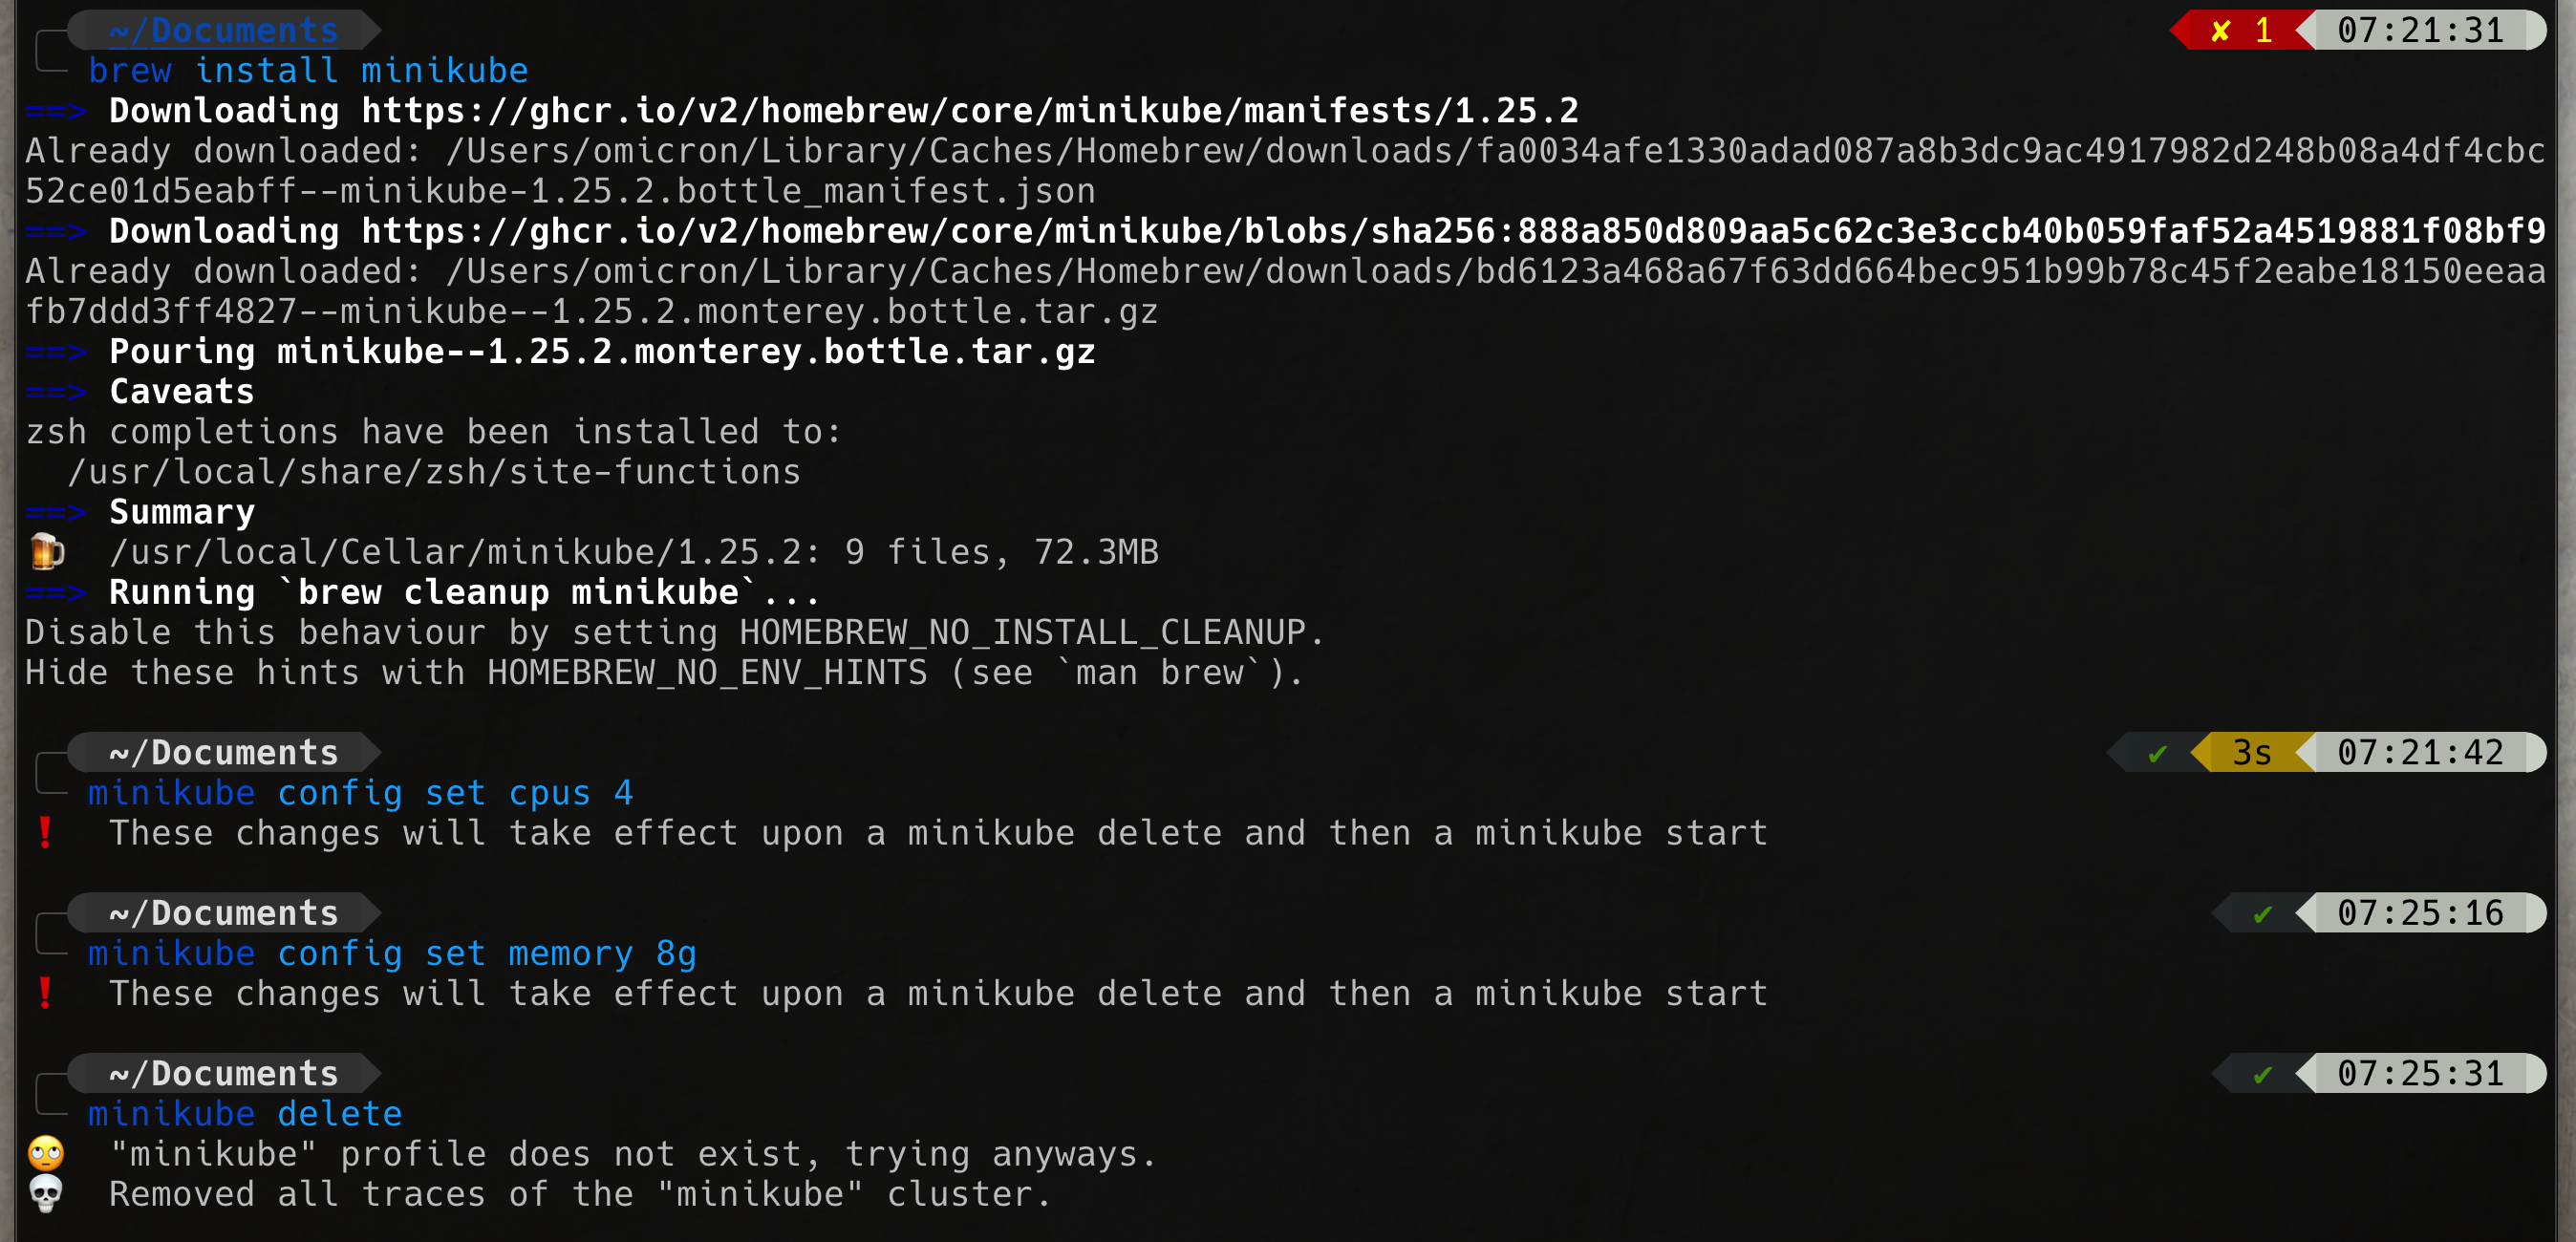
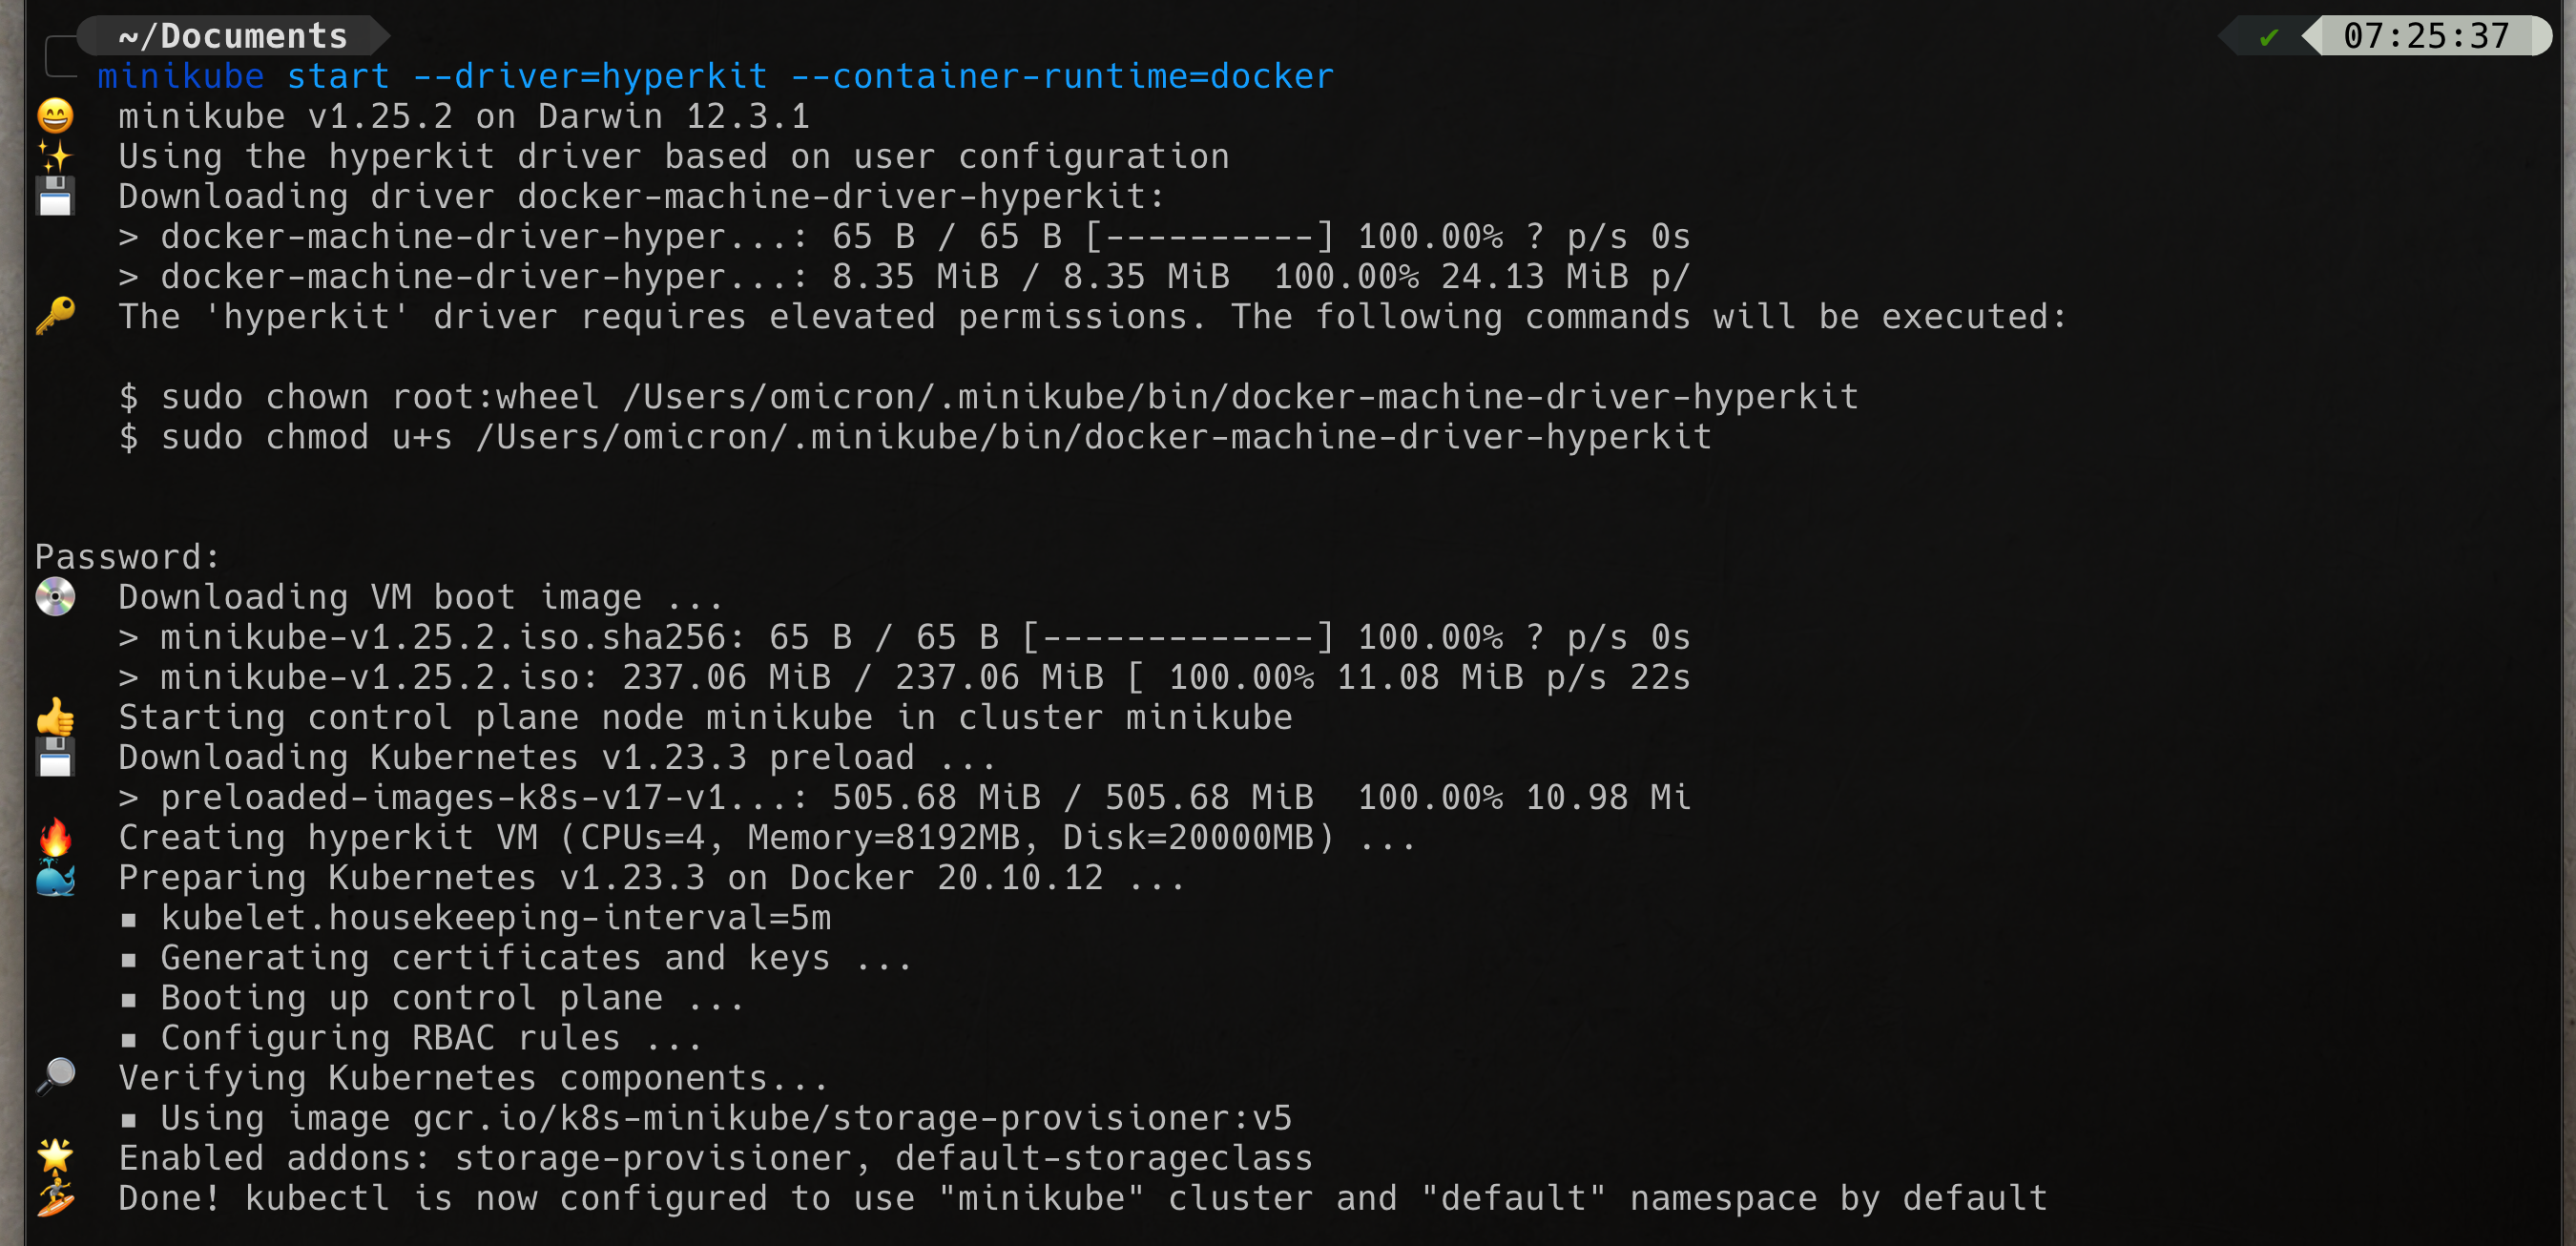
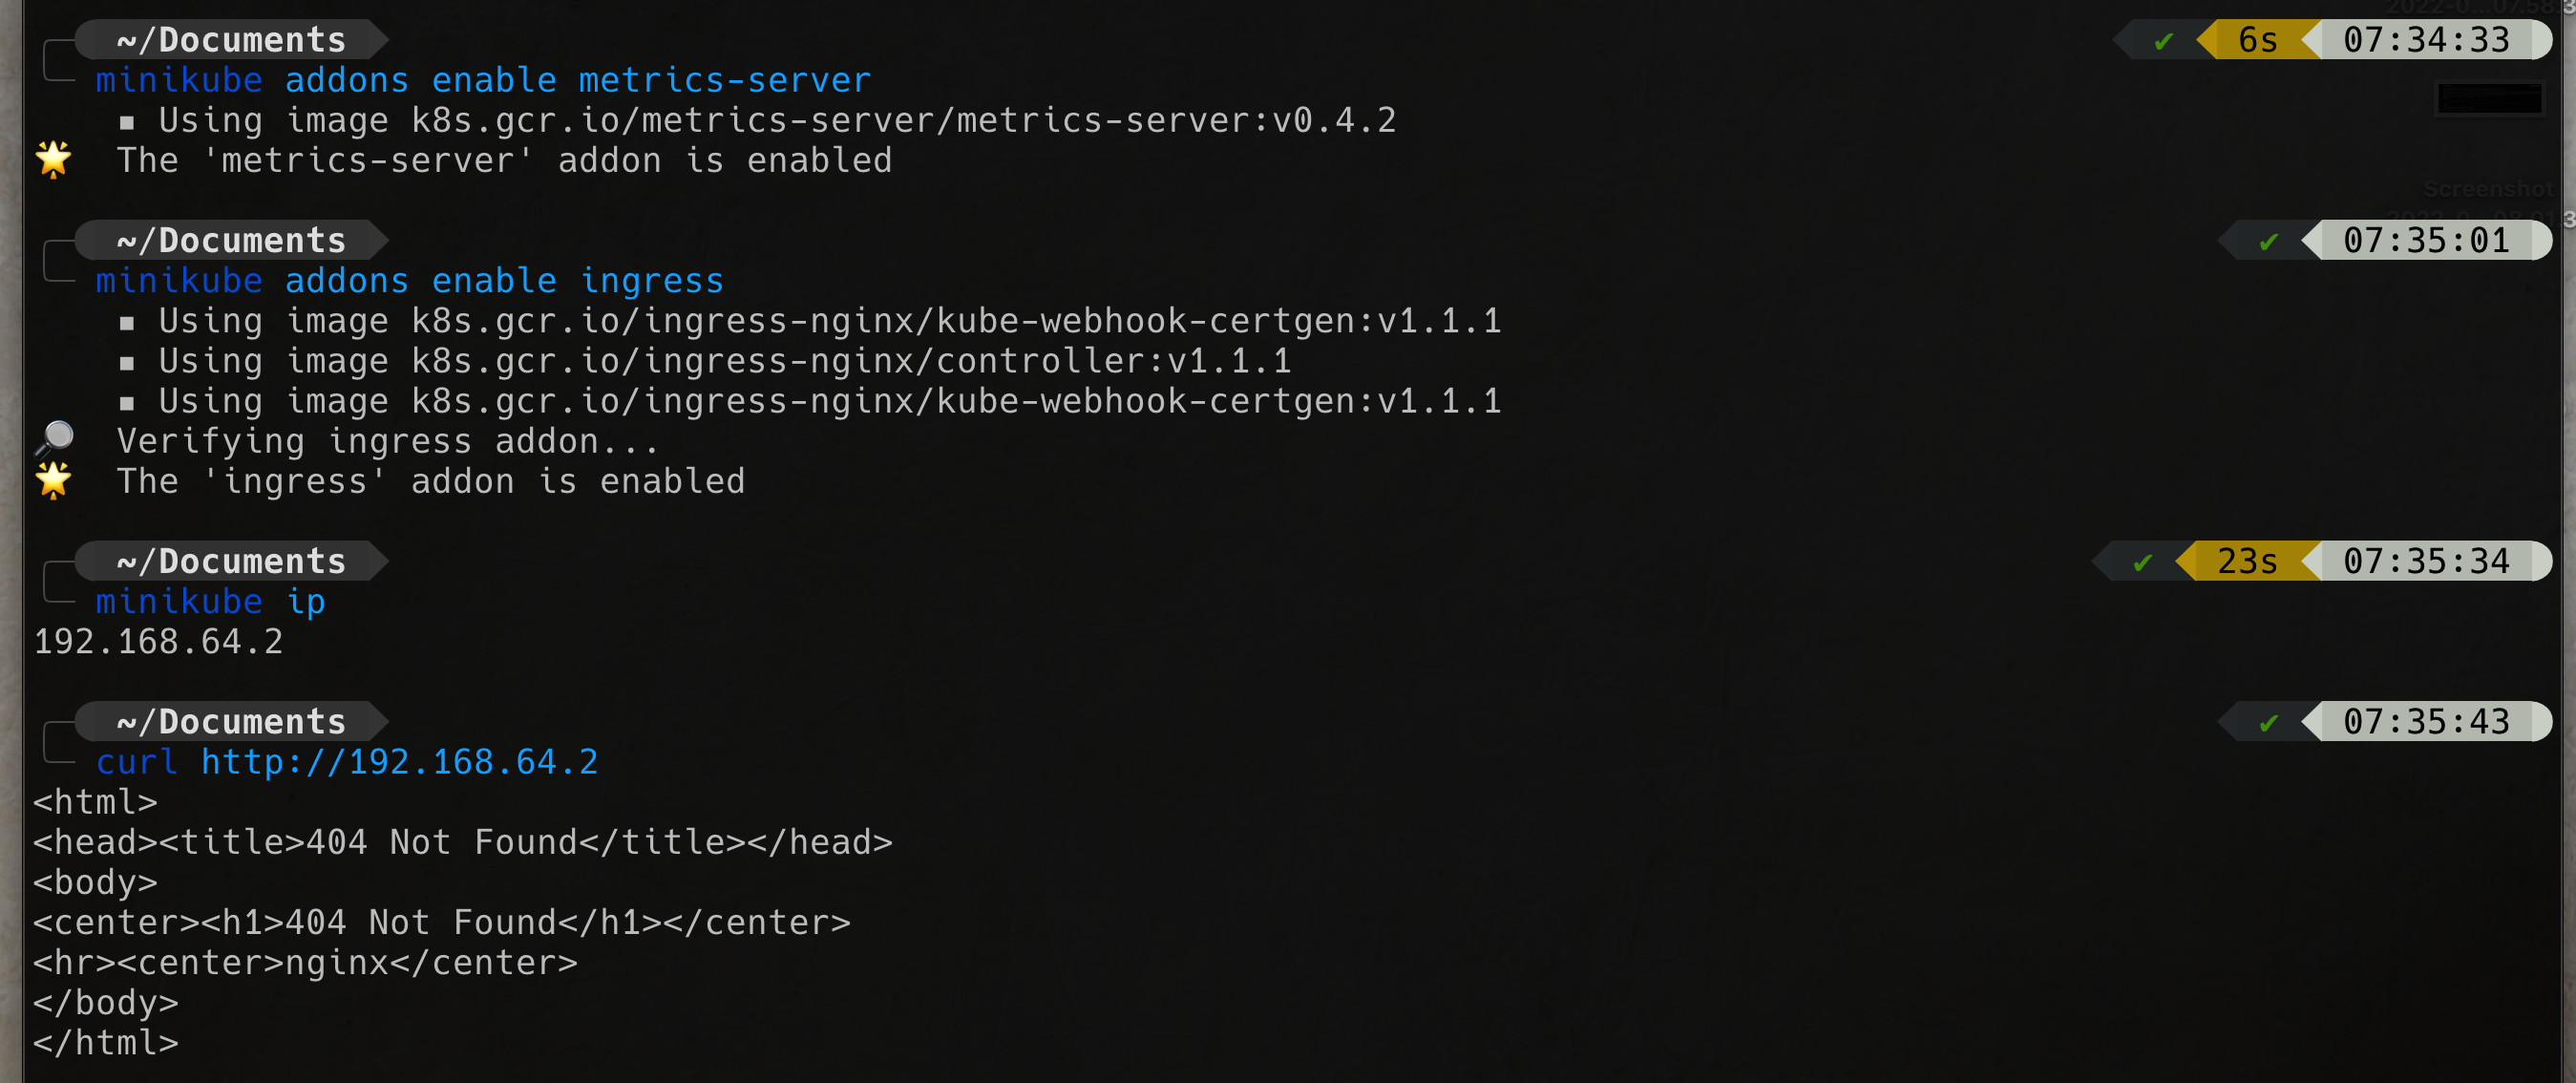
brew install kubectlbrew install minikubeminikube start --driver=hyperkit --container-runtime=dockerminikube -p minikube docker-env | sourcebrew install docker-composeminikube addons enable metrics-server
minikube addons enable ingress
minikube addons enable ingress-dns
minikube addons enable metallb
minikube addons configure metallbbrew install docker-credential-helperRun this maven command to creat project scaffold
mvn io.quarkus:quarkus-maven-plugin:2.8.1.Final:create -DprojectGroupId=prajumsook -DprojectArtifactId=country-service -DclassName="org.wj.prajumsook.countries.CountryResource" -Dpath="/countries"For detail please checkout the video.
Create database instance script
apiVersion: apps/v1
kind: Deployment
metadata:
  name: postgres
spec:
  selector:
    matchLabels:
      app: postgres
  template:
    metadata:
      labels:
        app: postgres
    spec:
      containers:
        - name: postgres
          image: postgres:12
          imagePullPolicy: Always
          ports:
            - containerPort: 5432
              protocol: TCP
          env:
            - name: POSTGRES_DB
              value: quarkus_db
            - name: POSTGRES_USER
              valueFrom:
                secretKeyRef:
                  name: db-credentials
                  key: username
            - name: POSTGRES_PASSWORD
              valueFrom:
                secretKeyRef:
                  name: db-credentials
                  key: password
---
apiVersion: v1
kind: Service
metadata:
  labels:
    app: postgres
  name: postgres
spec:
  ports:
    - name: http
      port: 5432
      protocol: TCP
  selector:
    app: postgres
  type: NodePort
Create database secret
kubectl create secret generic db-credentials --from-literal=username=quarkus_user --from-literal=password=quarkus_passStart PostgreSQL instance
kubectl apply -f postgresql_db.yaml Now you should see that PostgreSQL running on port
 32728 (In this tutorial but you should have a differns on your env.)
http://192.168.64.2:32728Add hibernate-orm and PostgreSQL extension to the project
mvn quarkus:add-extension -Dextensions="hibernate-orm,jdbc-postgresql"Please check out video for complete changes in the service.
Add OpenAPI extension
mvn quarkus:add-extension -Dextensions="quarkus-smallrye-openapi"Please watch video for complete changes.
Add extension
mvn quarkus:add-extension -Dextensions="quarkus-smallrye-metrics"Please watch video for complete implementation.
Code using in this secstion is from:
https://github.com/prometheus-operator/kube-prometheusPlease clone the latest from the repo
git clone https://github.com/prometheus-operator/kube-prometheus.gitCreates the Kubernetes CRDs
kubectl create -f manifests/setupAnd then
kubectl create -f manifestsCreate servicemonitor.yaml file
apiVersion: monitoring.coreos.com/v1
kind: ServiceMonitor
metadata:
  name: country-service
  namespace: default
  labels:
    app.kubernetes.io/name: country-service
spec:
  namespaceSelector:
    matchNames:
      - default
  selector:
    matchLabels:
      app.kubernetes.io/name: country-service
  endpoints:
  - port: http
    interval: 3s
    path: /q/metrics
And to get service monitor service run command
kubectl get servicemonitors --all-namespacesAccess grafana dashboard
kubectl port-forward -n monitoring service/grafana 3000:3000And on browser navigate to http://lcalhost:3000
Login with user admin and pass admin
Please watch video for complete implementation
Create yaml file as follow
apiVersion: apps/v1
kind: Deployment
metadata:
  name: elasticsearch
spec:
  selector:
    matchLabels:
      component: elasticsearch
  template:
    metadata:
      labels:
        component: elasticsearch
    spec:
      containers:
      - name: elasticsearch
        image: docker.elastic.co/elasticsearch/elasticsearch:7.17.3
        env:
        - name: discovery.type
          value: single-node
        ports:
        - containerPort: 9200
          name: http
          protocol: TCP
        resources:
          limits:
            cpu: 500m
            memory: 4Gi
          requests:
            cpu: 500m
            memory: 4Gi

---

apiVersion: v1
kind: Service
metadata:
  name: elasticsearch
  labels:
    service: elasticsearch
spec:
  type: NodePort
  selector:
    component: elasticsearch
  ports:
  - port: 9200
    targetPort: 9200
Create deployment and service
kubectl create -f elasticsearch.yamlCreate yaml file as follow
apiVersion: apps/v1
kind: Deployment
metadata:
  name: kibana
spec:
  selector:
    matchLabels:
      run: kibana
  template:
    metadata:
      labels:
        run: kibana
    spec:
      containers:
      - name: kibana
        image: docker.elastic.co/kibana/kibana:7.17.3
        env:
        - name: ELASTICSEARCH_URL
          value: http://<MINIKUBE IP>:<EXPOSED ELASTIC PORT>
        - name: XPACK_SECURITY_ENABLED
          value: "true"
        ports:
        - containerPort: 5601
          name: http
          protocol: TCP

---

apiVersion: v1
kind: Service
metadata:
  name: kibana
  labels:
    service: kibana
spec:
  type: NodePort
  selector:
    run: kibana
  ports:
  - port: 5601
    targetPort: 5601
You can find MINIKUBE IP with this command
minikube ipAnd
kubectl get servicesYou should be able to find elasticsearch port
Create deployment and service
kubectl create -f kibana.yamlCreate Fluentd RBAC so that Fluentd can access to logs components yaml file as follow
apiVersion: v1
kind: ServiceAccount
metadata:
  name: fluentd
  namespace: kube-system

---

apiVersion: rbac.authorization.k8s.io/v1
kind: ClusterRole
metadata:
  name: fluentd
  namespace: kube-system
rules:
- apiGroups:
  - ""
  resources:
  - pods
  - namespaces
  verbs:
  - get
  - list
  - watch

---

apiVersion: rbac.authorization.k8s.io/v1
kind: ClusterRoleBinding
metadata:
  name: fluentd
roleRef:
  kind: ClusterRole
  name: fluentd
  apiGroup: rbac.authorization.k8s.io
subjects:
- kind: ServiceAccount
  name: fluentd
  namespace: kube-system
And run the create
kubectl create -f fluentd-rbac.yamlCreate yaml file as follow
apiVersion: apps/v1
kind: DaemonSet
metadata:
  name: fluentd
  namespace: kube-system
  labels:
    k8s-app: fluentd-logging
spec:
  selector:
    matchLabels:
      name: fluentd
  template:
    metadata:
      labels:
        name: fluentd
    spec:
      serviceAccount: fluentd
      serviceAccountName: fluentd
      tolerations:
      - key: node-role.kubernetes.io/master
        effect: NoSchedule
      containers:
      - name: fluentd
        image: fluent/fluentd-kubernetes-daemonset:v1.3-debian-elasticsearch
        env:
          - name:  FLUENT_ELASTICSEARCH_HOST
            value: "<MINIKUBE IP>"
          - name:  FLUENT_ELASTICSEARCH_PORT
            value: "<ELASTICSEARCH EXPOSE PORT>"
          - name: FLUENT_ELASTICSEARCH_SCHEME
            value: "http"
          - name: FLUENT_UID
            value: "0"
        resources:
          limits:
            memory: 200Mi
          requests:
            cpu: 100m
            memory: 200Mi
        volumeMounts:
        - name: varlog
          mountPath: /var/log
        - name: varlibdockercontainers
          mountPath: /var/lib/docker/containers
          readOnly: true
      terminationGracePeriodSeconds: 30
      volumes:
      - name: varlog
        hostPath:
          path: /var/log
      - name: varlibdockercontainers
        hostPath:
          path: /var/lib/docker/containers
You need to change MINIKUBE IP and ELASTICSEARCH EXPOSE PORT
Then create the daemonset
kubectl create -f fluent-daemonset.yamlPlease watch the video for complete implementation
Create a keycloak.yaml file as follow
apiVersion: v1
kind: Service
metadata:
  name: keycloak
  labels:
    app: keycloak
spec:
  ports:
  - name: http
    port: 8080
    targetPort: 8080
  selector:
    app: keycloak
  type: LoadBalancer
---
apiVersion: apps/v1
kind: Deployment
metadata:
  name: keycloak
  labels:
    app: keycloak
spec:
  replicas: 1
  selector:
    matchLabels:
      app: keycloak
  template:
    metadata:
      labels:
        app: keycloak
    spec:
      containers:
      - name: keycloak
        image: quay.io/keycloak/keycloak:18.0.0
        args: ["start-dev"]
        env:
        - name: KEYCLOAK_ADMIN
          value: "admin"
        - name: KEYCLOAK_ADMIN_PASSWORD
          value: "admin"
        - name: KC_PROXY
          value: "edge"
        ports:
        - name: http
          containerPort: 8080
        readinessProbe:
          httpGet:
            path: /realms/master
            port: 8080
Then run this command
kubectl create -f keycloak.yamlThis will start keycloak on Kubernetes and it will also create and initial admin user with username admin and password admin
keycloak-ingress.yaml
apiVersion: networking.k8s.io/v1
kind: Ingress
metadata:
  name: keycloak
spec:
  tls:
    - hosts:
      - KEYCLOAK_HOST
  rules:
  - host: KEYCLOAK_HOST
    http:
      paths:
      - path: /
        pathType: Prefix
        backend:
          service:
            name: keycloak
            port:
              number: 8080
Replace KEYCLOAK_HOST with keycloak.{minikube ip address}.nip.io
To find out the minikube ip address you can run this command
minikube ipThen run this command to create ingress for Keycloak
kubectl create -f keycloak-ingress.yamlNext check out minikube service list
Run command
minikube service listYou should see keycloak url, open your browser and enter keycloal url
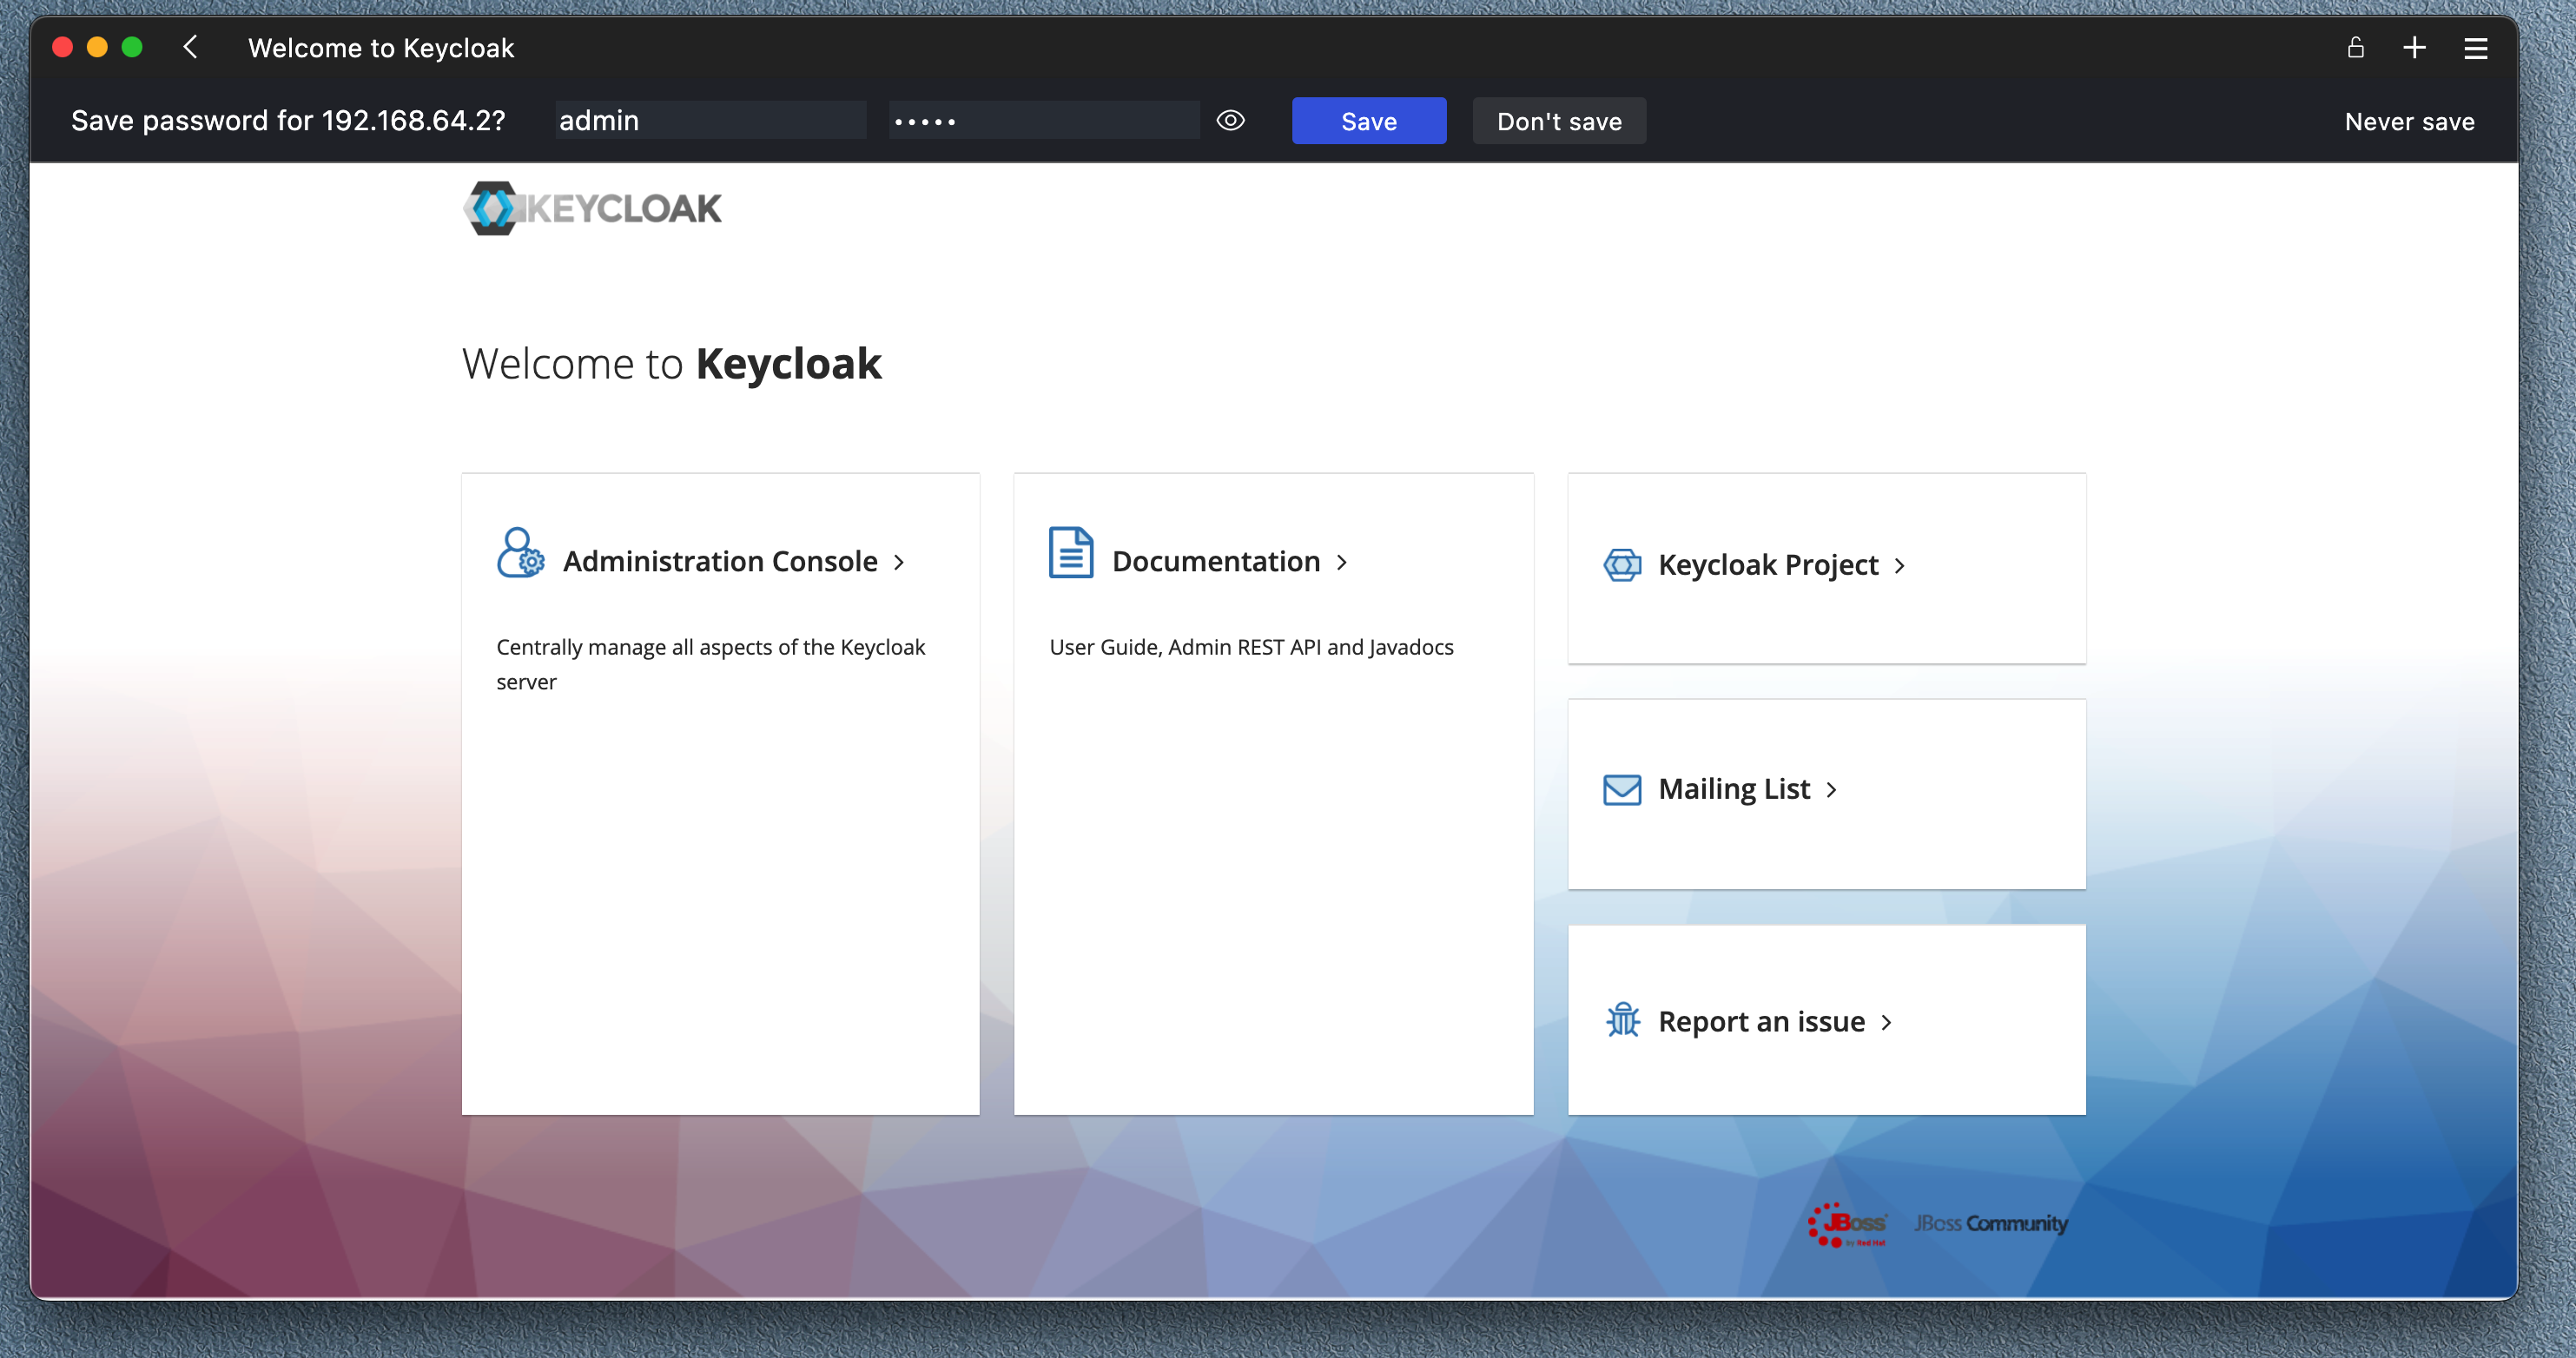
Login with username admin and password admin
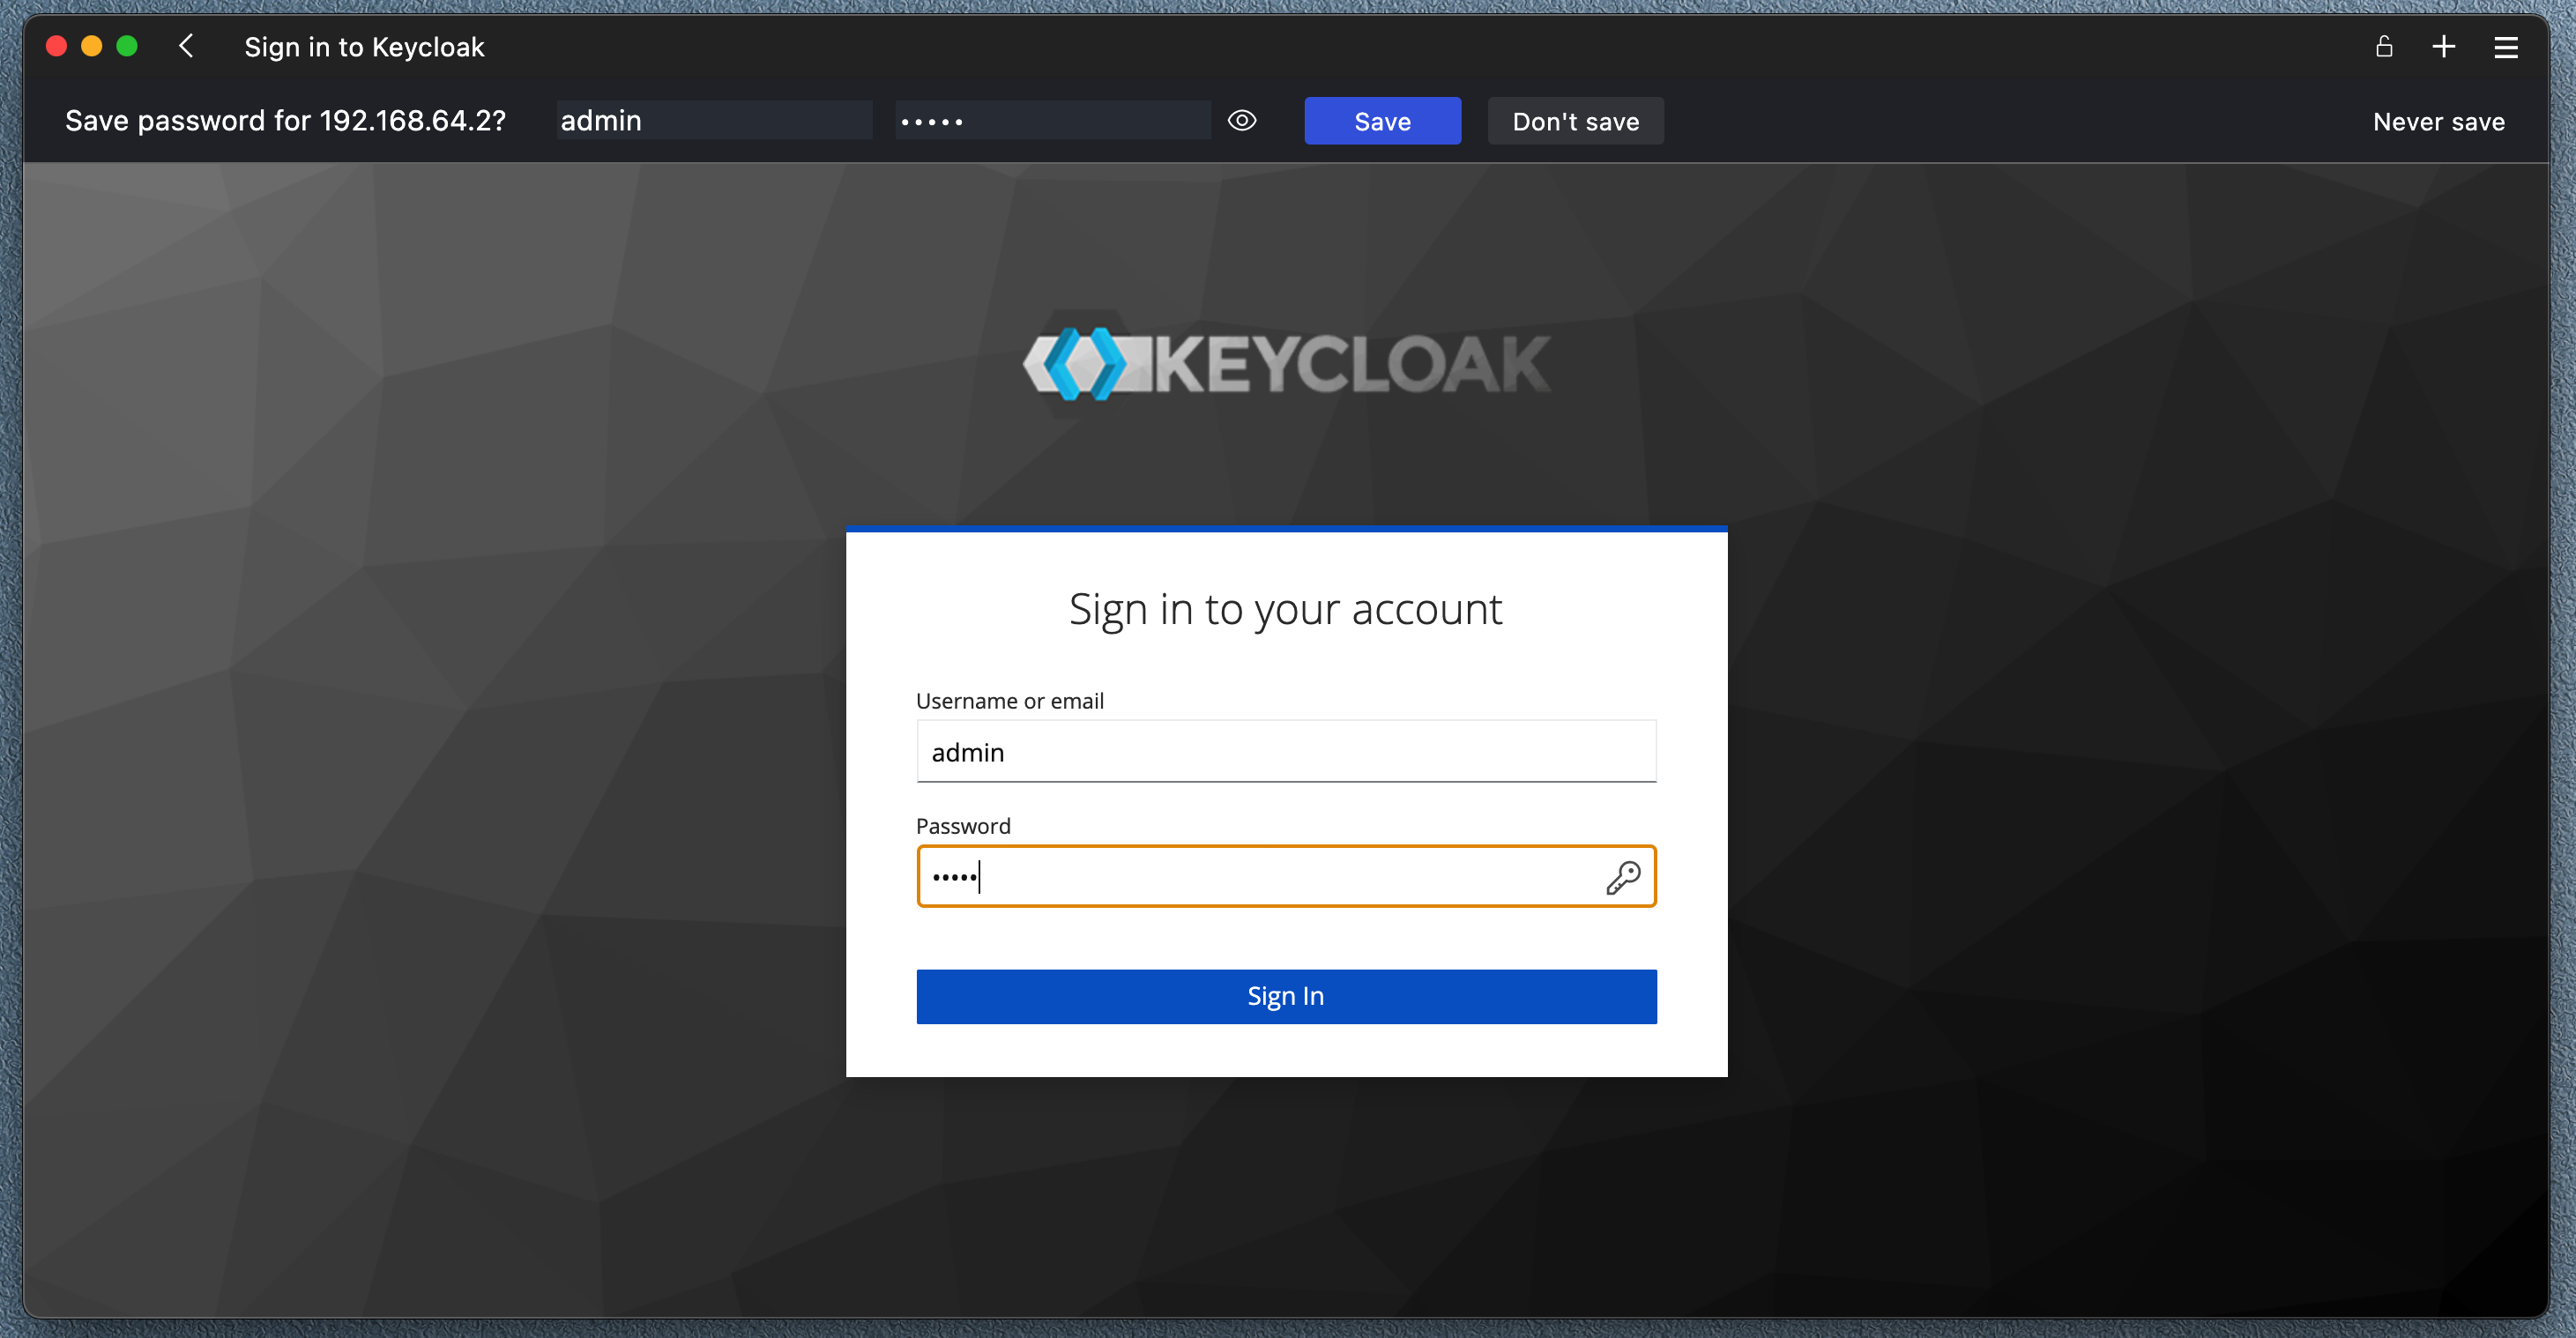
You should see the Keycloak dashboard
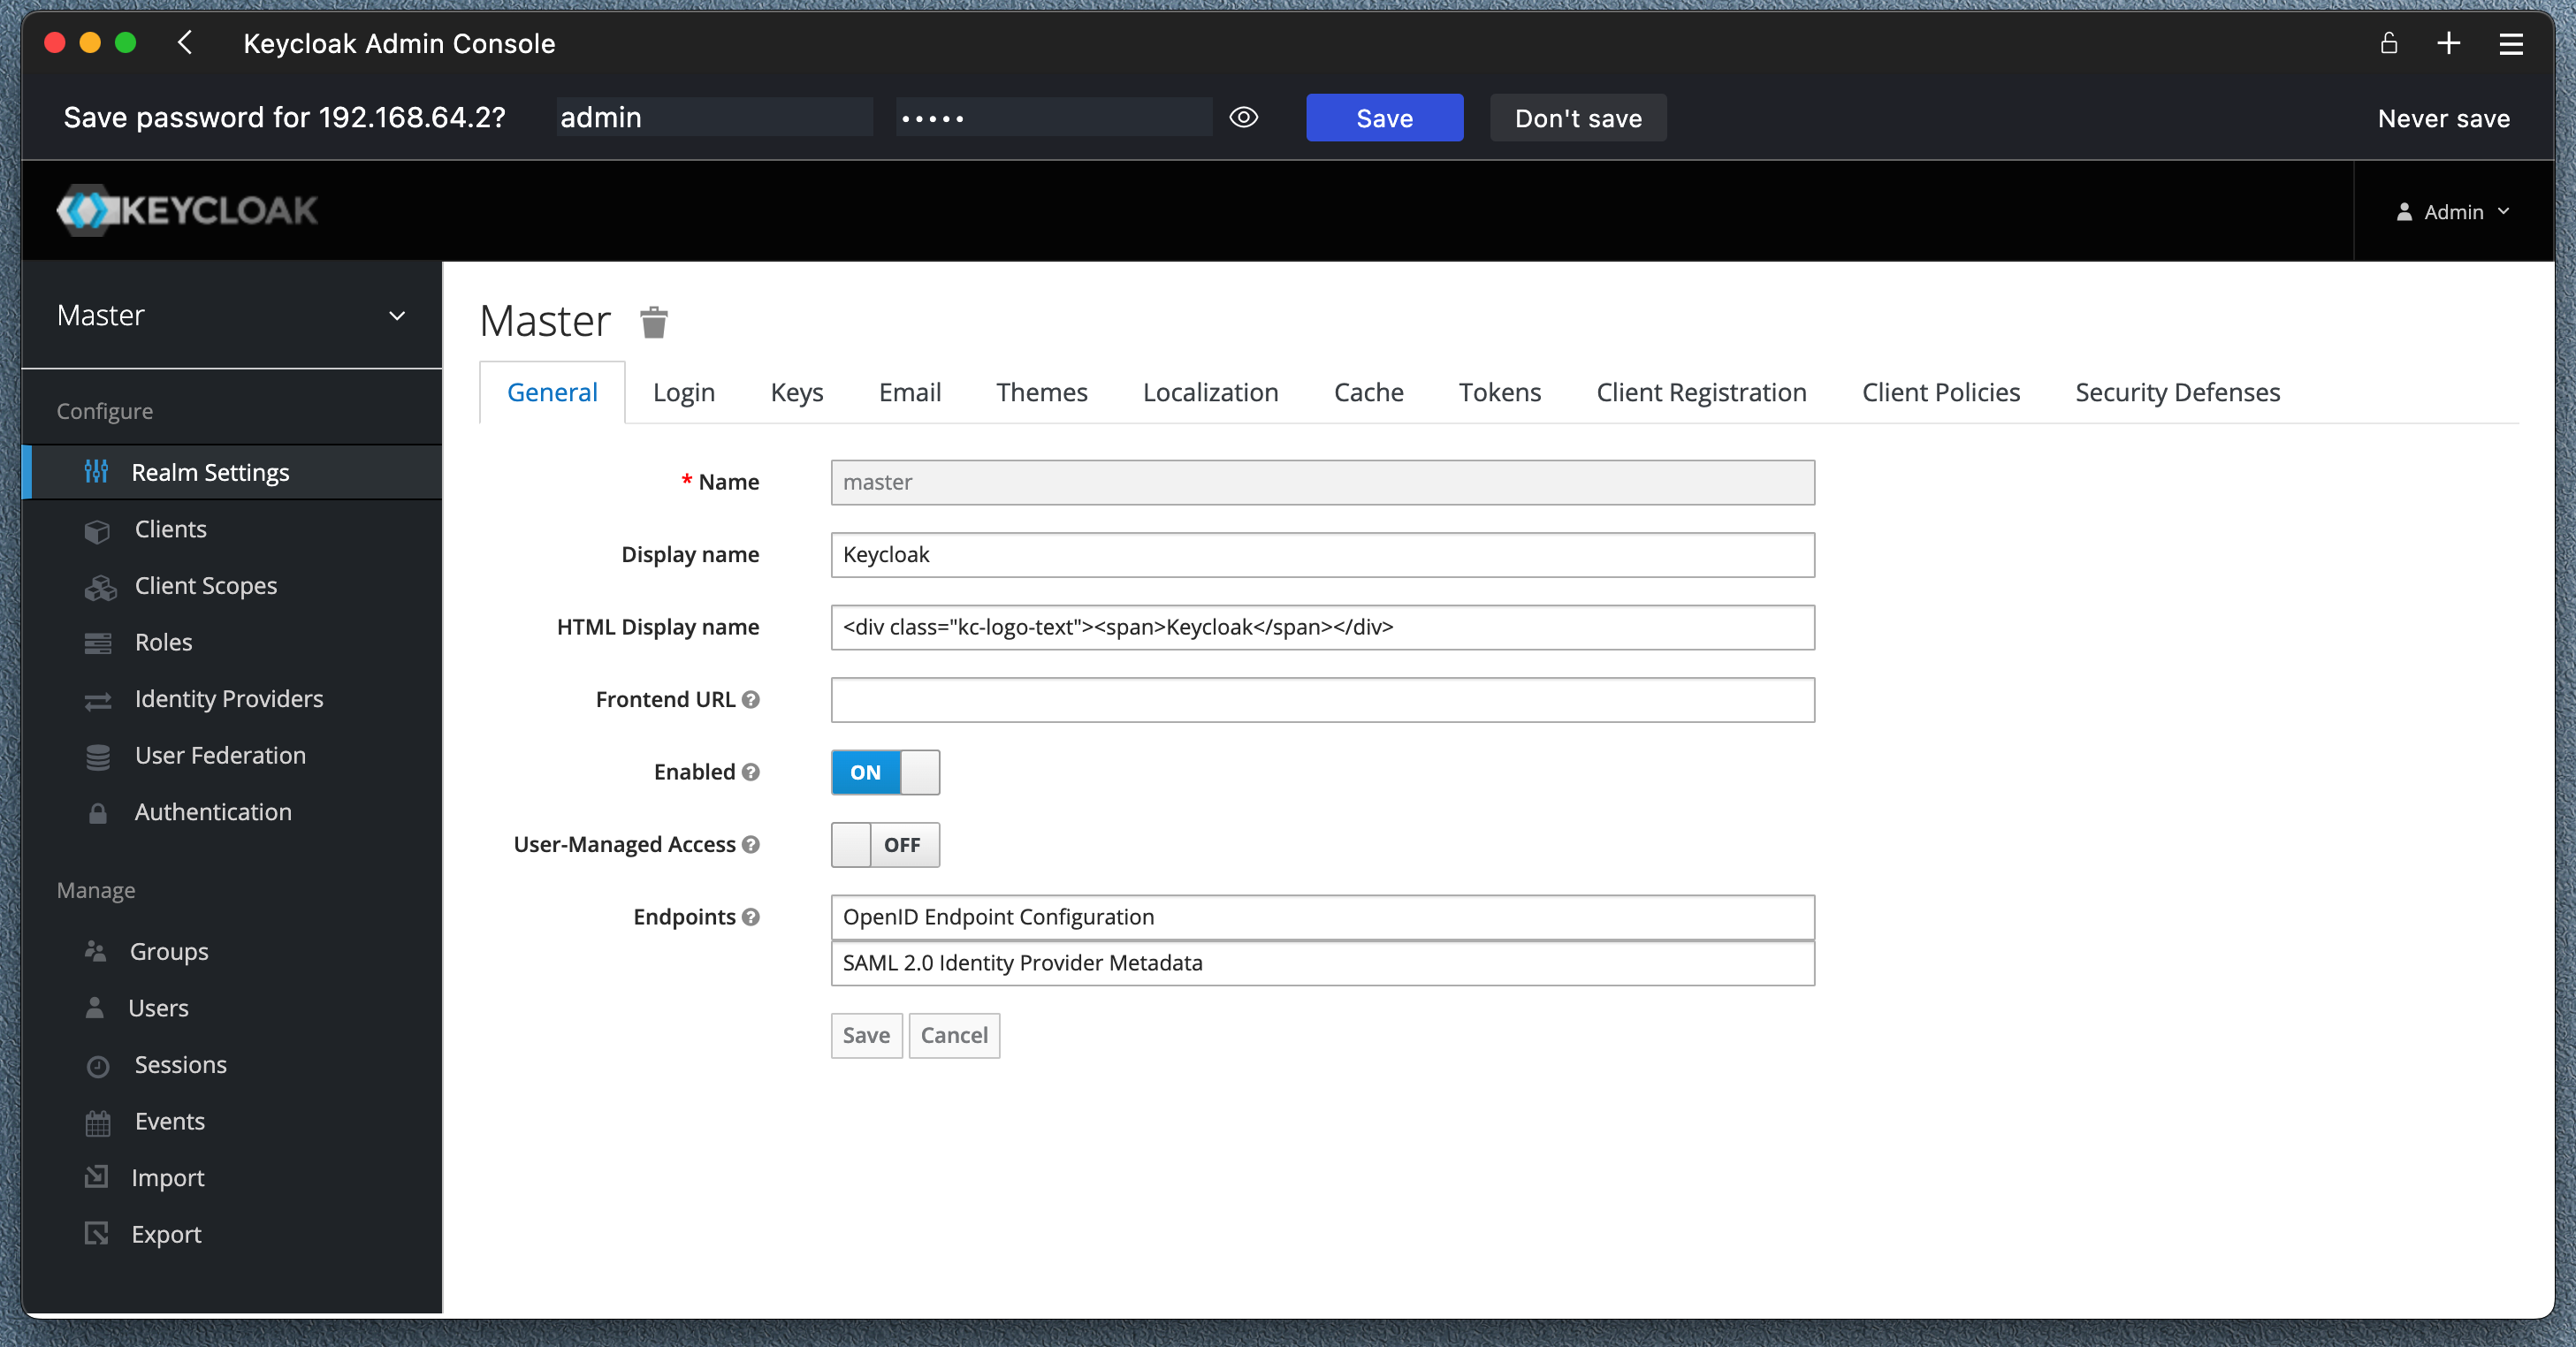
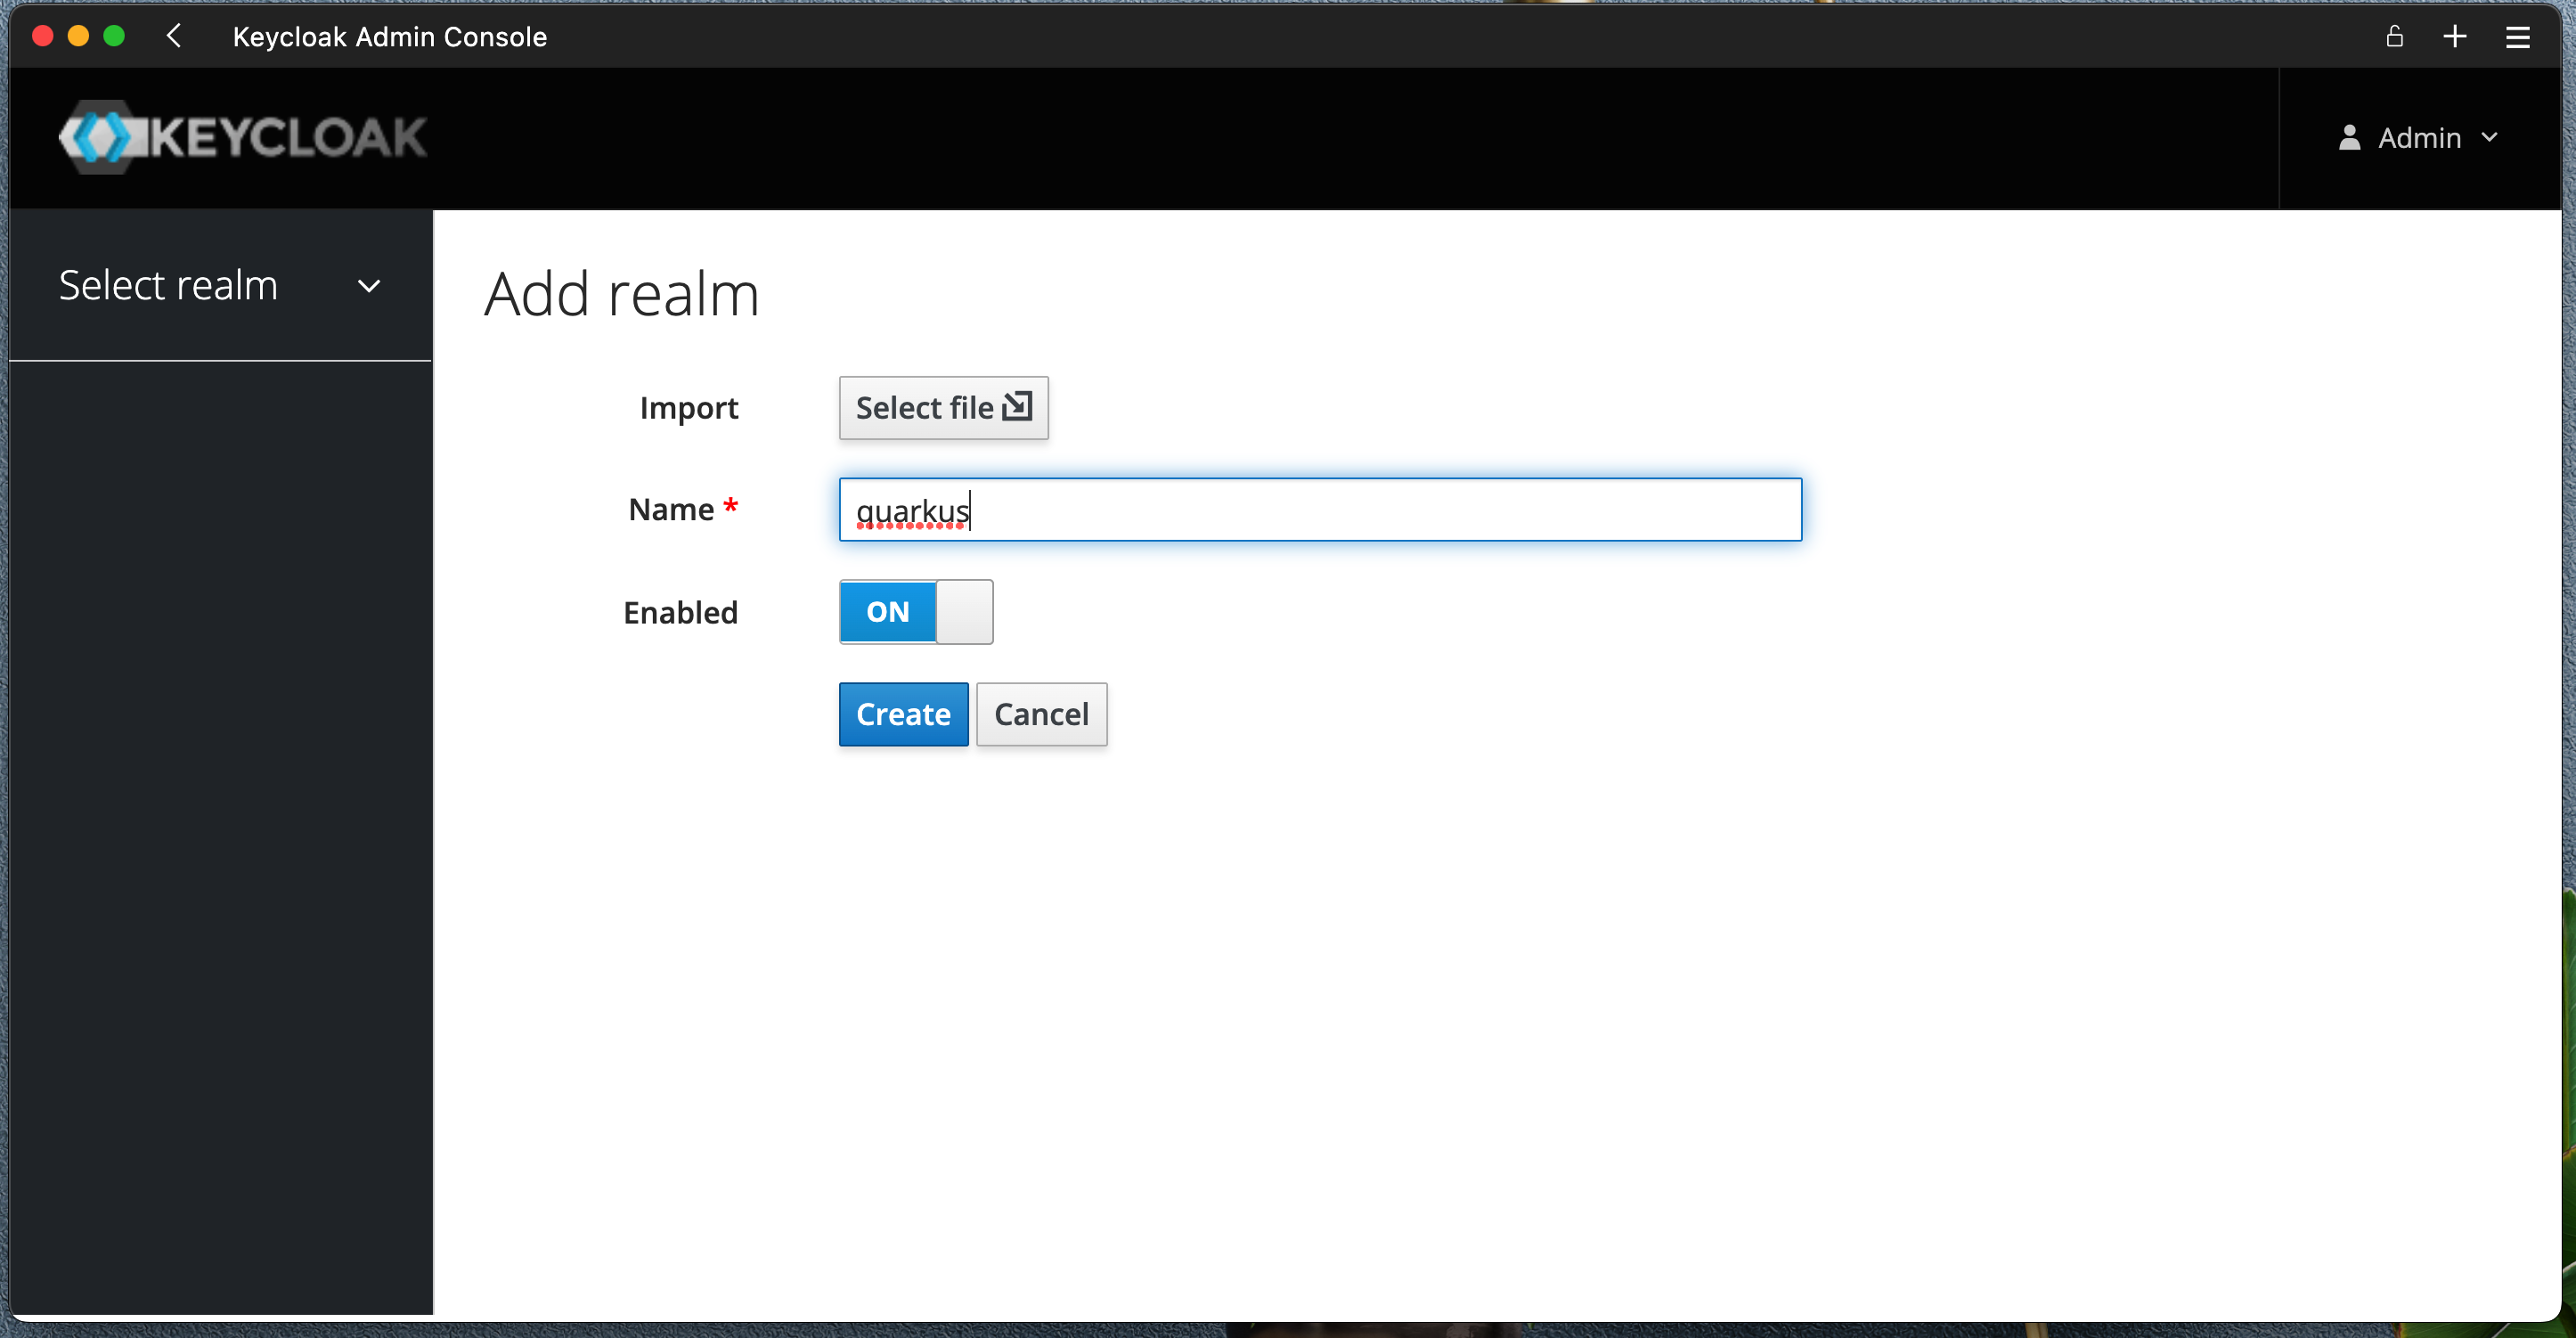
Create new Realm name quarkus
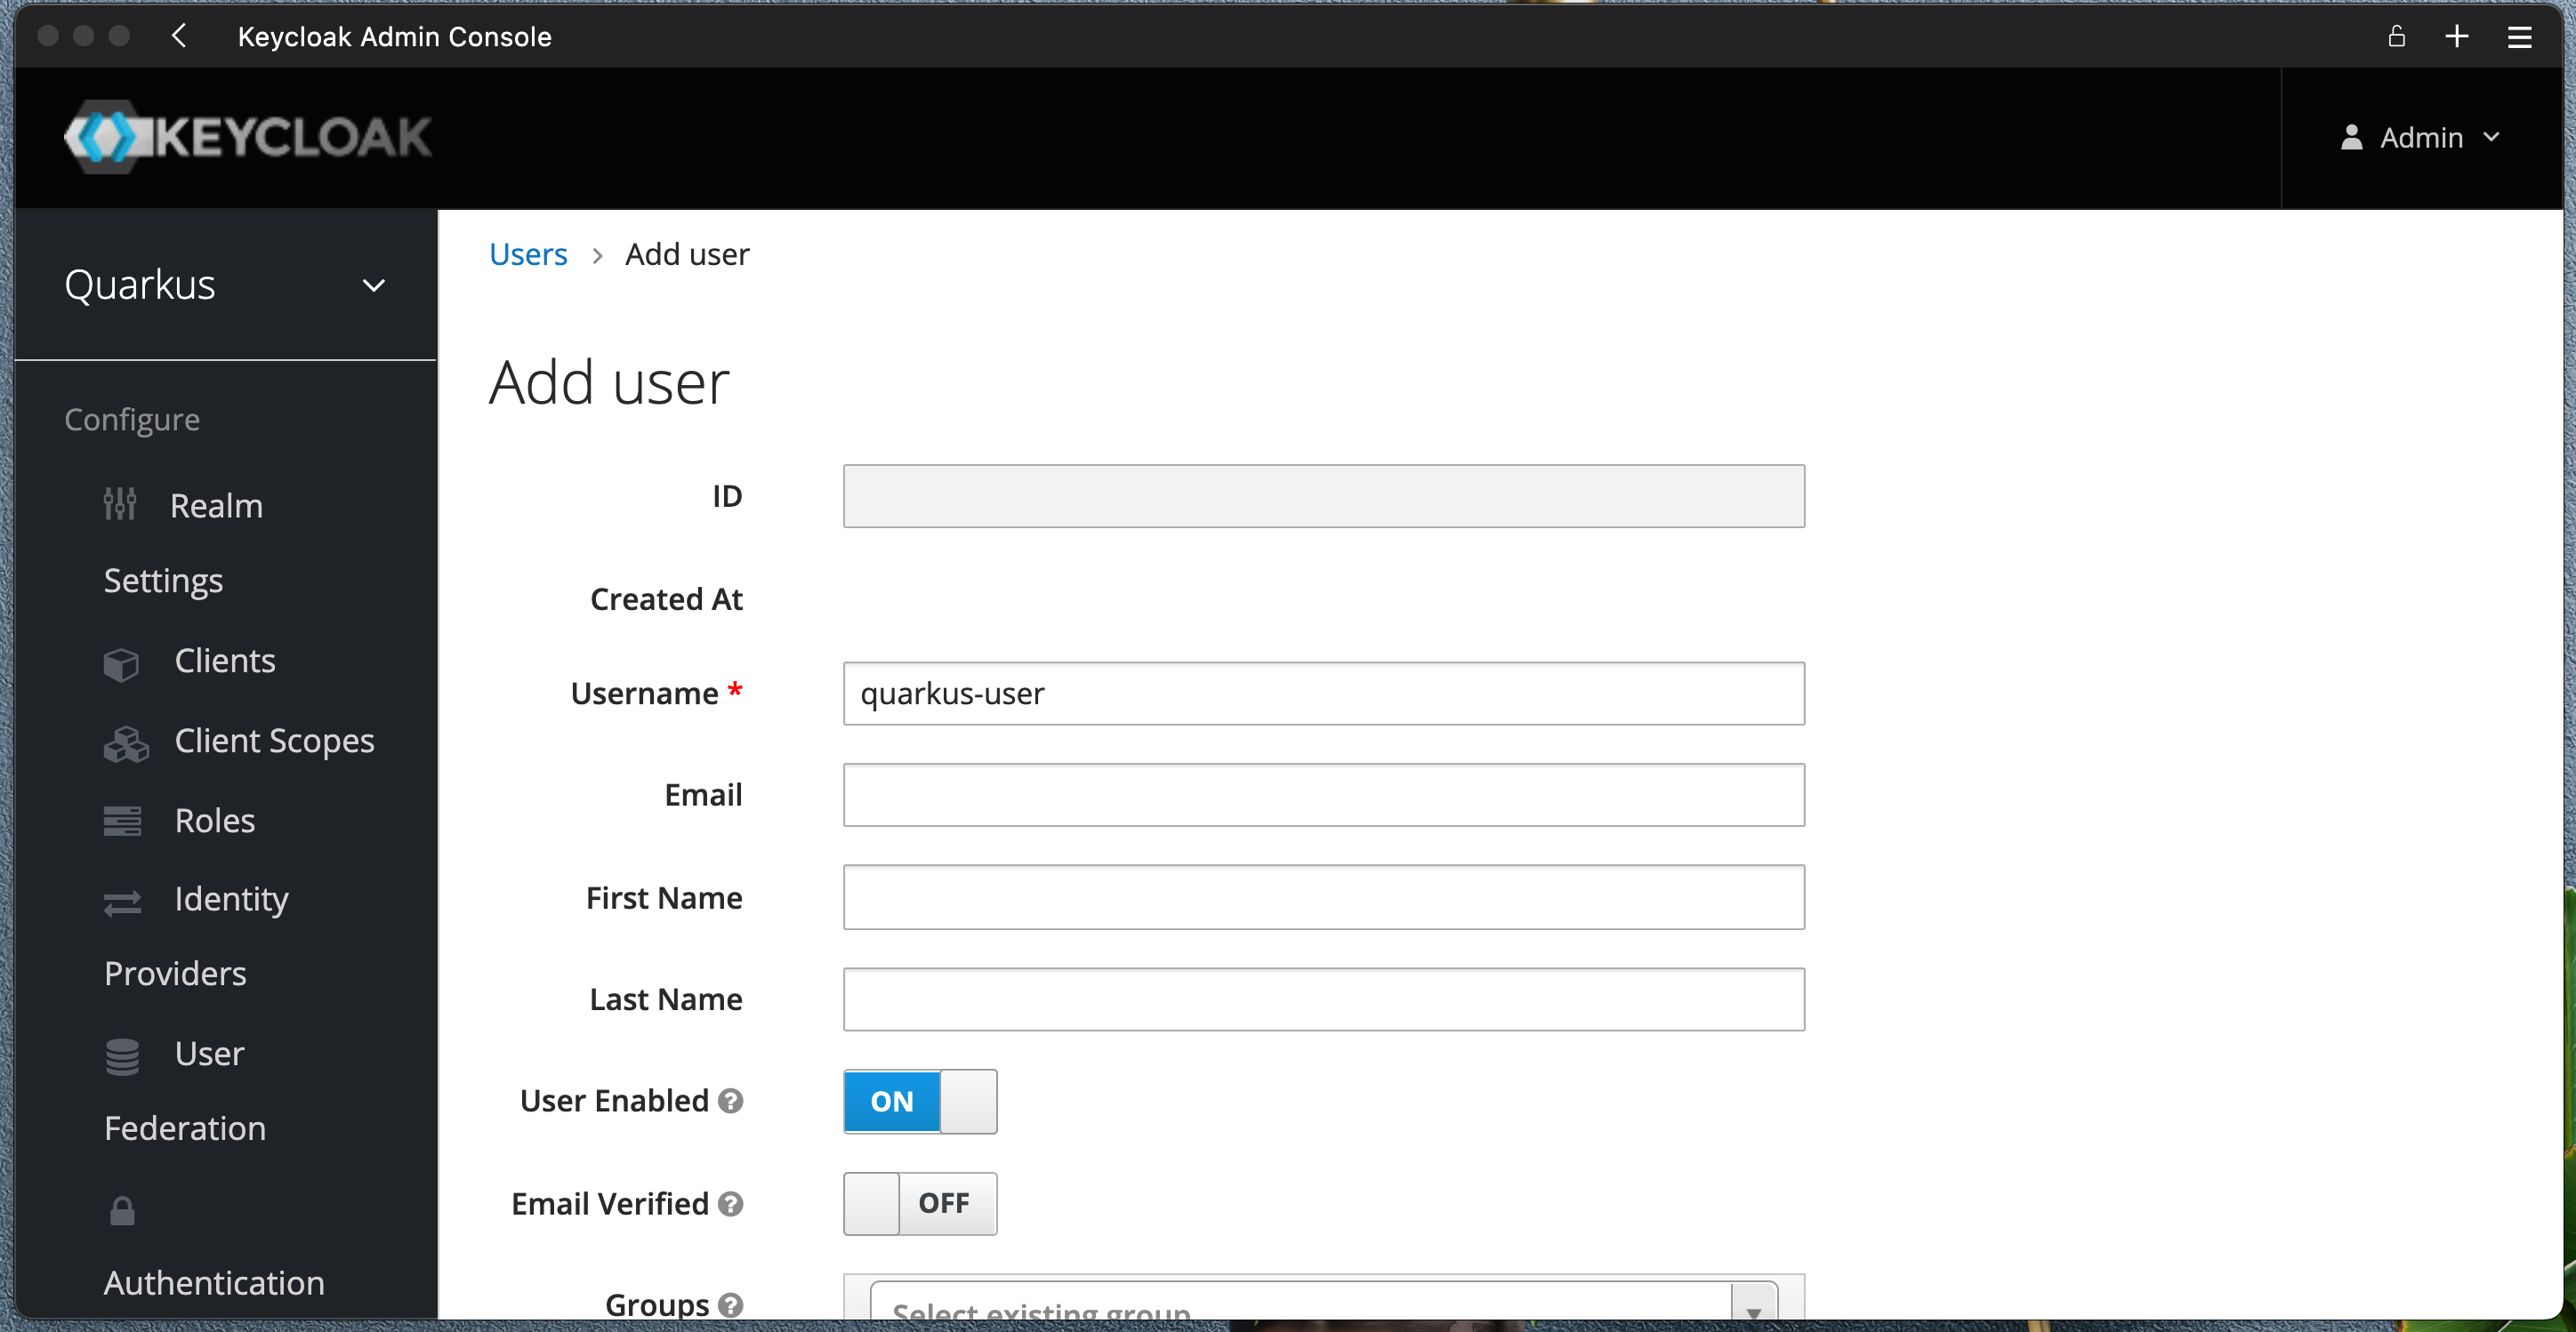
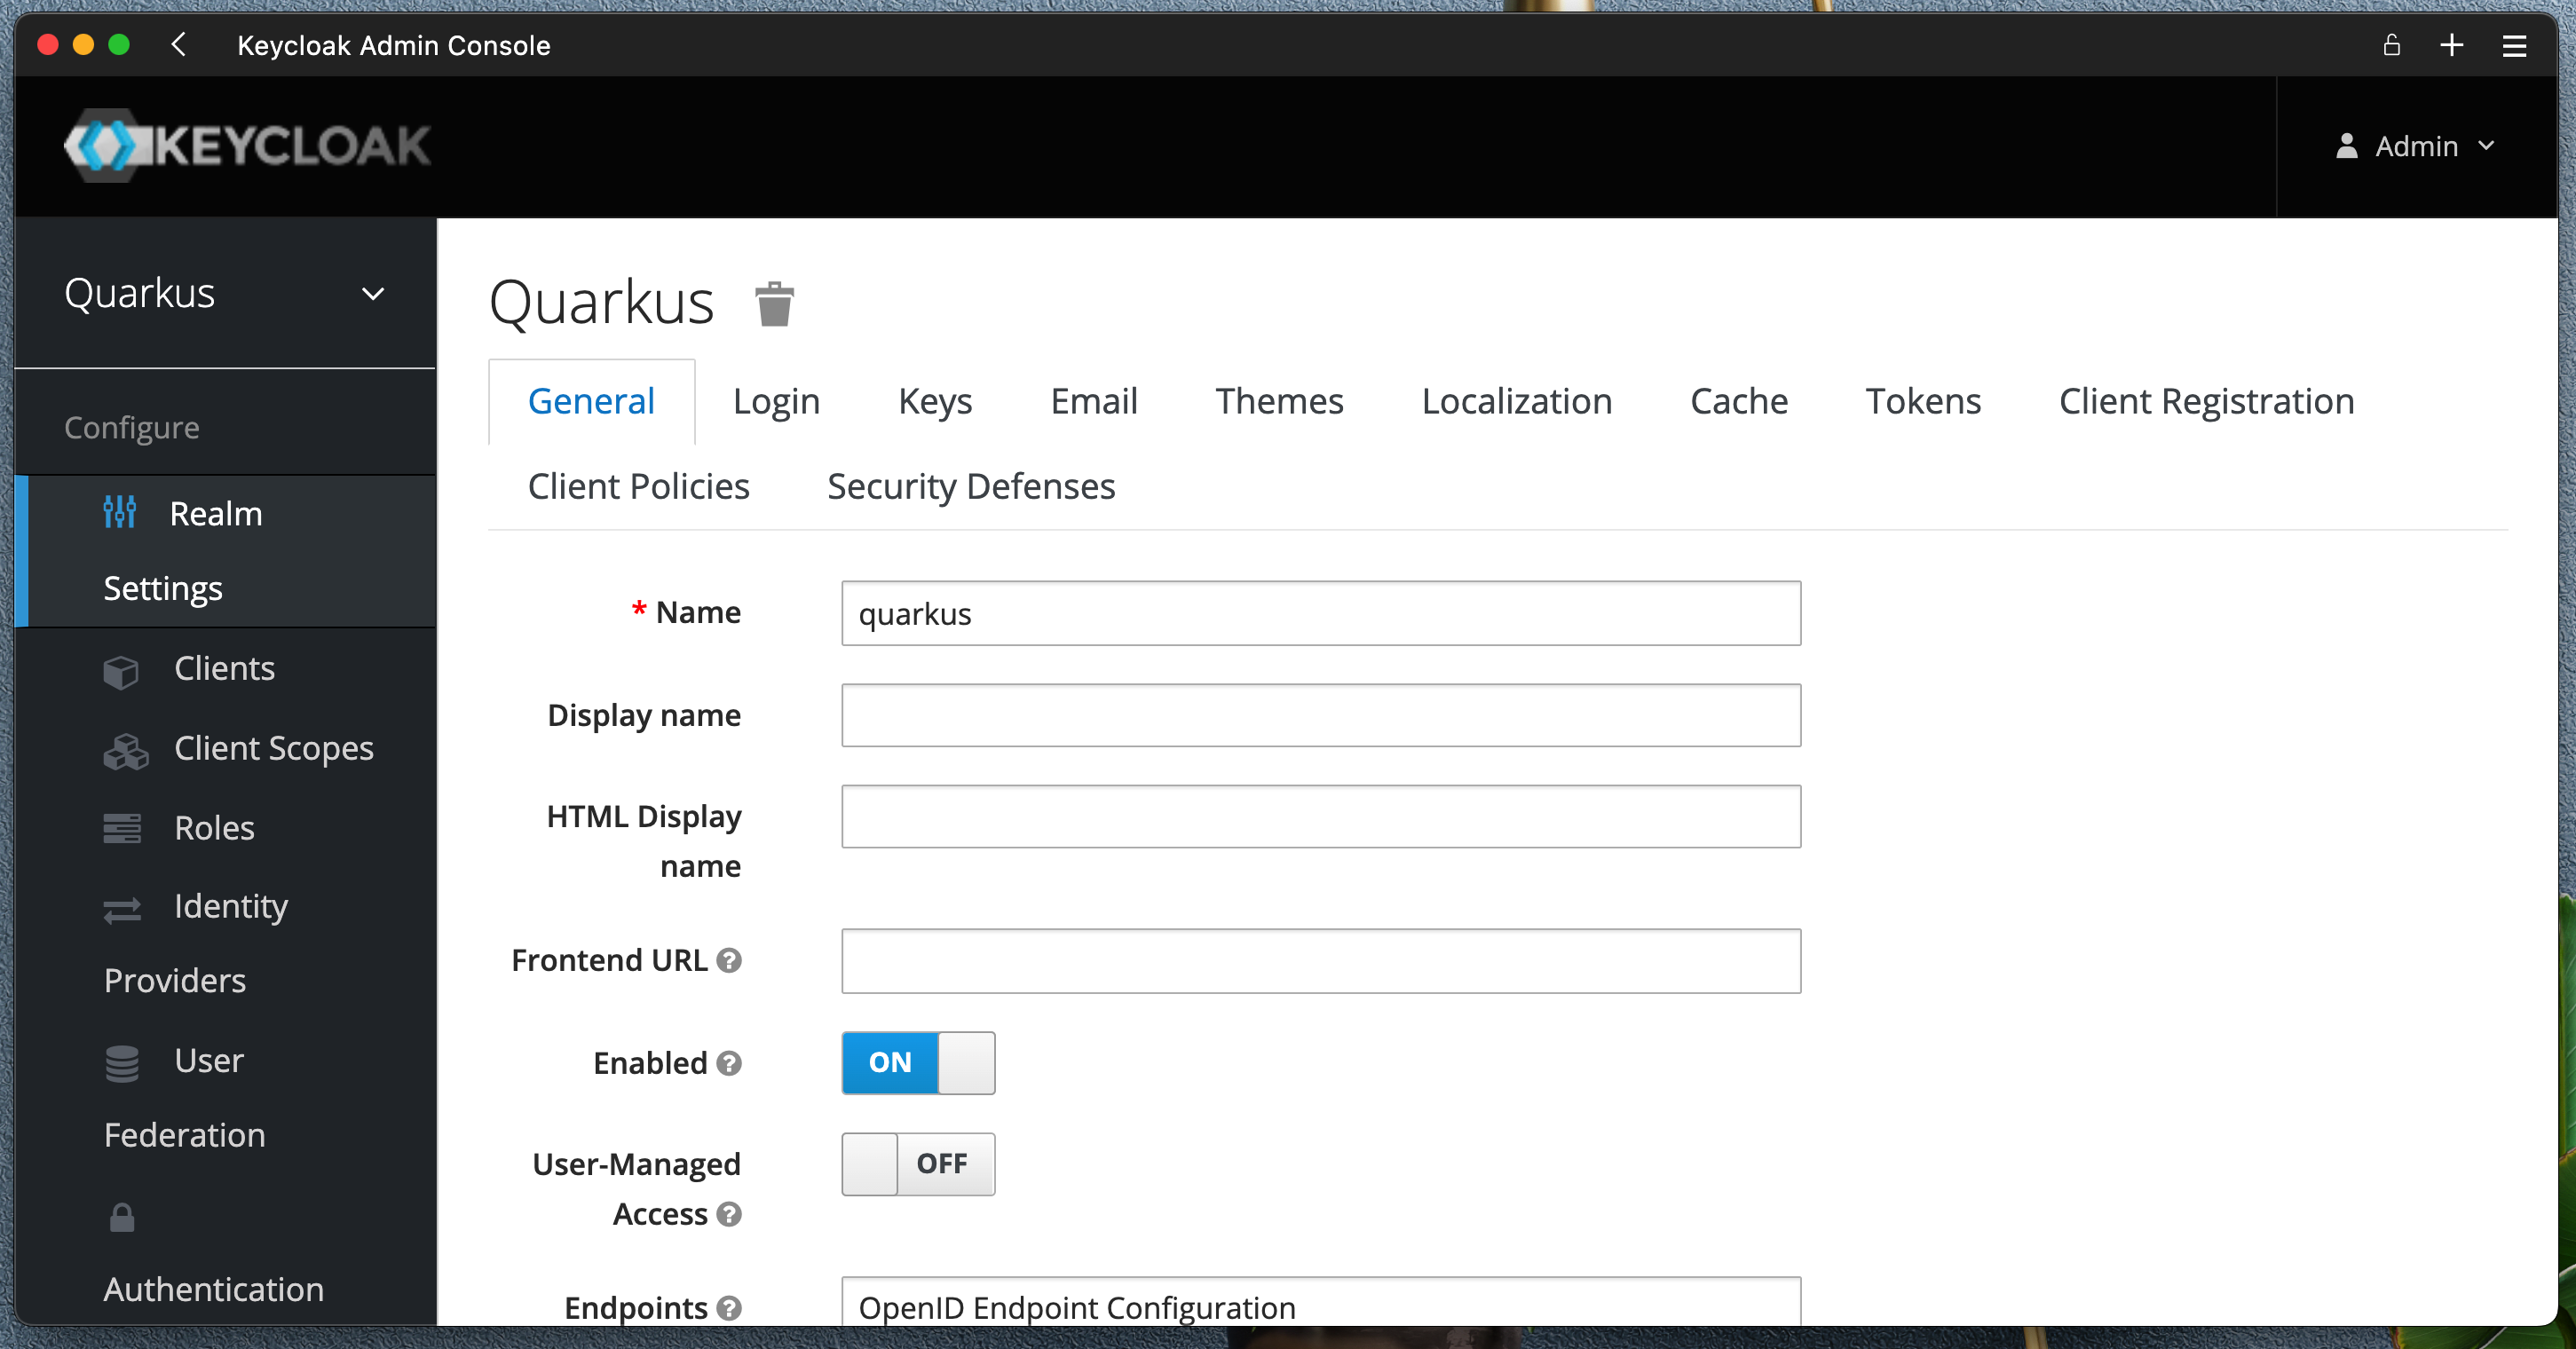 Create a new User
 quarkus-user
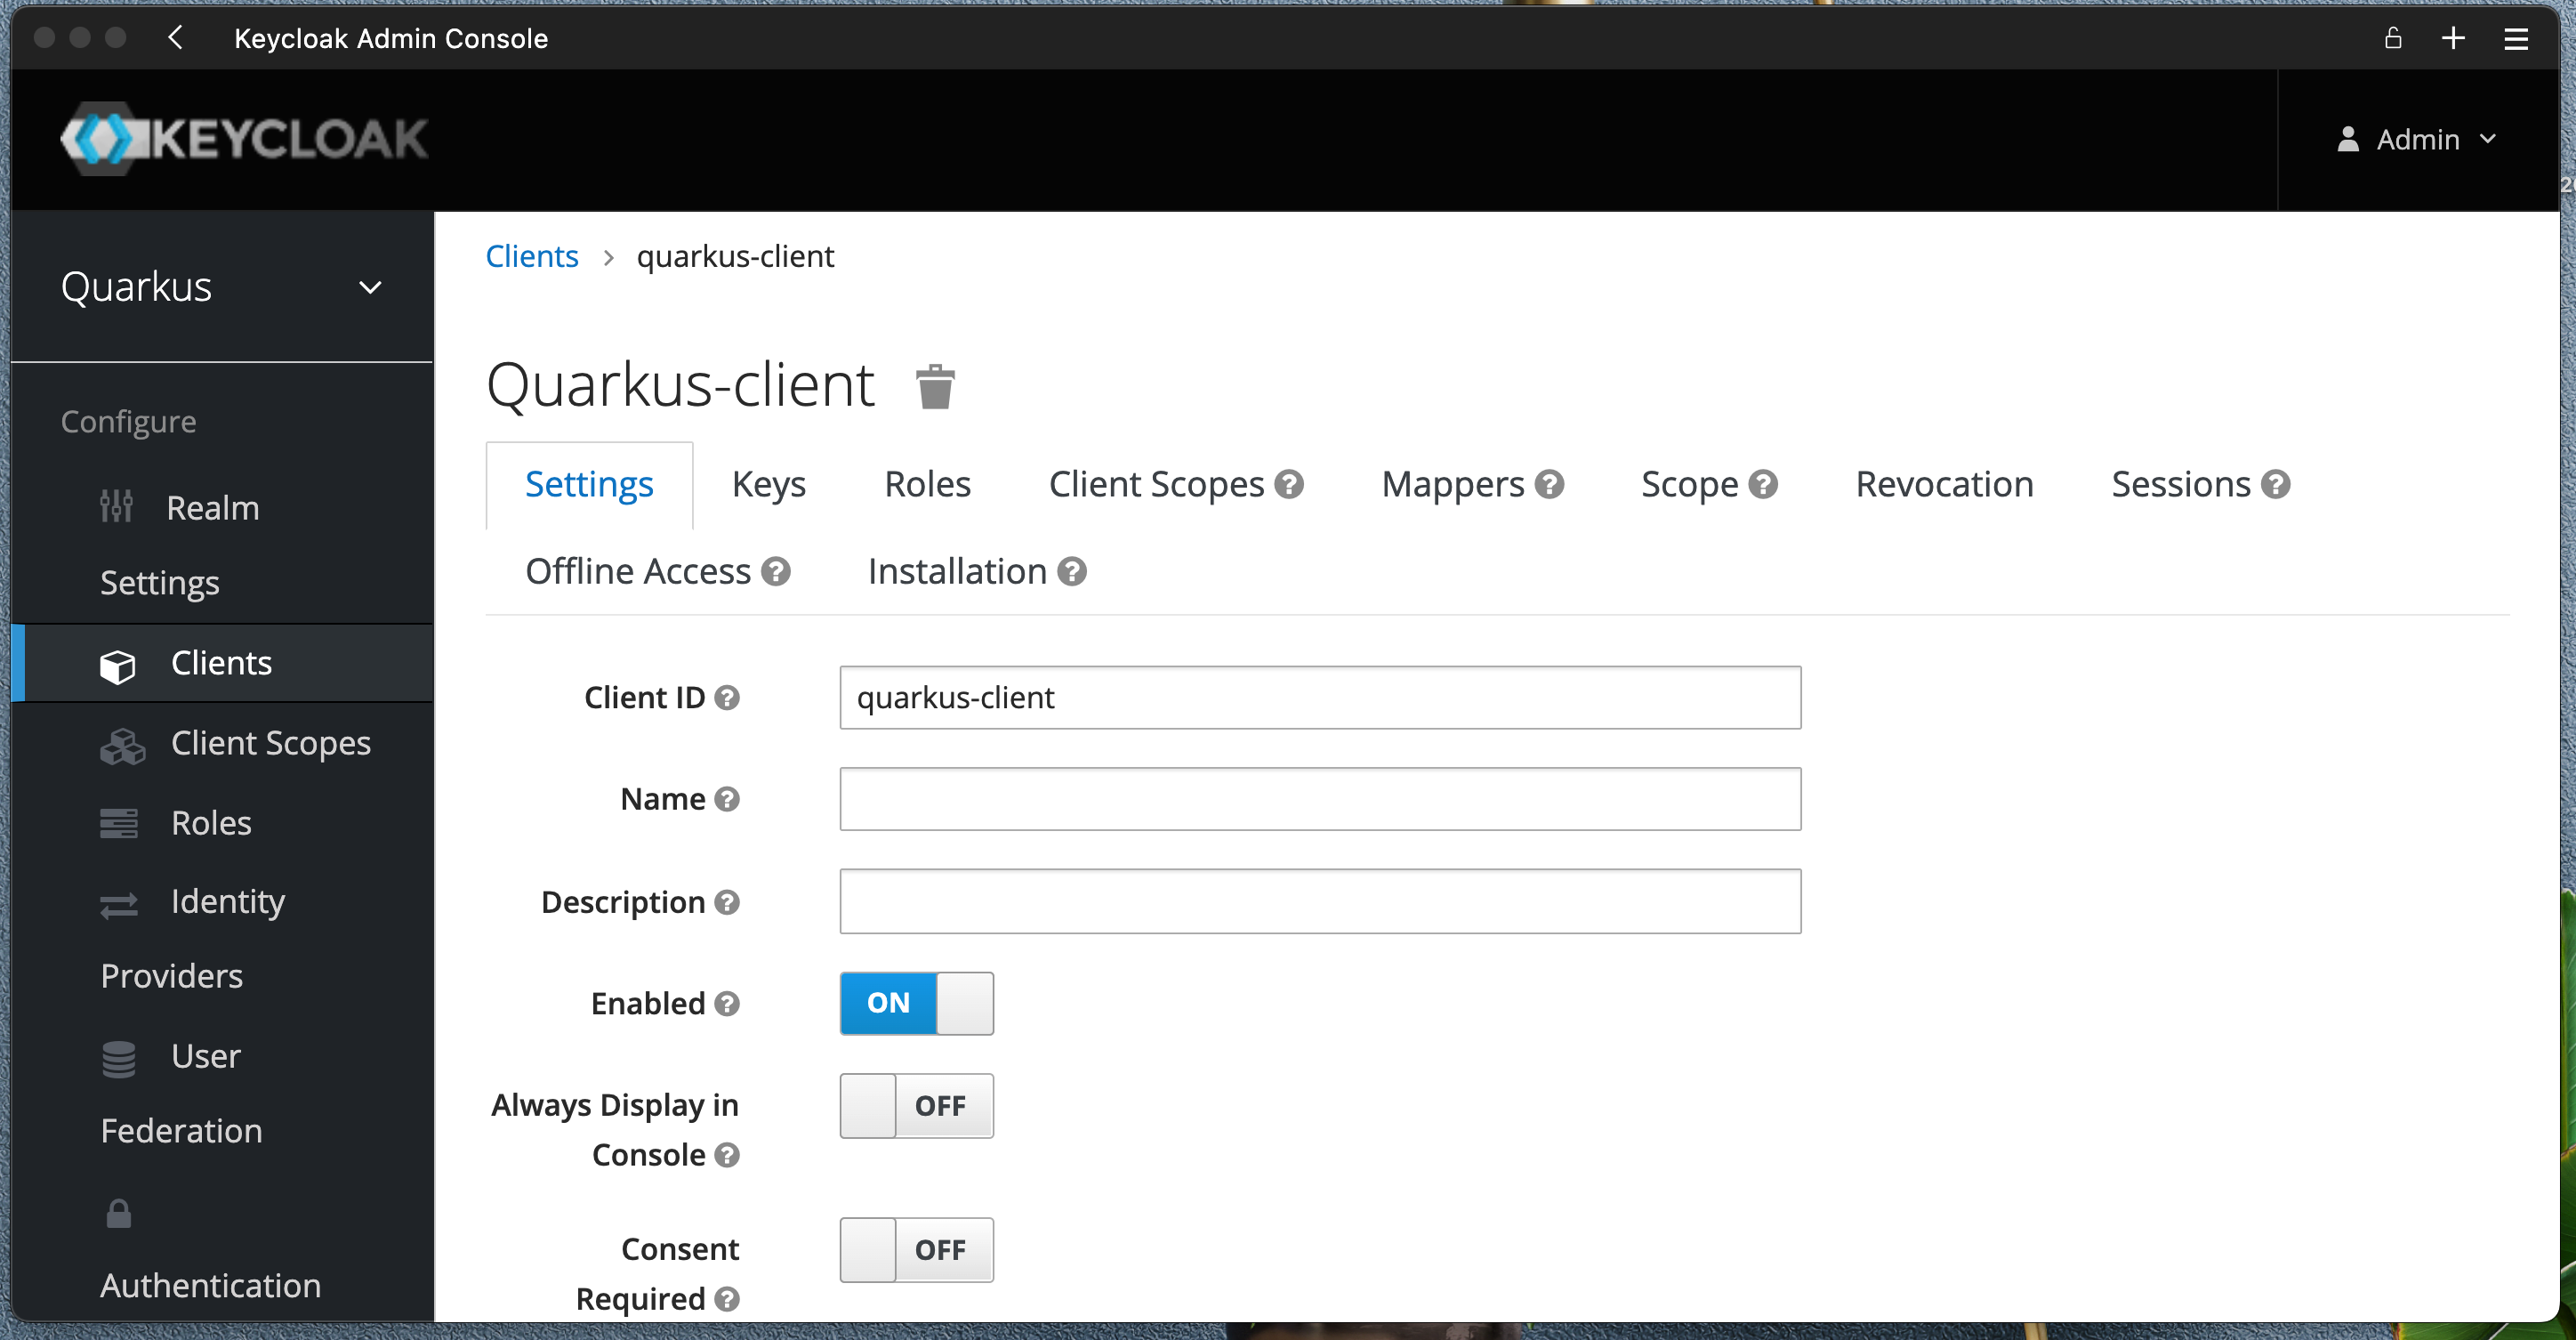
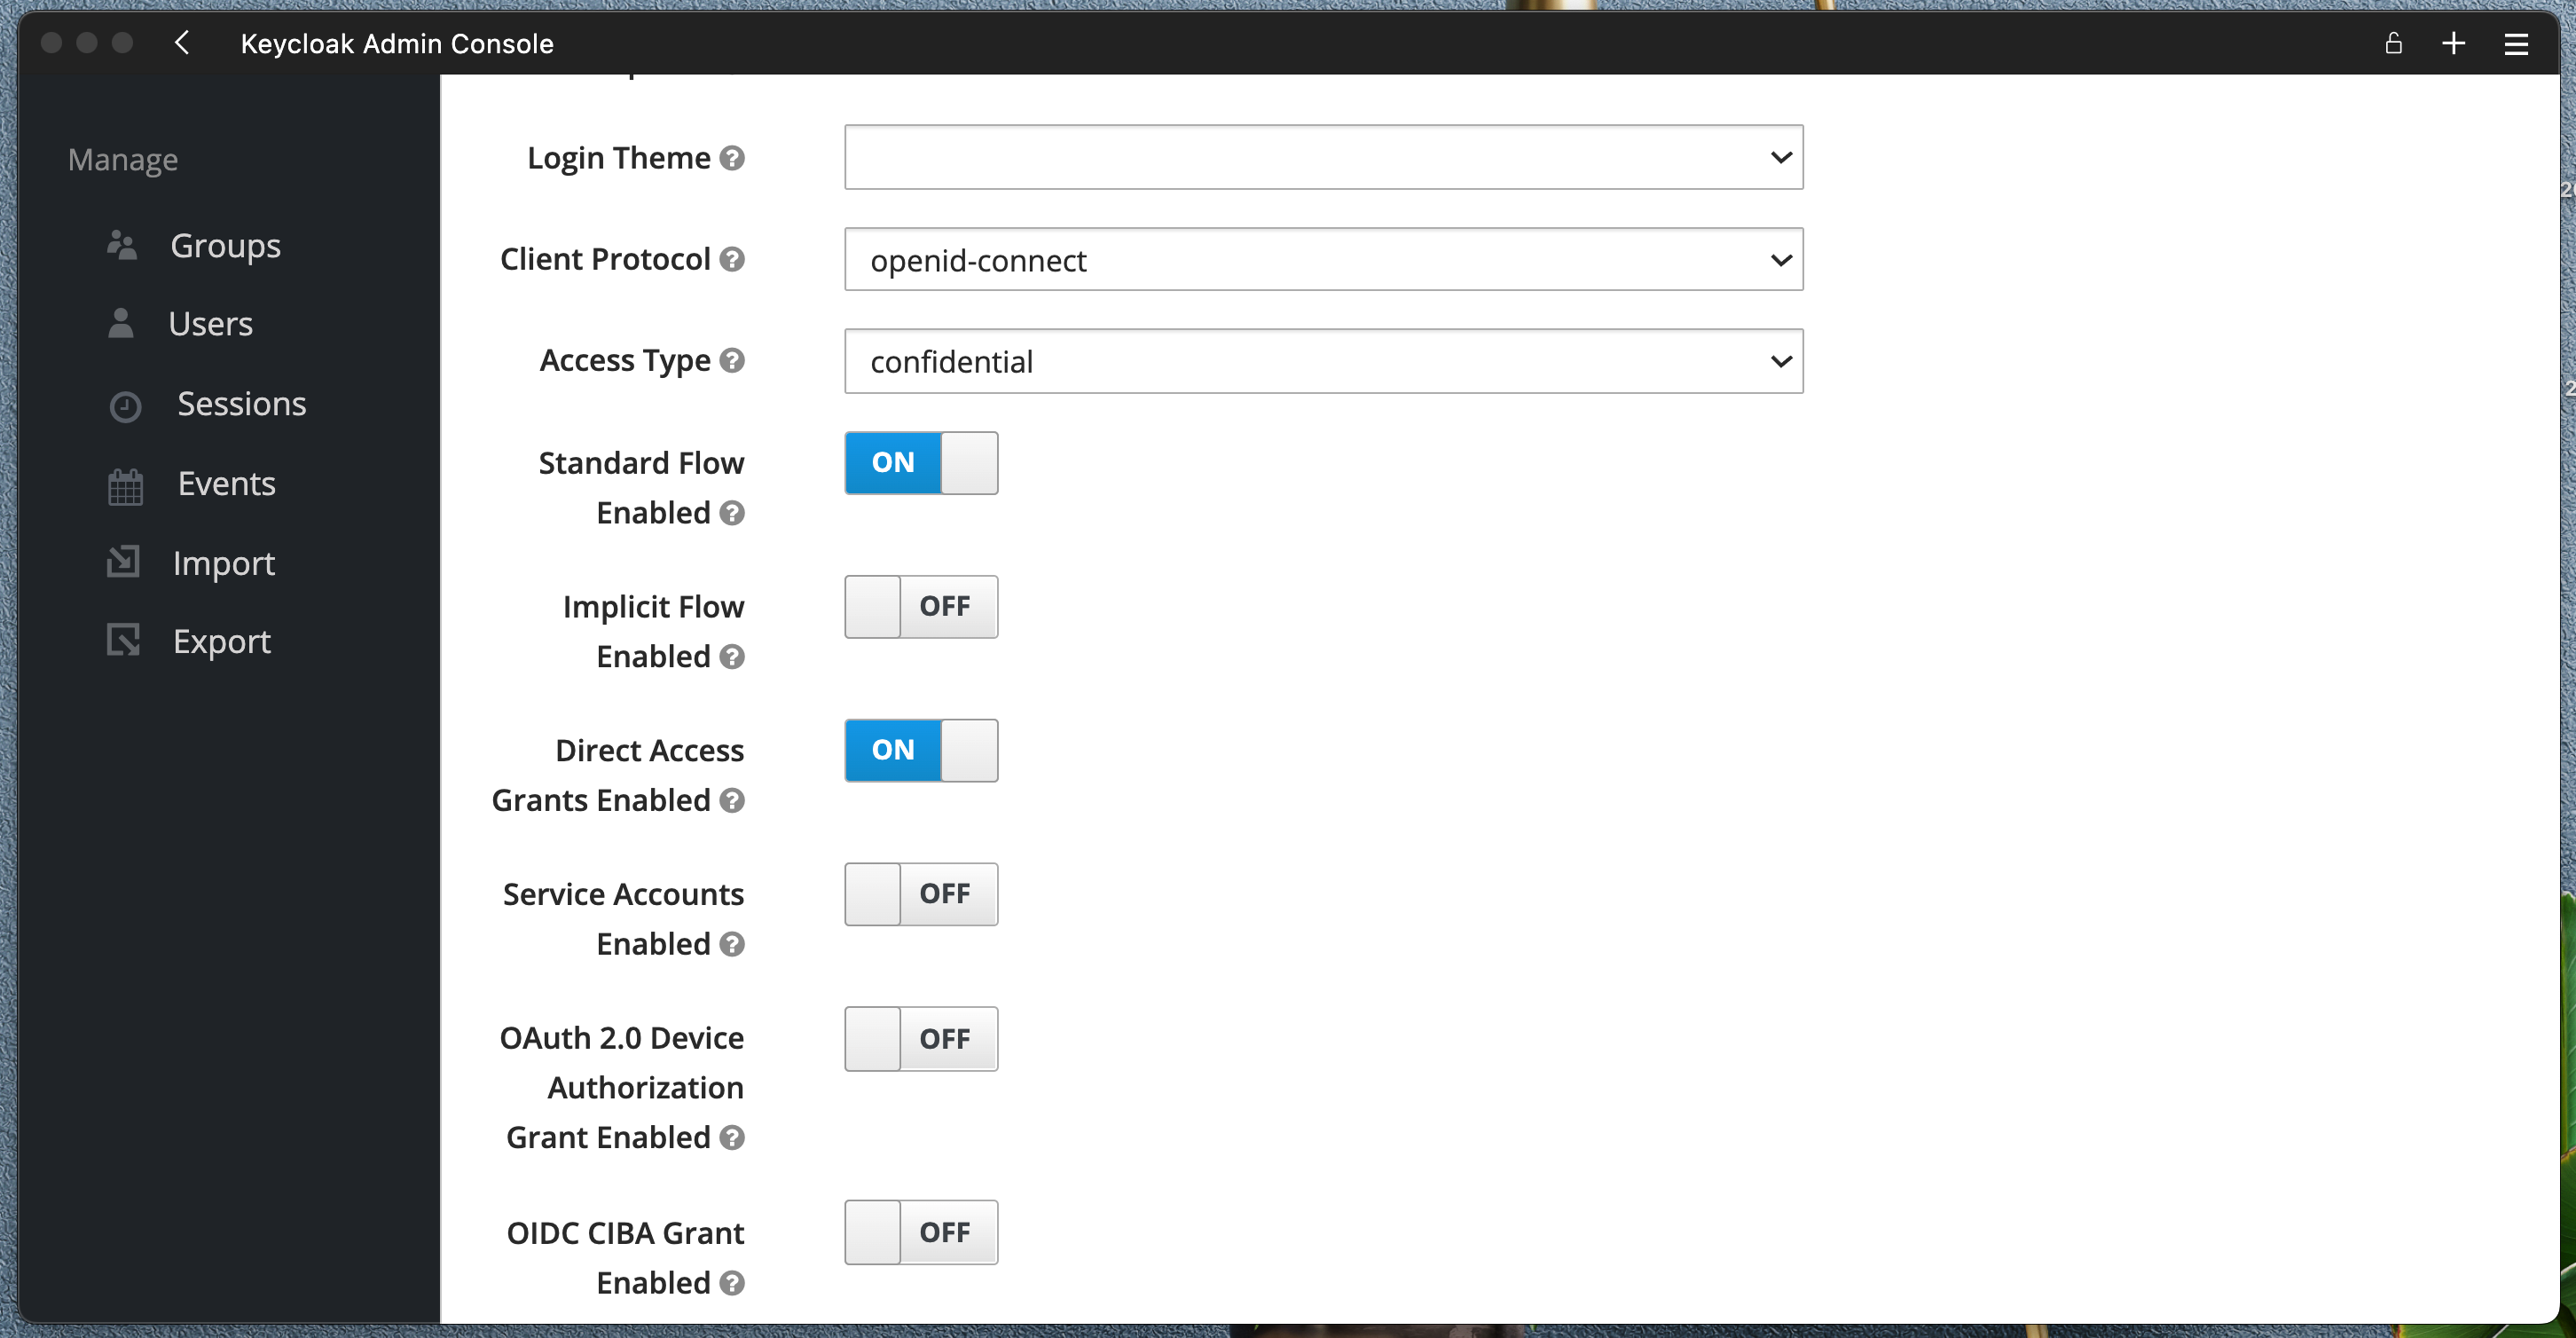
Create new client quarkus-client with Client Protocol openid-connect, Access Type confidential, Standard Flow on and Direct Access Grants Enabled on
Create new client quarkus-client
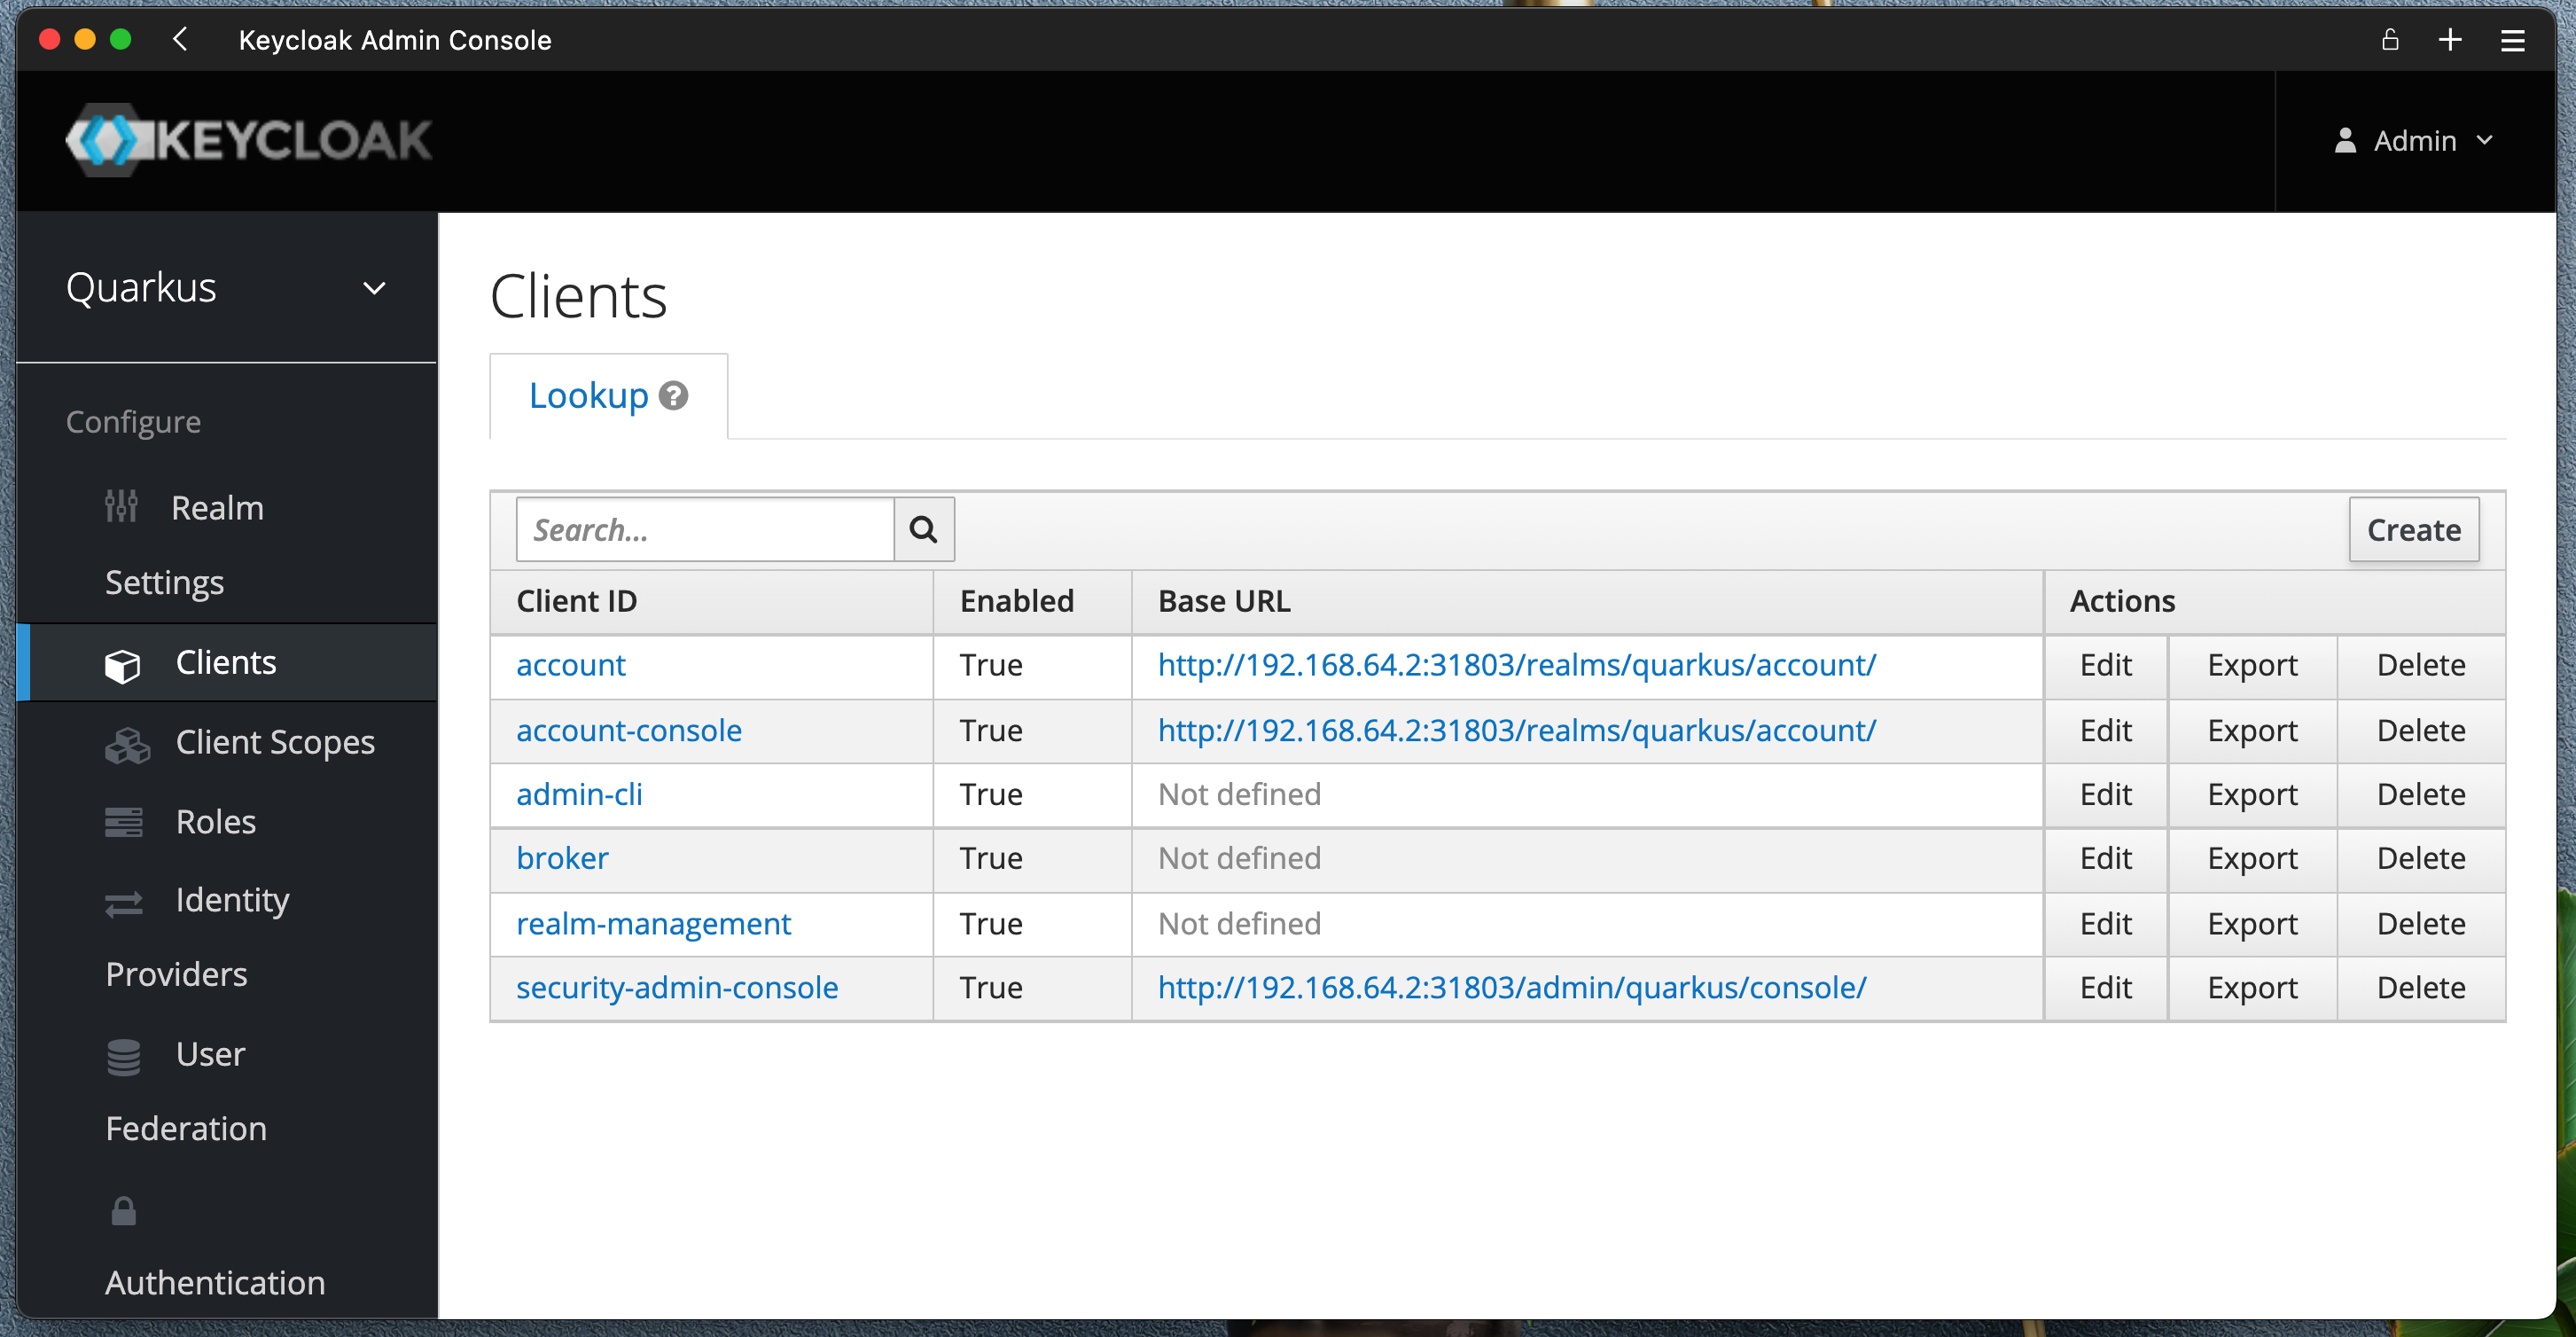
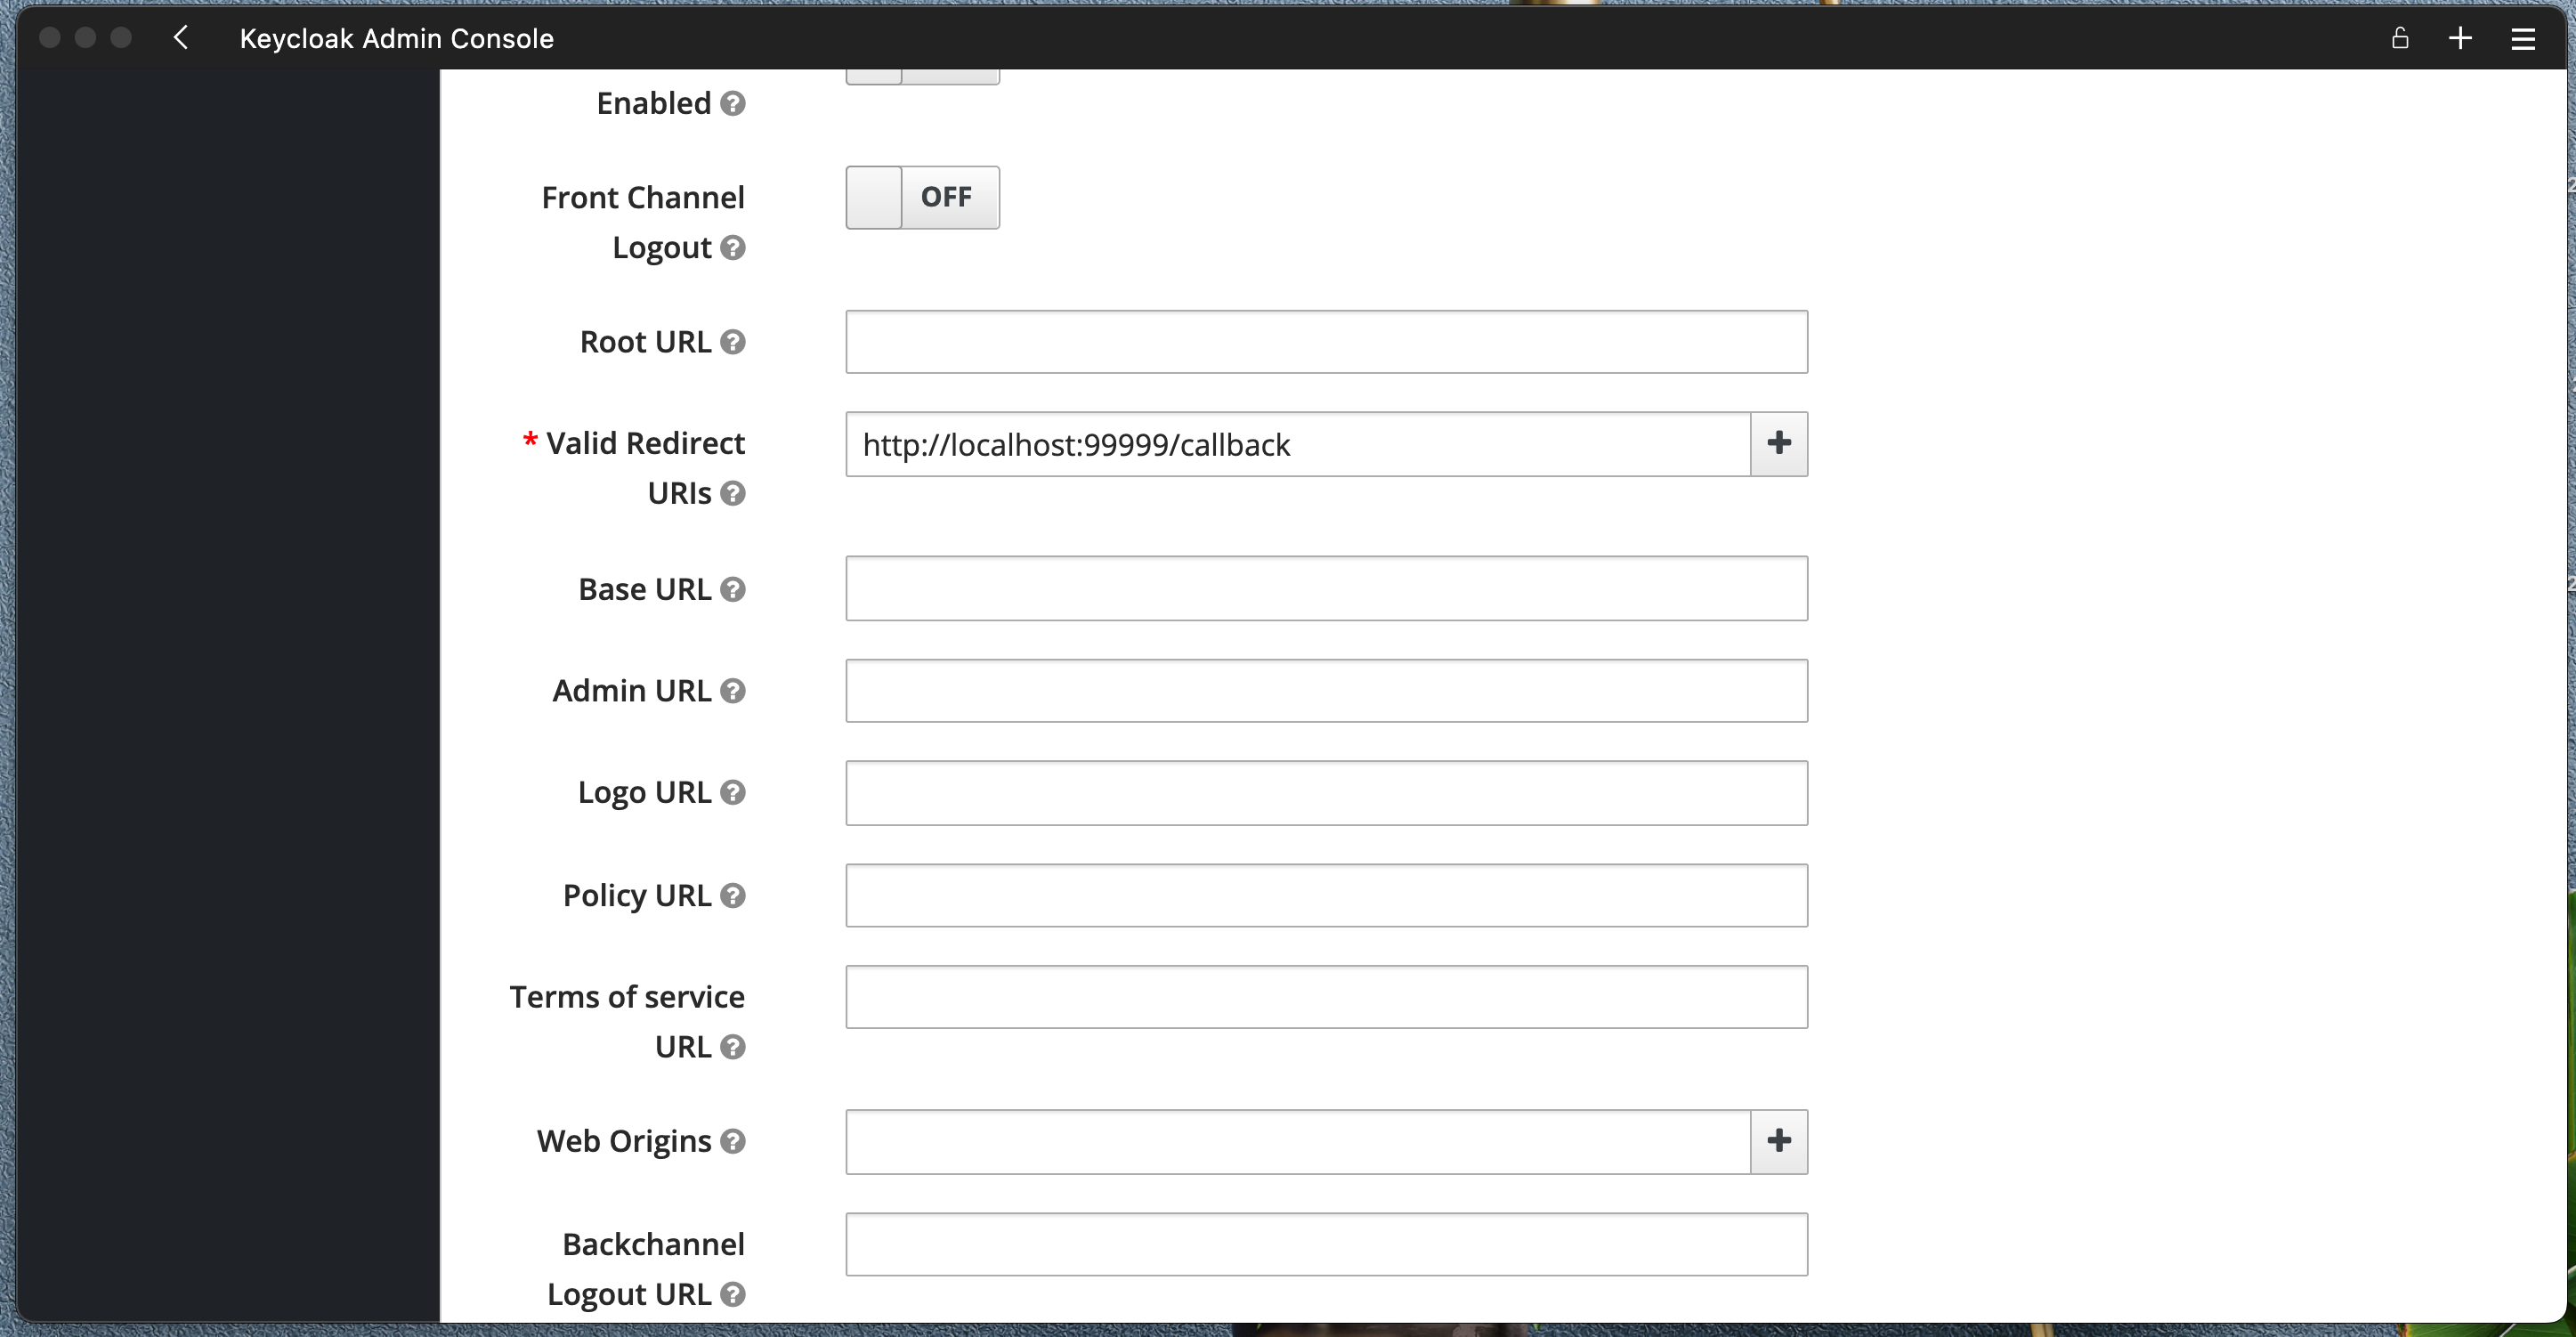
Set Valid Redirect URIs to somthing like http://localhost:99999/callback for now.
Save your settings and click on Credentials tab, make note of your Client name and Clent secret.
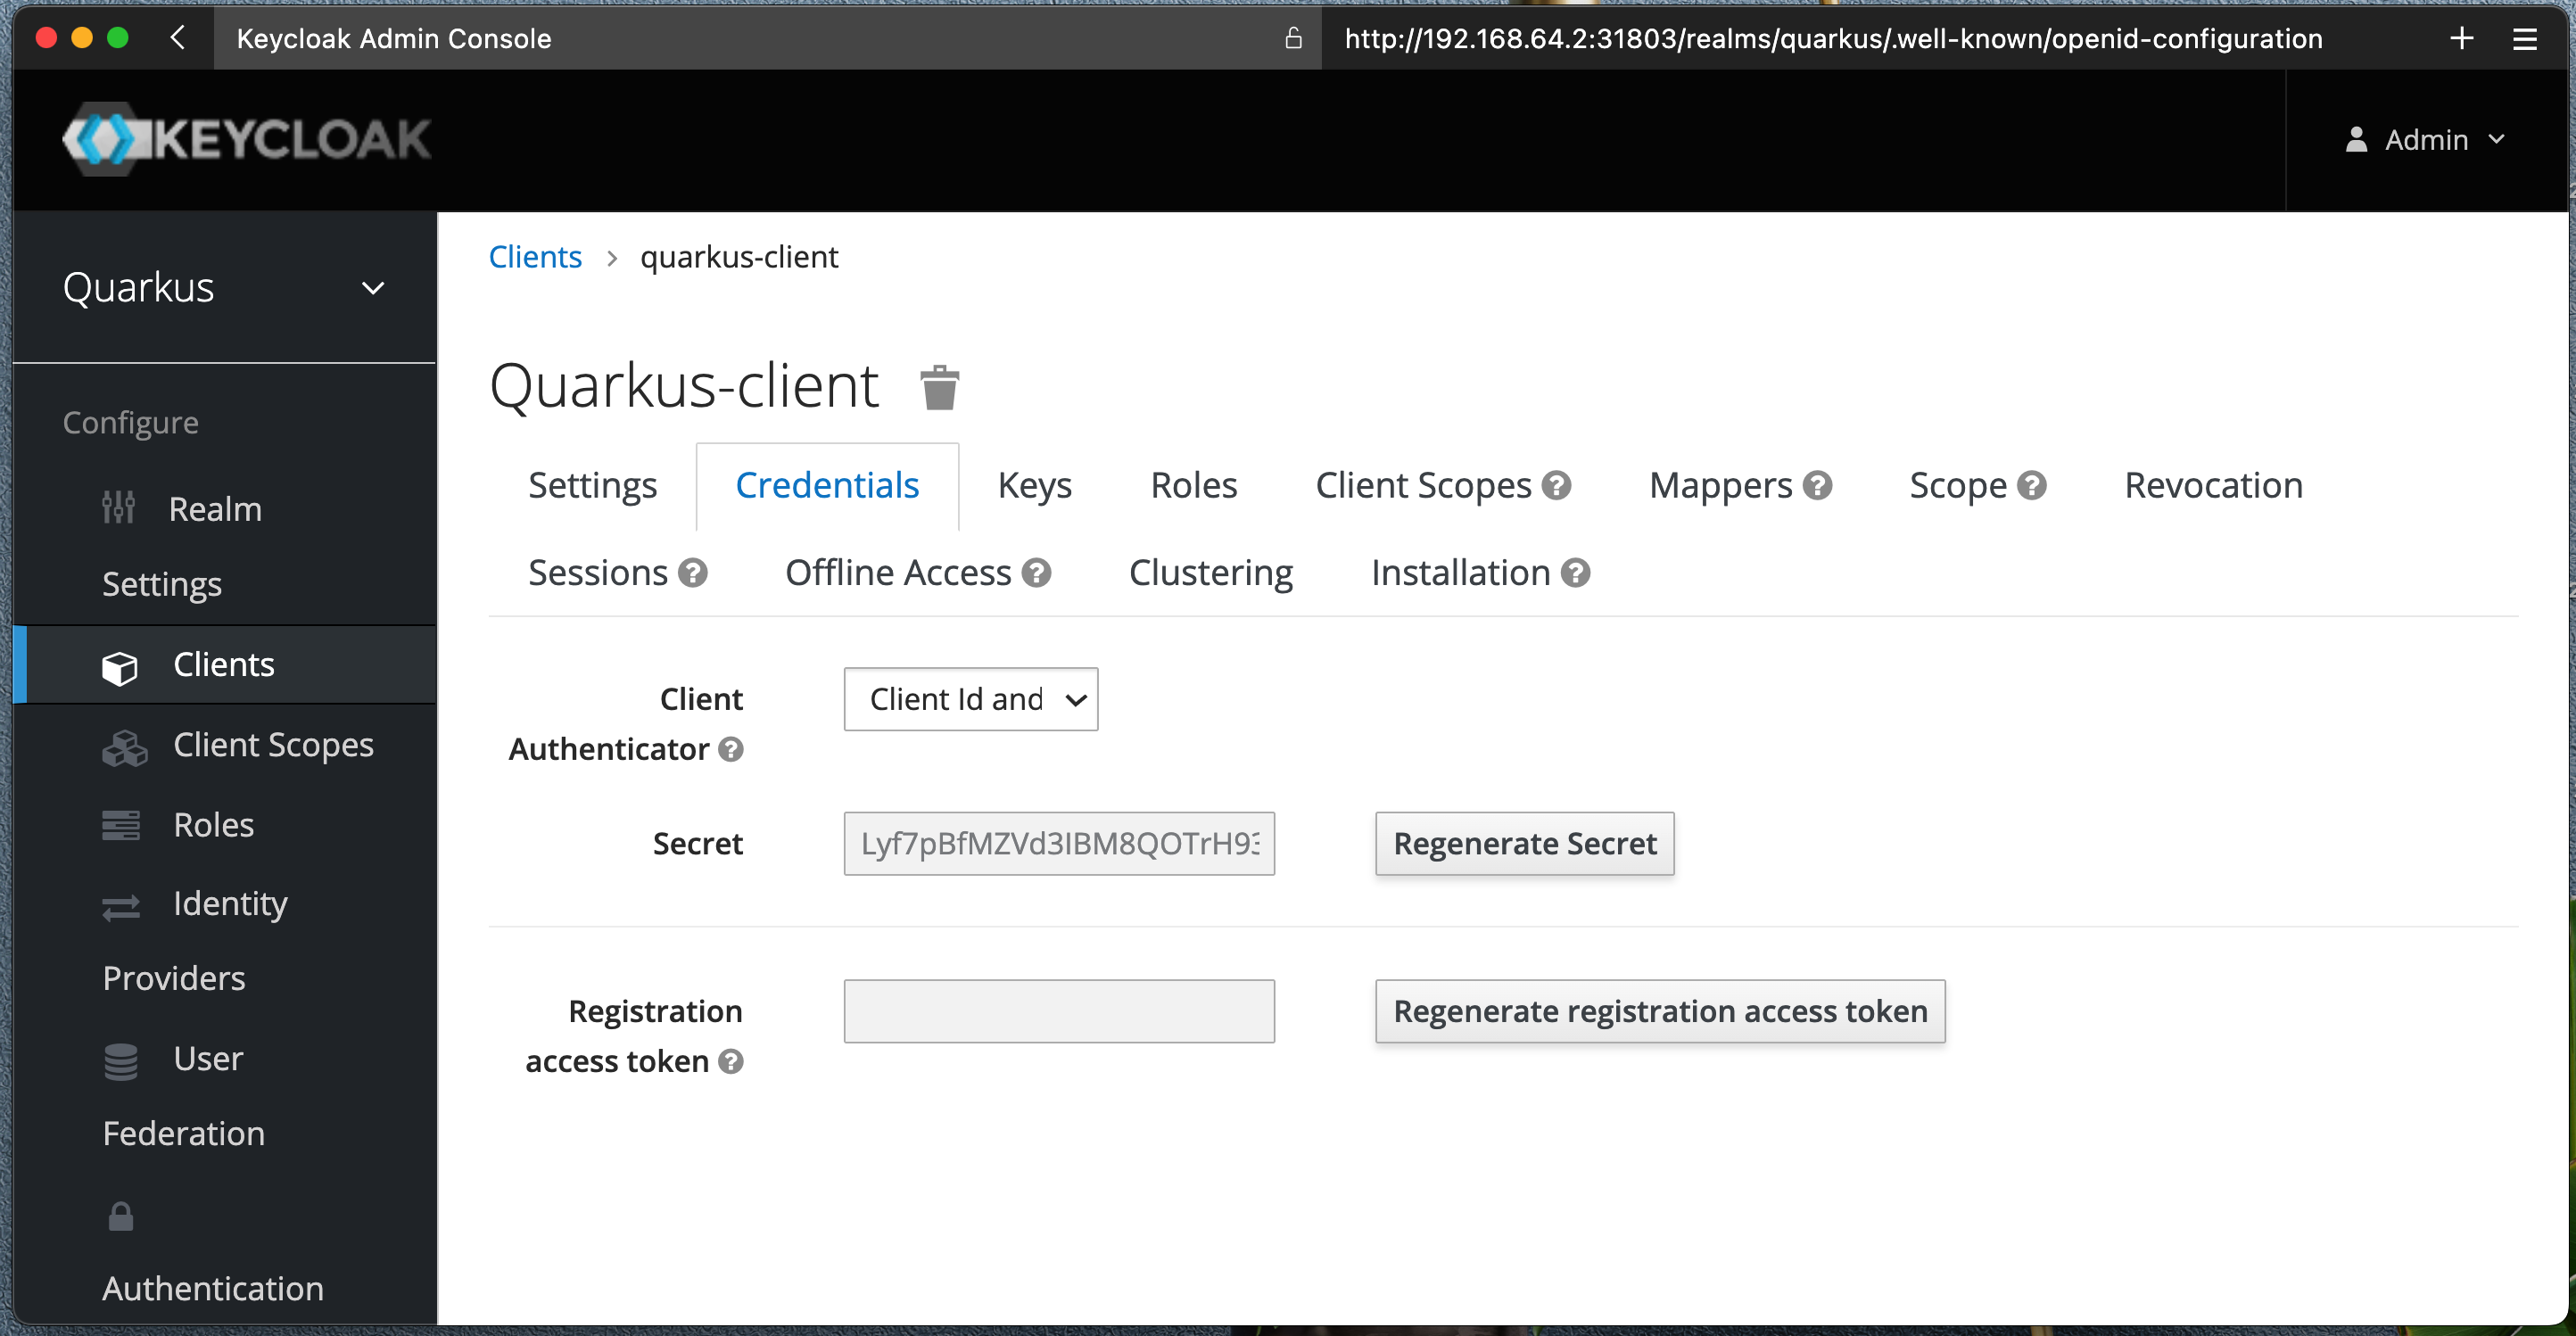
Open up Postman and enter this url:
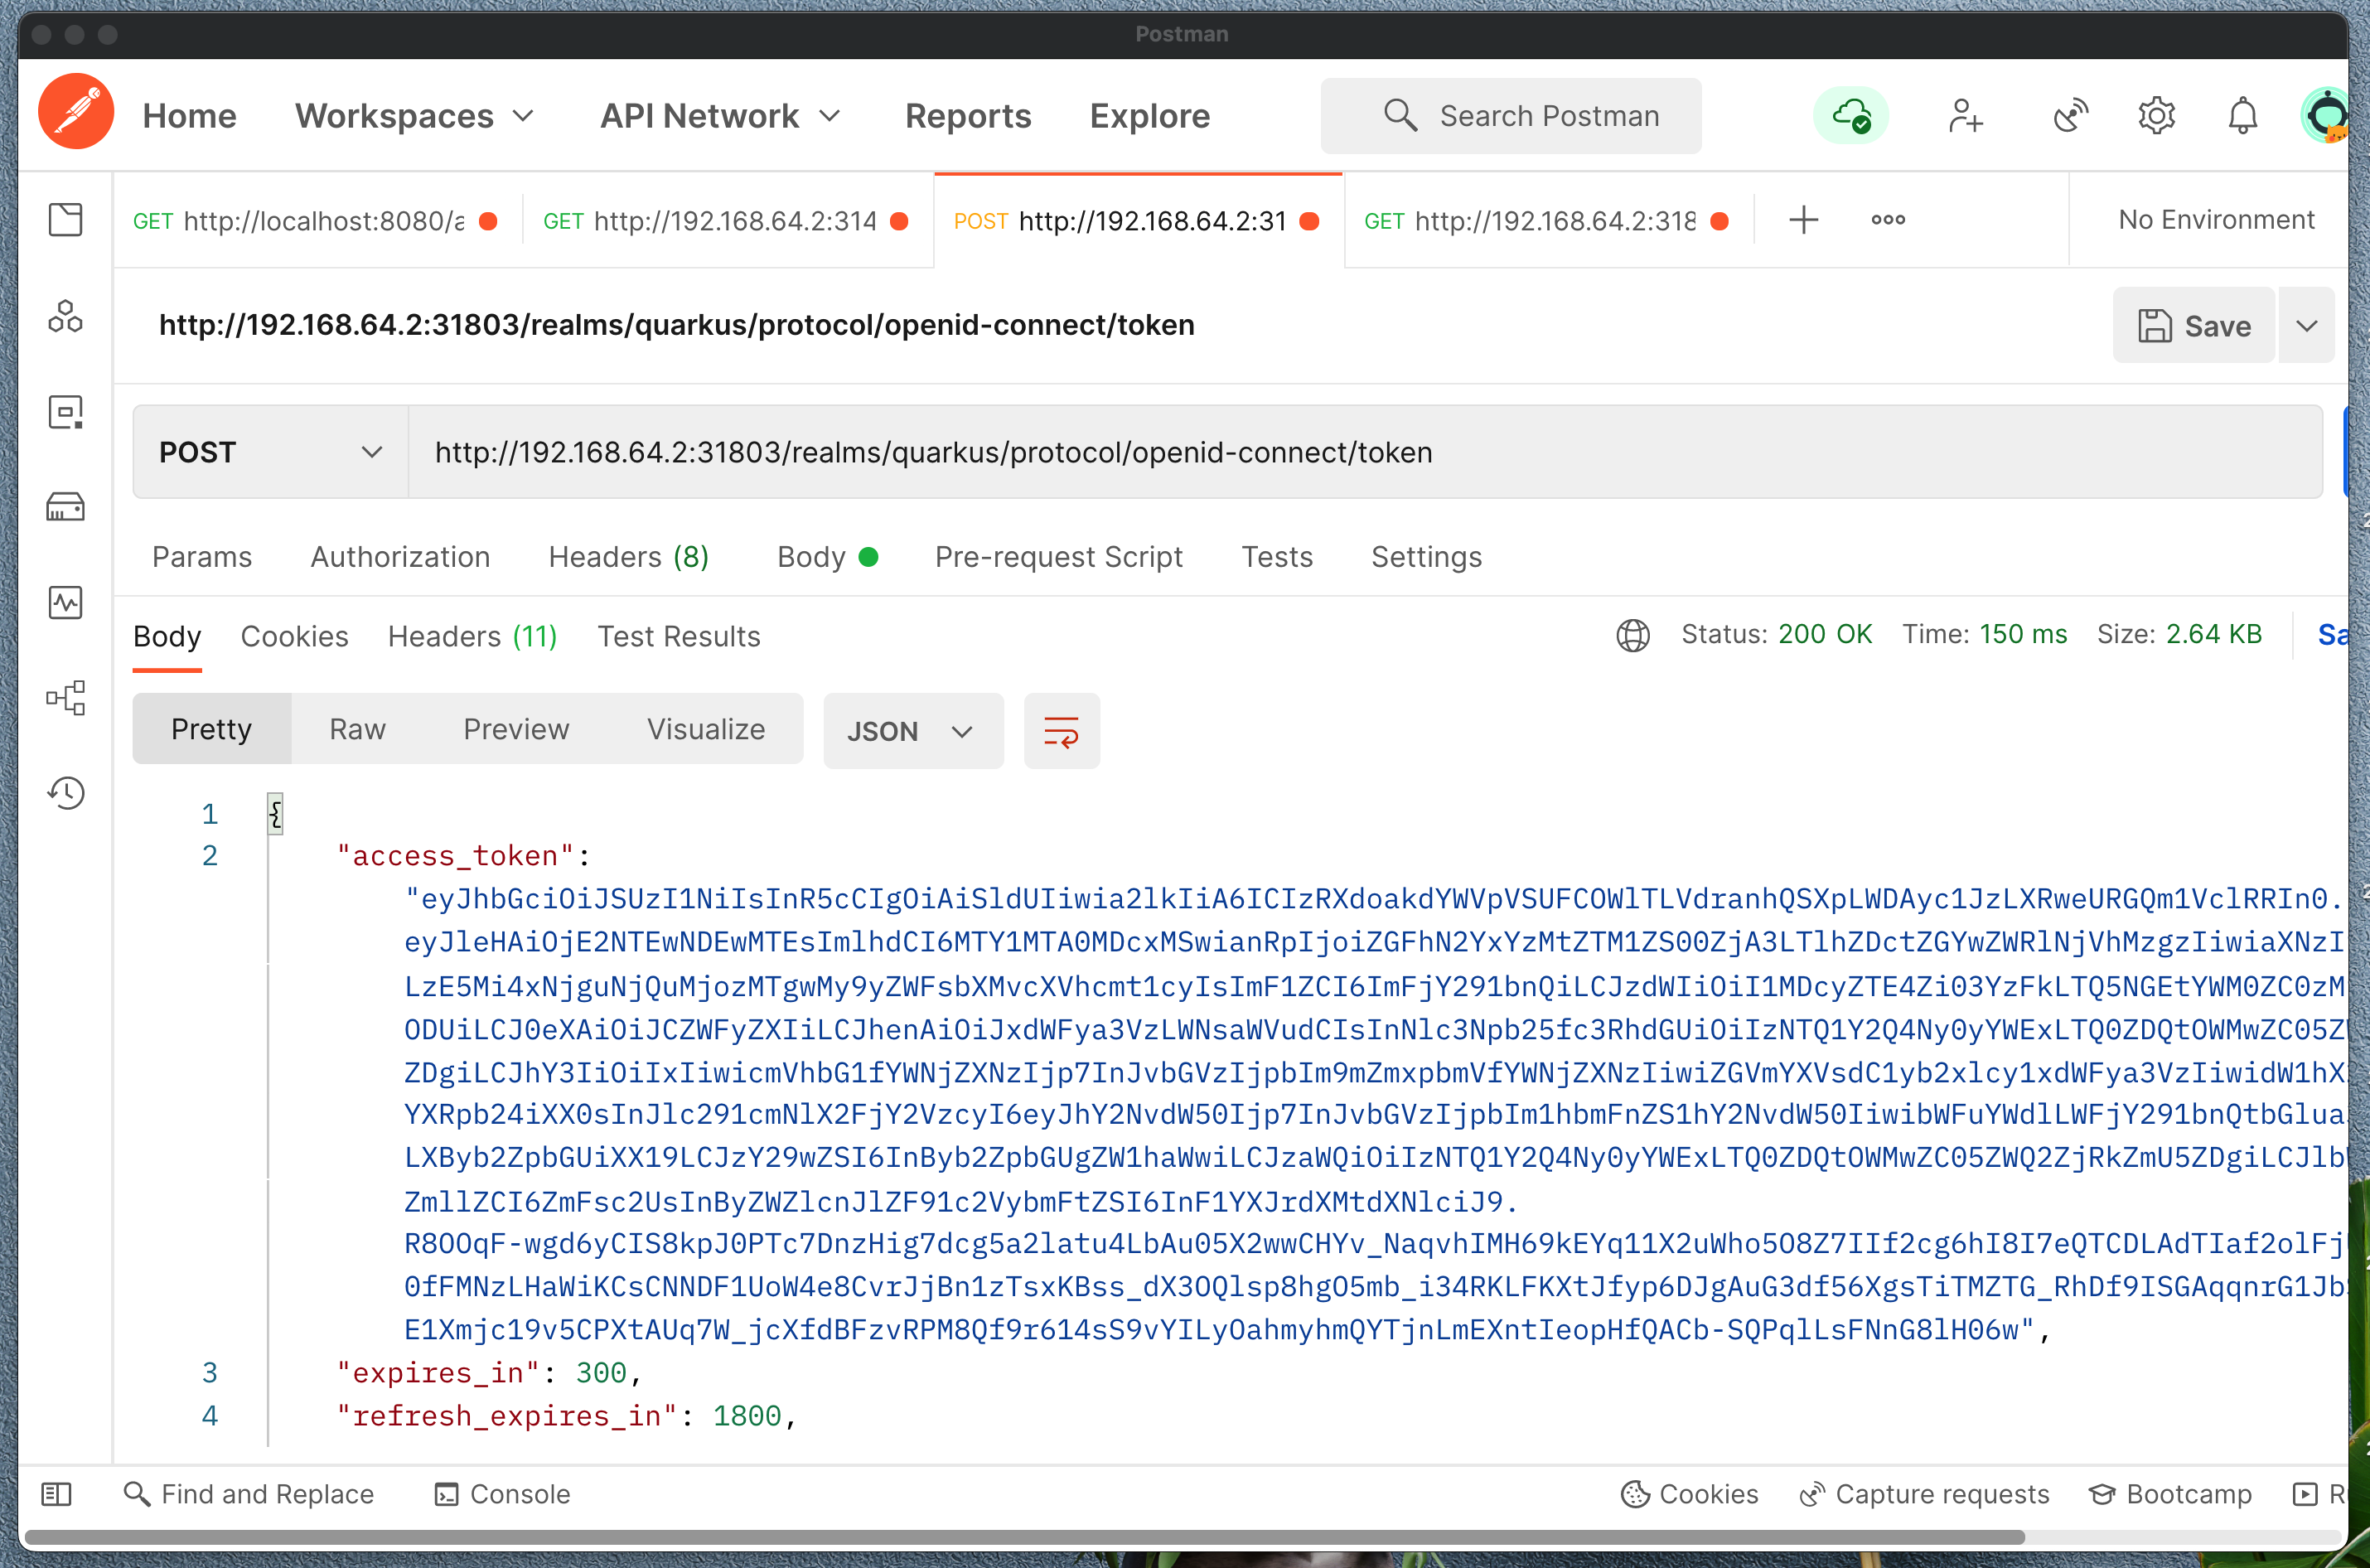
http://192.168.64.2:31803/realms/quarkus/.well-known/openid-configurationWe are interested in token_endpoint, copy that and enter to new Postman request as POST.
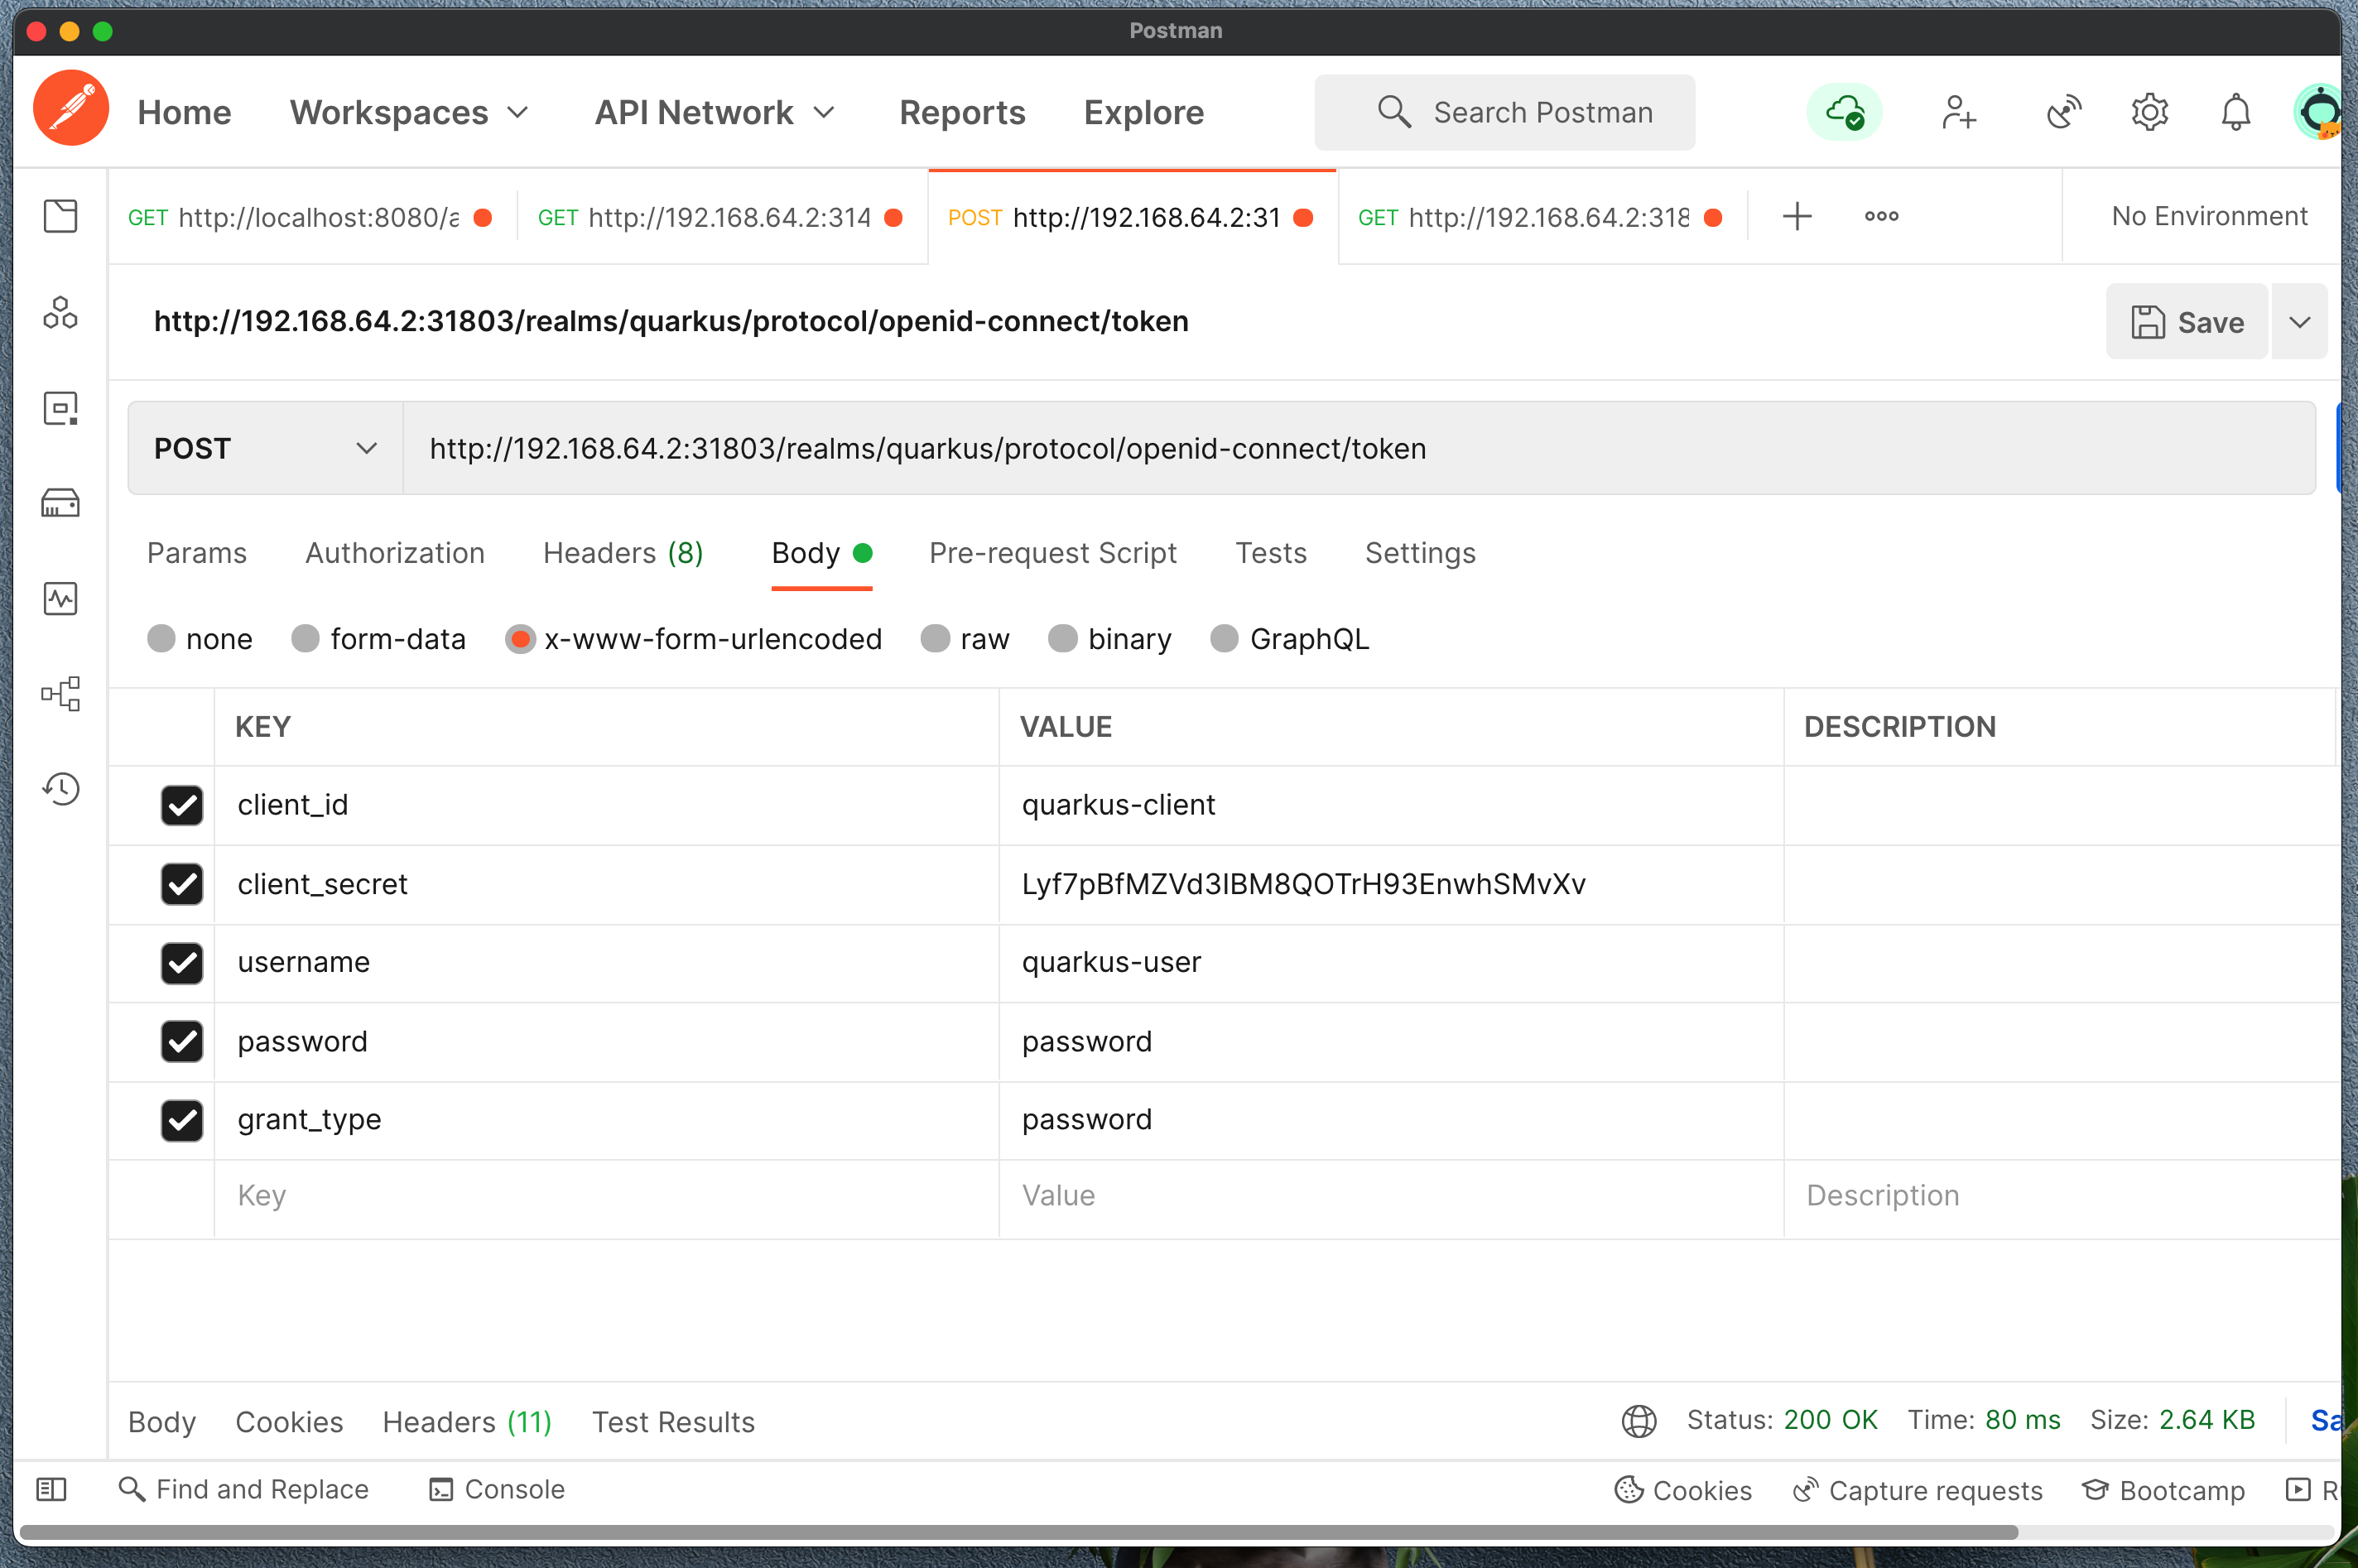
Enter post body as x-www-form-urlencoded:
client_id = quarkus-client
client_secret = <copy from Client page>
username = quarkus-user
password = password
grant_type = password
You should get the response with access_token, refresh_token and more. This access_token you will need to identify you service calls.
Add quarkus extension
mvn quarkus:add-extension -Dextensions="quarkus-oidc"Please watch the video for complete implementation

