This repo is part of CS277 project: Deep Reinforcement Learning in Portfolio Management.
The whole project consists three repos for three parts:
- Preprocessing:
- Pre-stock-selection
- Processing raw data provided by SSE
- Generating datasets for DQN and DDPG based on the selected stocks
- DQN:
- Implement of trading agent based on DQN
- DDPG:
- Implement of trading agent based on DDPG
This repo is for the preprocessing part.
Before running the select_stock.py script, please check that you have put the /quot folder under the /data folder.
python select_stock.pyThis script will:
- concat the raw data files
- select 19 stocks randomly
- generate datasets files for DQN and DDPG
- conduct correlation analysis and visualization for the 19 stocks
.
|-data
    |-quot
|-vis
|-select_stock.py
|-stock_table.csv
|-stock_history.h5
|-all_set.csv
|-train_set.csv
|-test_set.csv-
/quotfolder is the data folder consists raw data provided by SSE. -
/visfolder: Graphs and tables generated byselect_stock.pyon data visualization and correlation analysis. -
select_stock.py: the main script.
Following are examples of outputs generated by running the select_stock.py script:
stock_table.csv: table of stocks selected by theselect_stock.pyscript.all_set.csv: the dataset file for DQNstock_history.h5: the dataset file for DDPGtrain_set.csv: the training set separated from all_set.csv for visualization and correlation analysis.test_set.csv: the testing set separated from all_set.csv for visualization and correlation analysis.
stock_table: 19 stocks from different industry areas chose randomly.
train_set_corr.csv: correlation data table
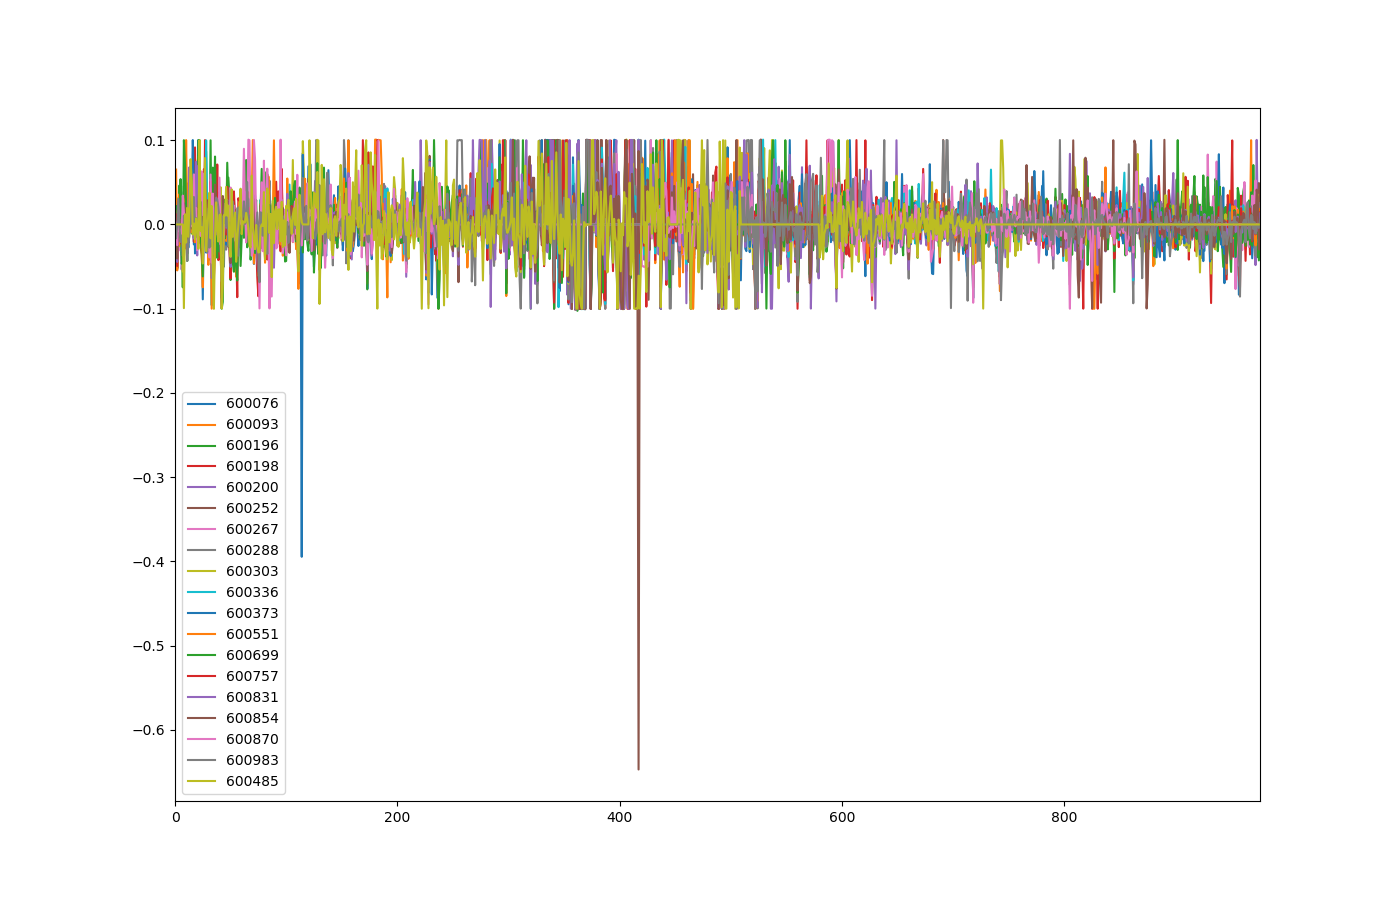
19_stock_pct.png: percentage(LastPx/PreClosePx) of every stock form 2014 to 2017
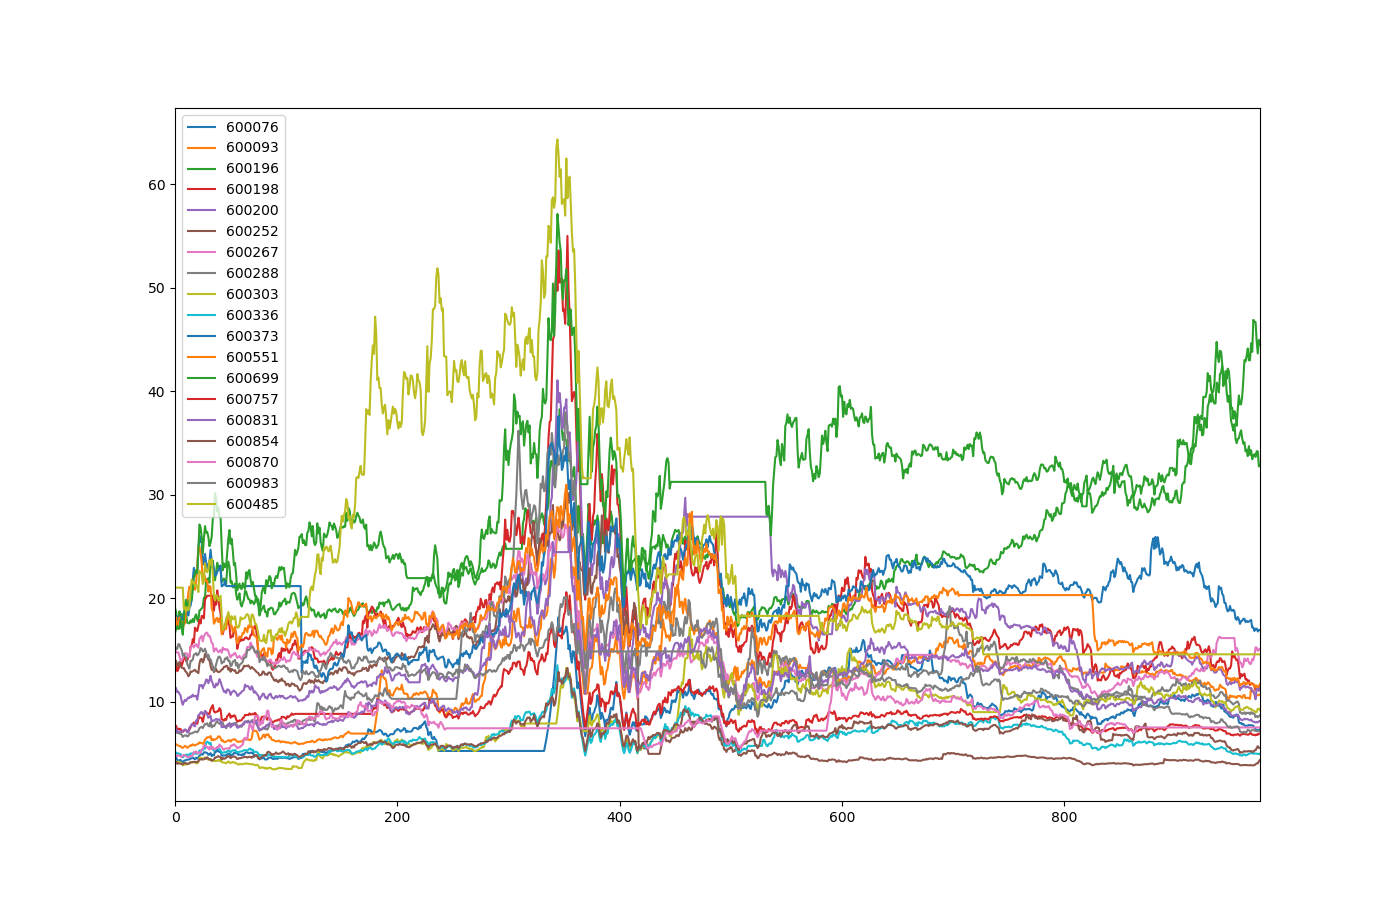
19_stock_raw.png: LastPx of every stock form 2014 to 2017
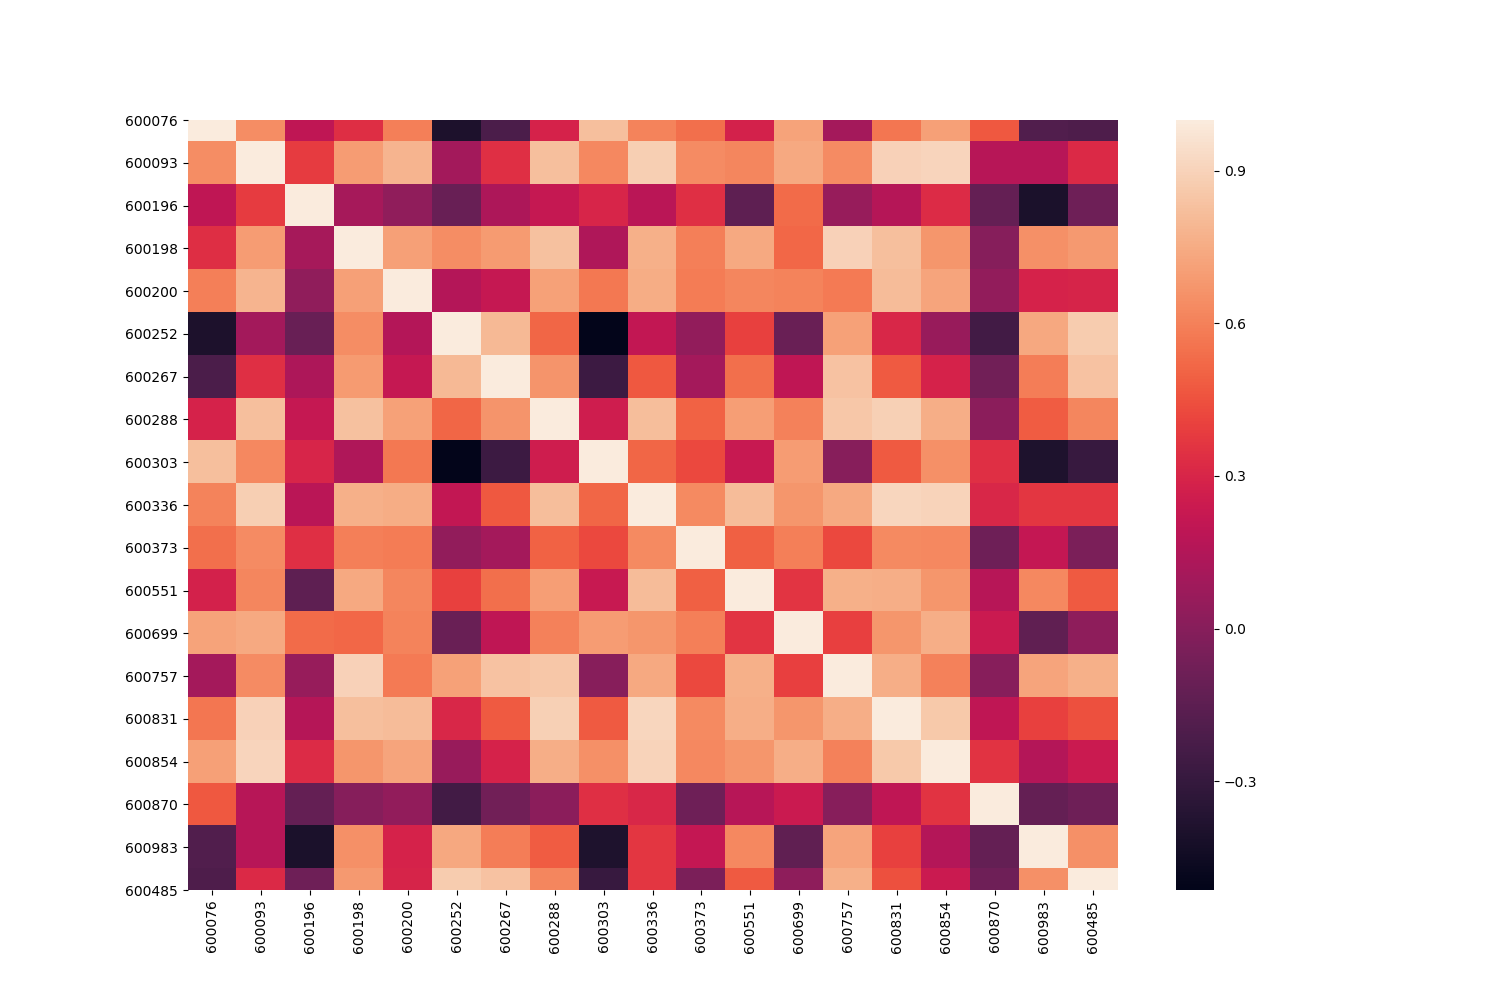
19_stock_heatmap.png: heatmap of 19 stocks which shows the correlation of every 2 stocks.
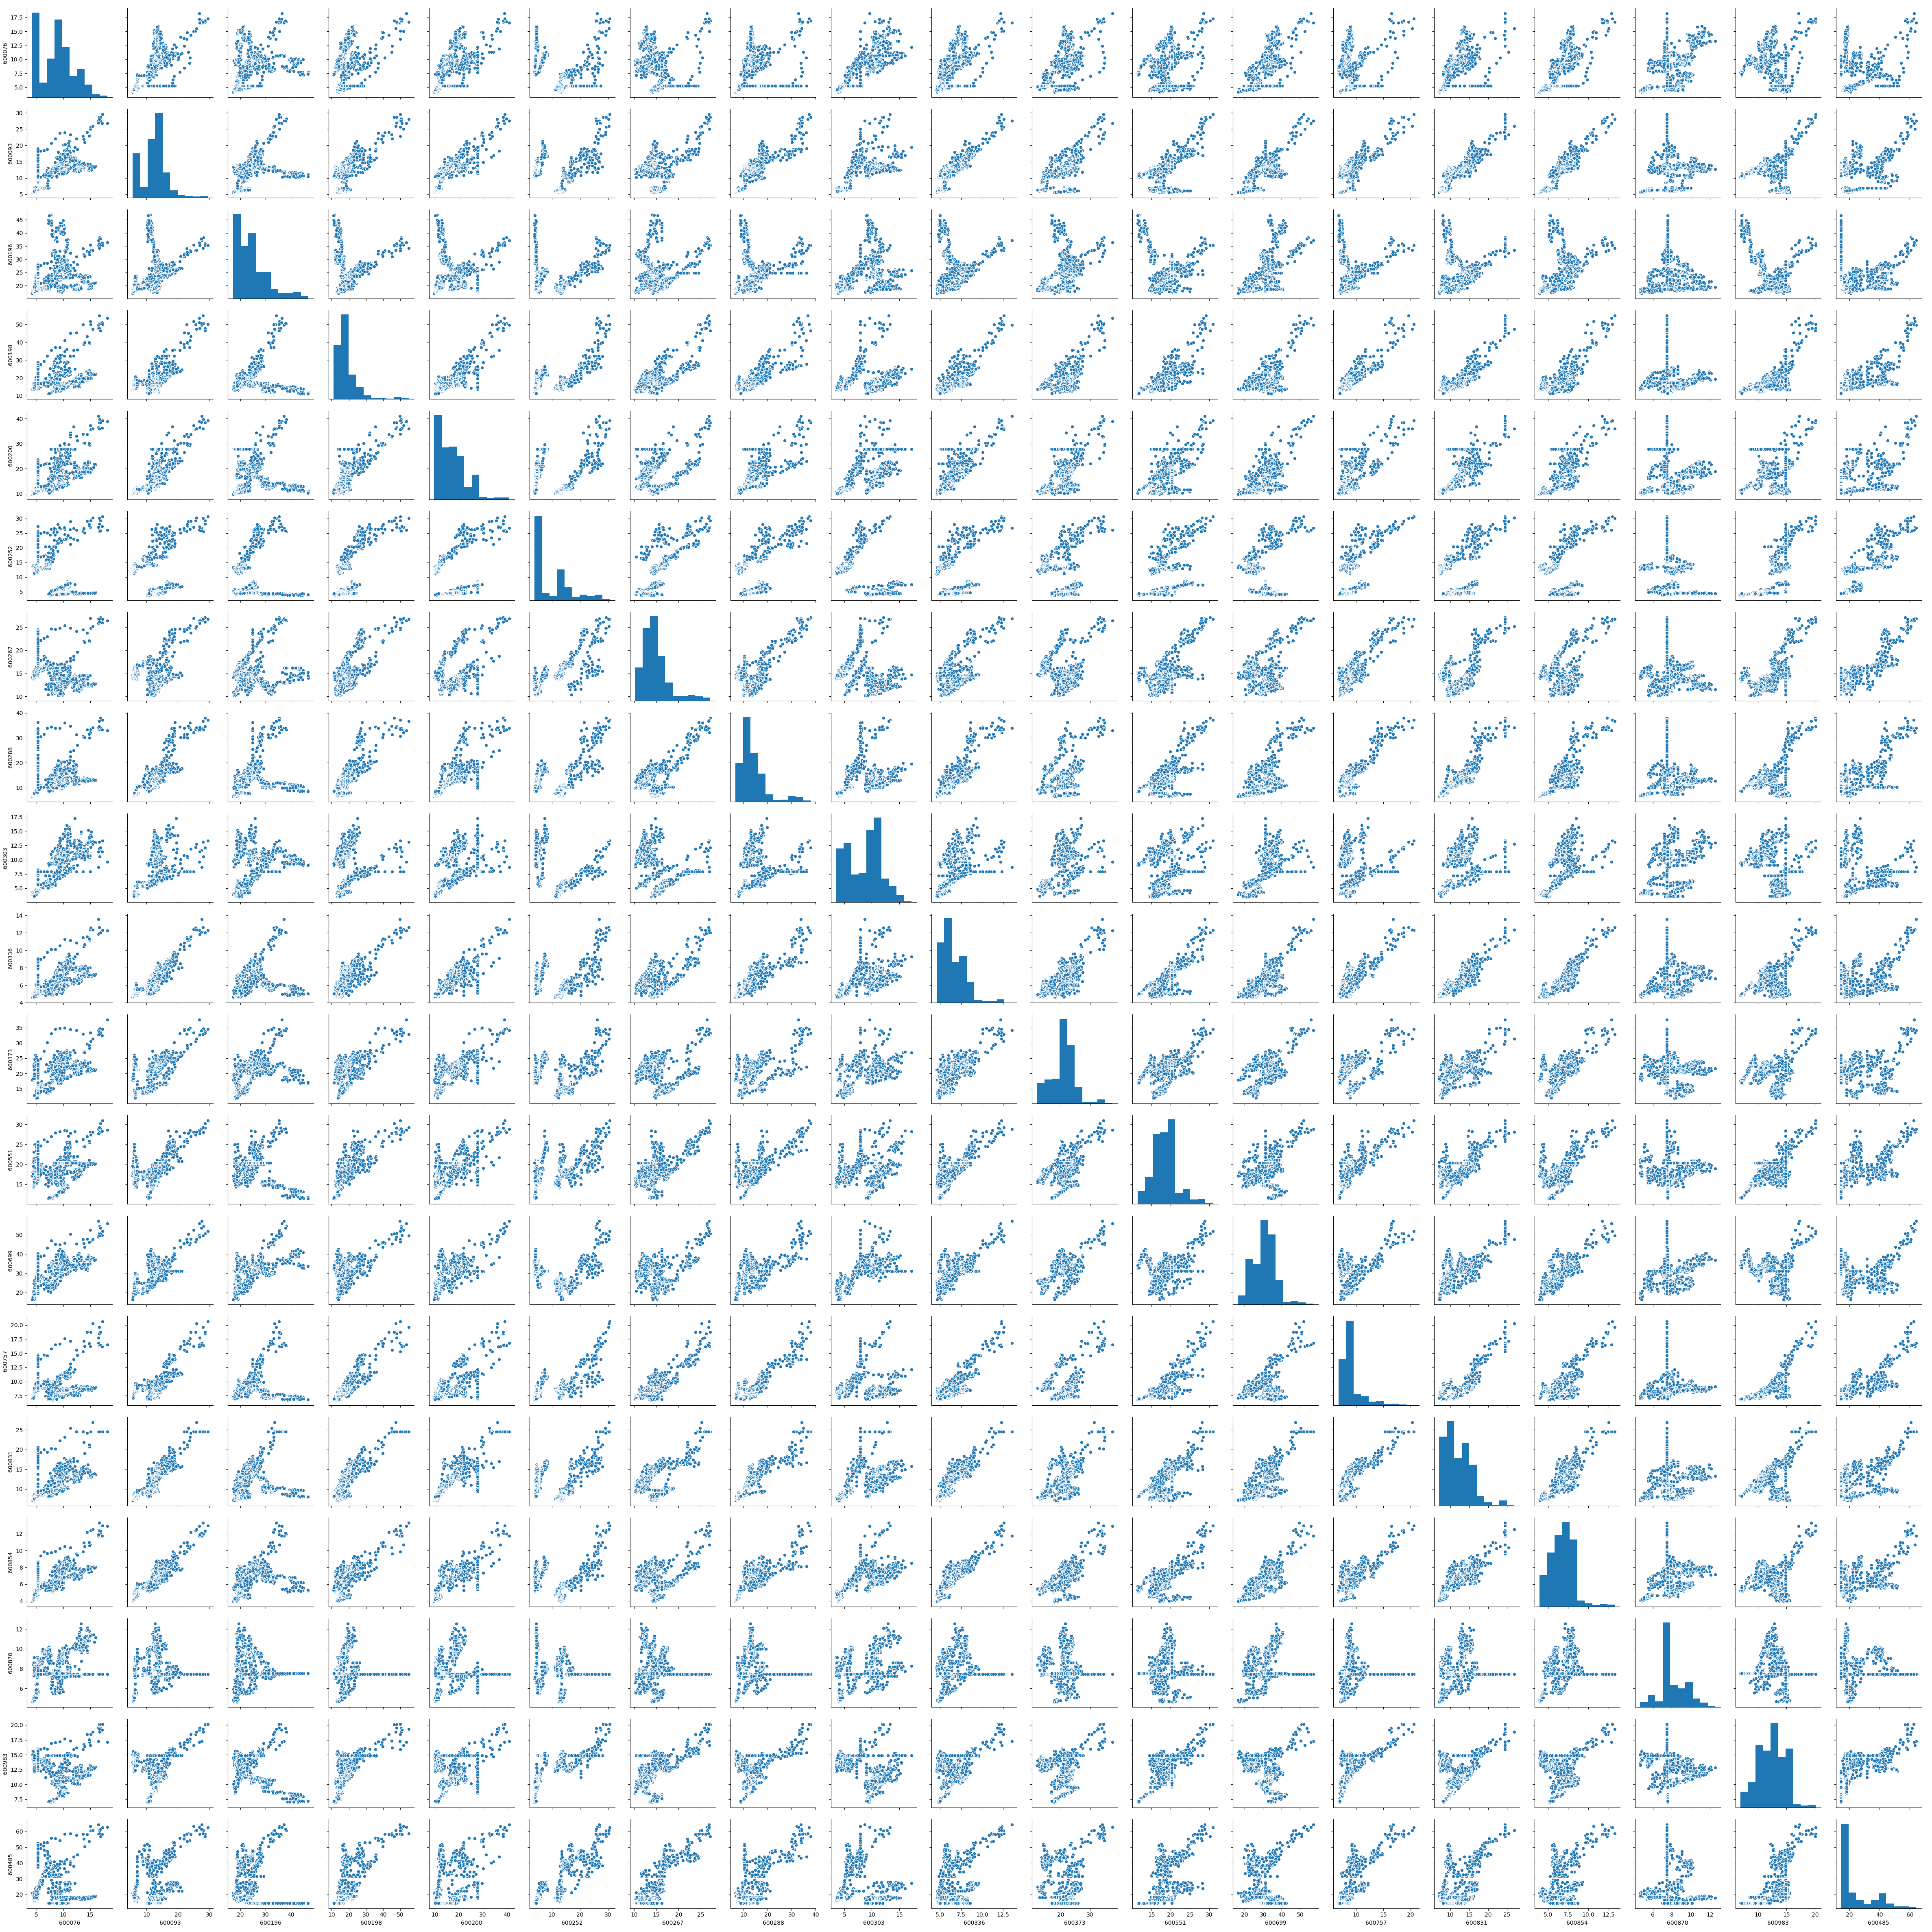
19_tock_pairplot.png: pairplot graph of 19 stocks which shows the correlation of every 2 stocks.
train_set.csv: LastPx (colse data) of 19 stocks form 2014-2017
test_set.csv: LastPx (colse data) of 19 stocks form 2017-2019
all_set.csv: LastPx (colse data) of 19 stocks form 2014-2019
stock_history.h5: open, close, high, low, volume of 19 stocks from 2014-2019


