Create ridgeline plots for grouped data over time
import pandas as pd
from ridgeline import ridgeline
import matplotlib.pyplot as plt
import matplotlib.dates as mdates
# Import data
df_raw = pd.read_csv('https://data.rivm.nl/covid-19/COVID-19_aantallen_gemeente_per_dag.csv',
sep=';',
parse_dates=['Date_of_publication'],
infer_datetime_format=True)
df_raw.columns= df_raw.columns.str.lower()
# Sum by province/date
df = df_raw.groupby(['date_of_publication', 'province']).sum().reset_index()
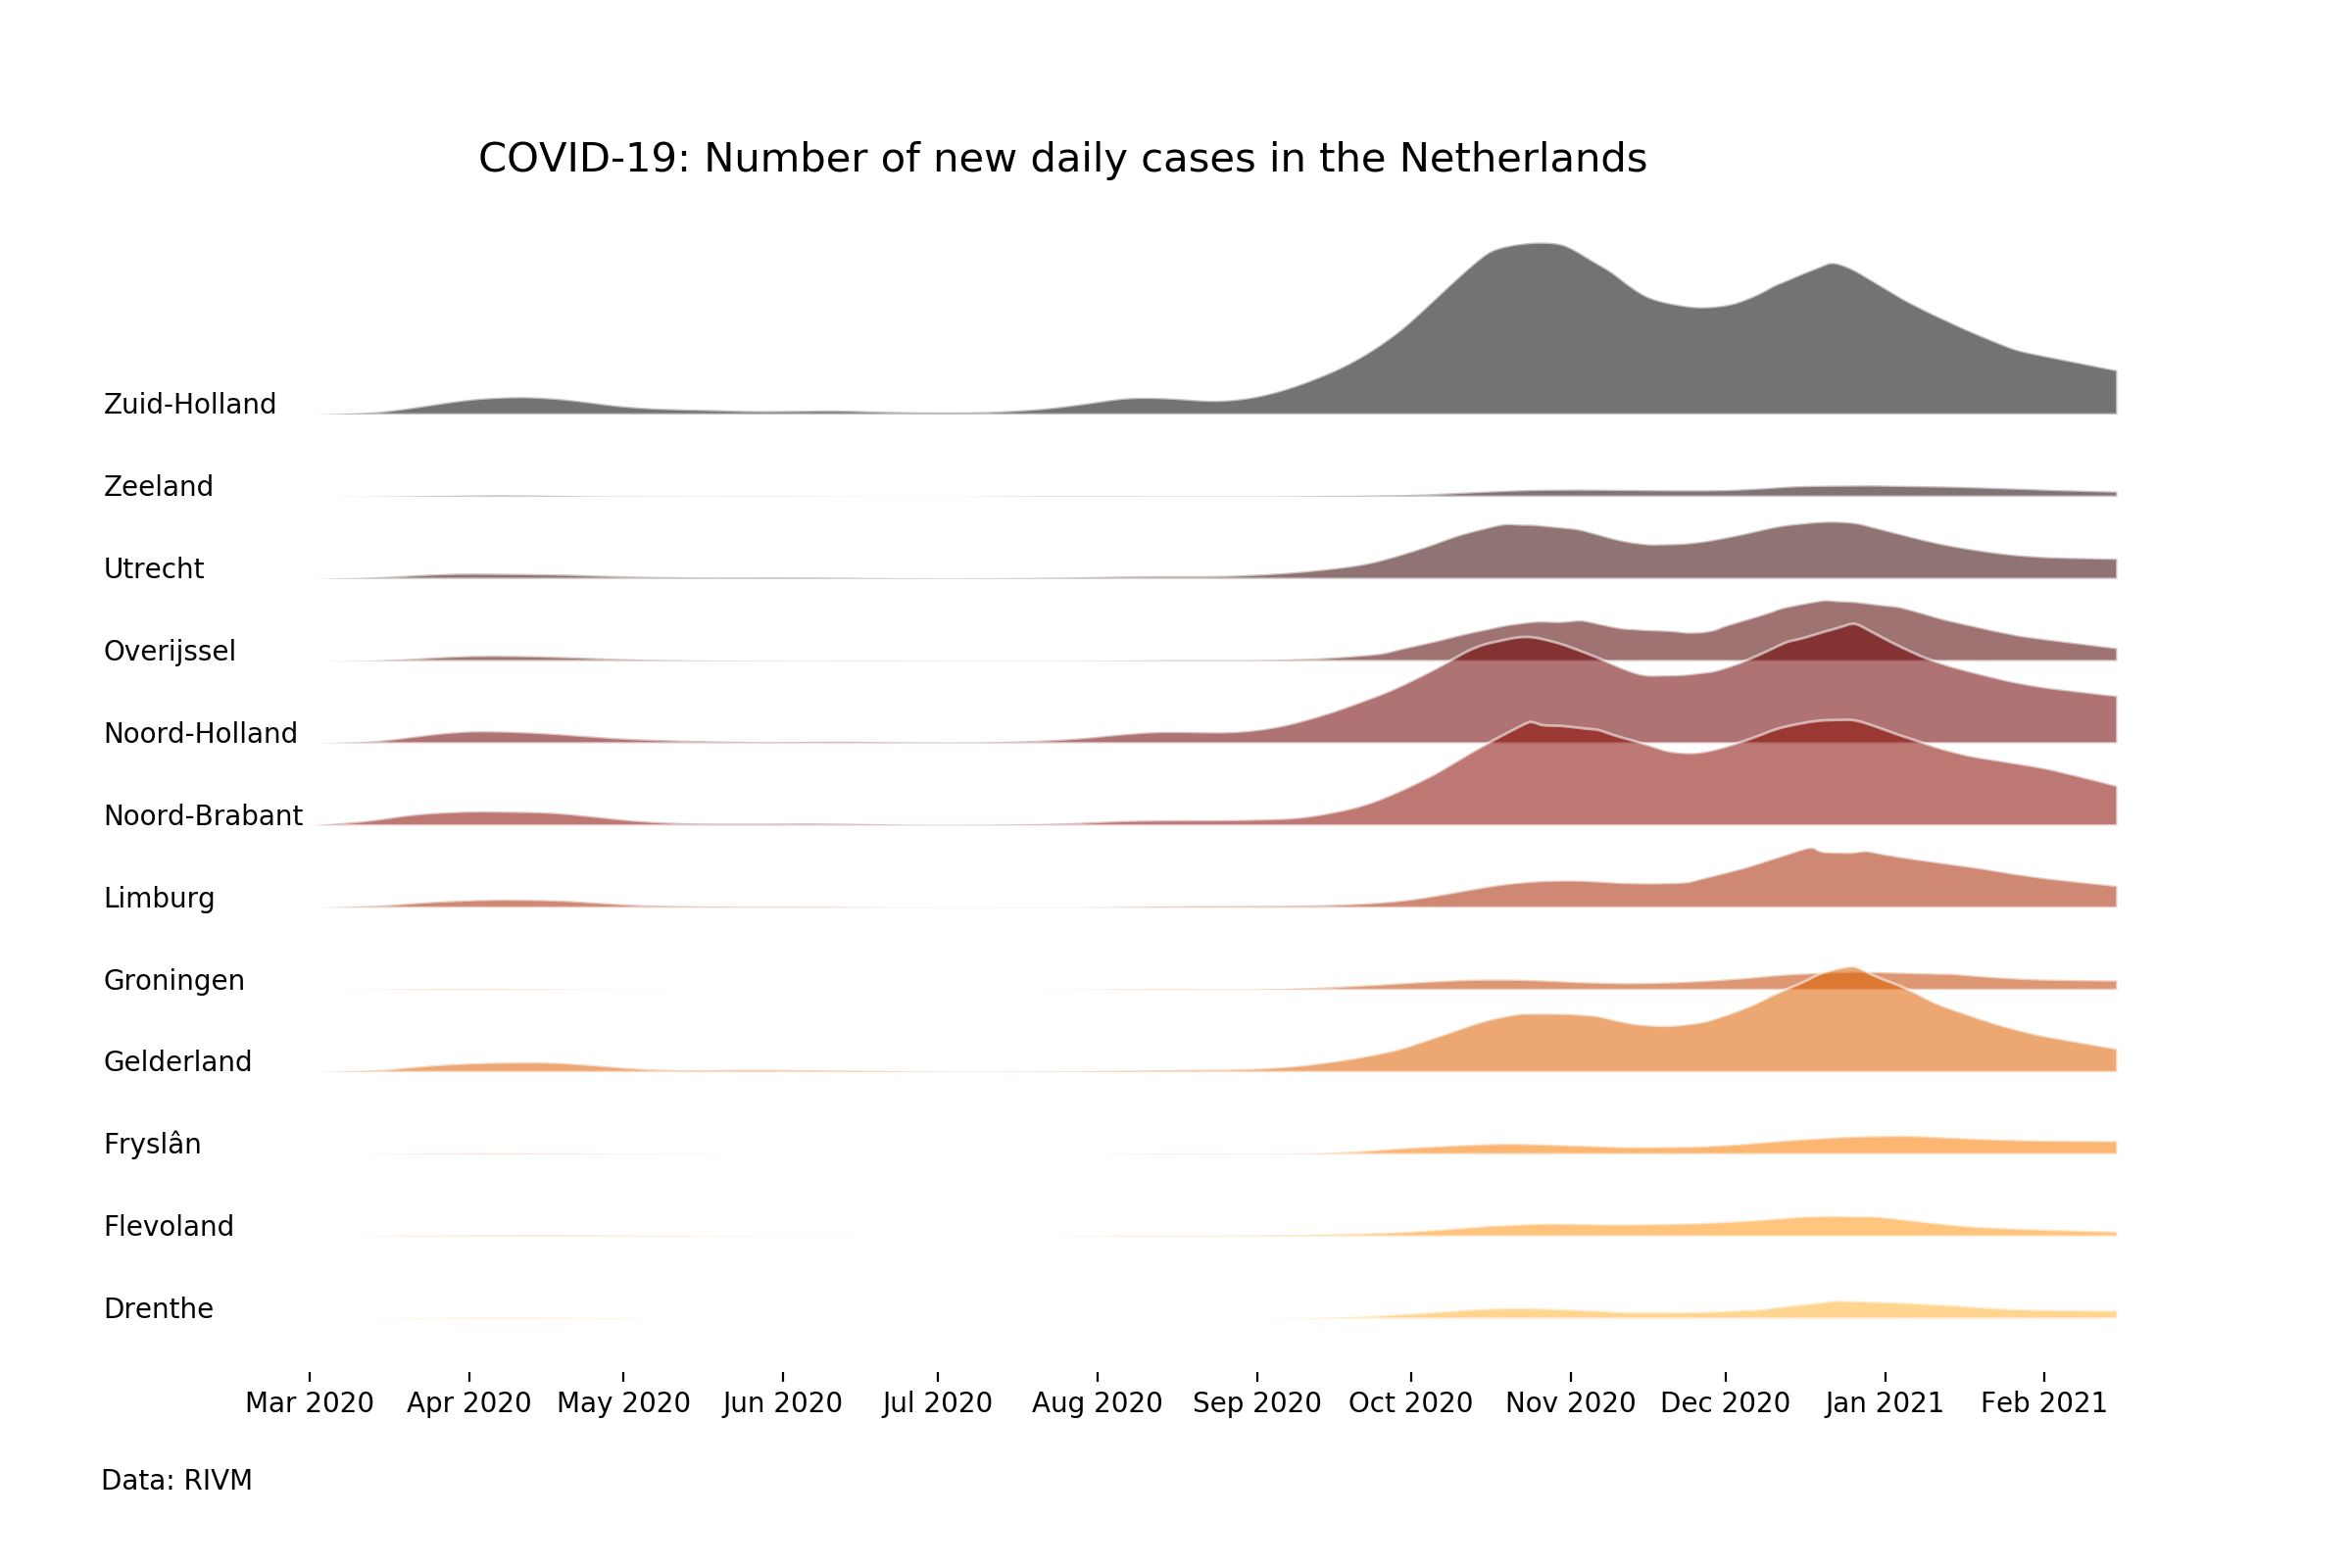
# Create ridgeline plot for daily cases
fig, ax = plt.subplots(figsize=(12,8))
ax = ridgeline(df,
ax=ax,
col_time='date_of_publication',
col_group='province',
col_value='total_reported',
norm='overall',
frac=.08,
scale=3,
colormap='afmhot',
alpha=.55,
linspace=(0,.6))
ax.xaxis.set_major_formatter(mdates.DateFormatter('%b %Y'))
ax.set_title("COVID-19: Number of new daily cases in the Netherlands ",
color='black',fontsize=15,fontweight='roman',loc='center')
fig.text(0.043, 0.05, "Data: RIVM")
plt.show()