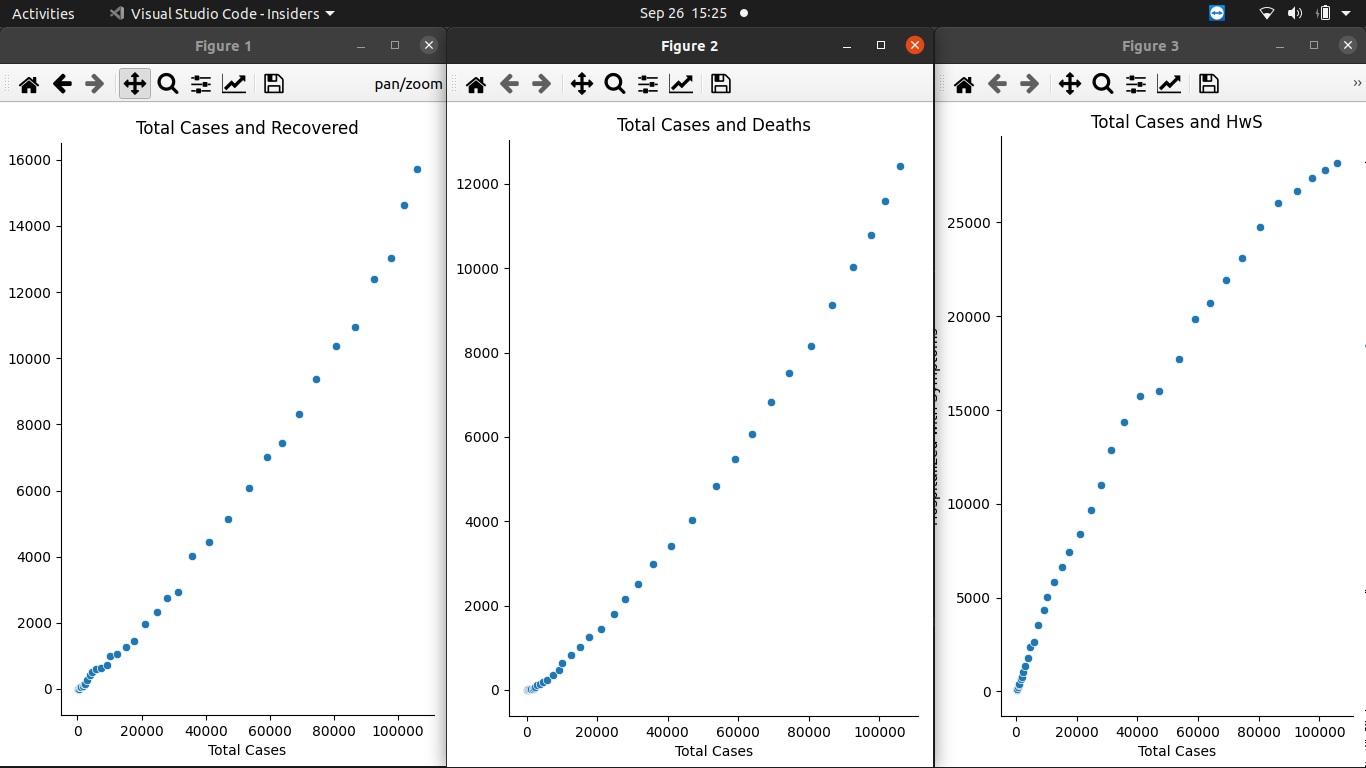
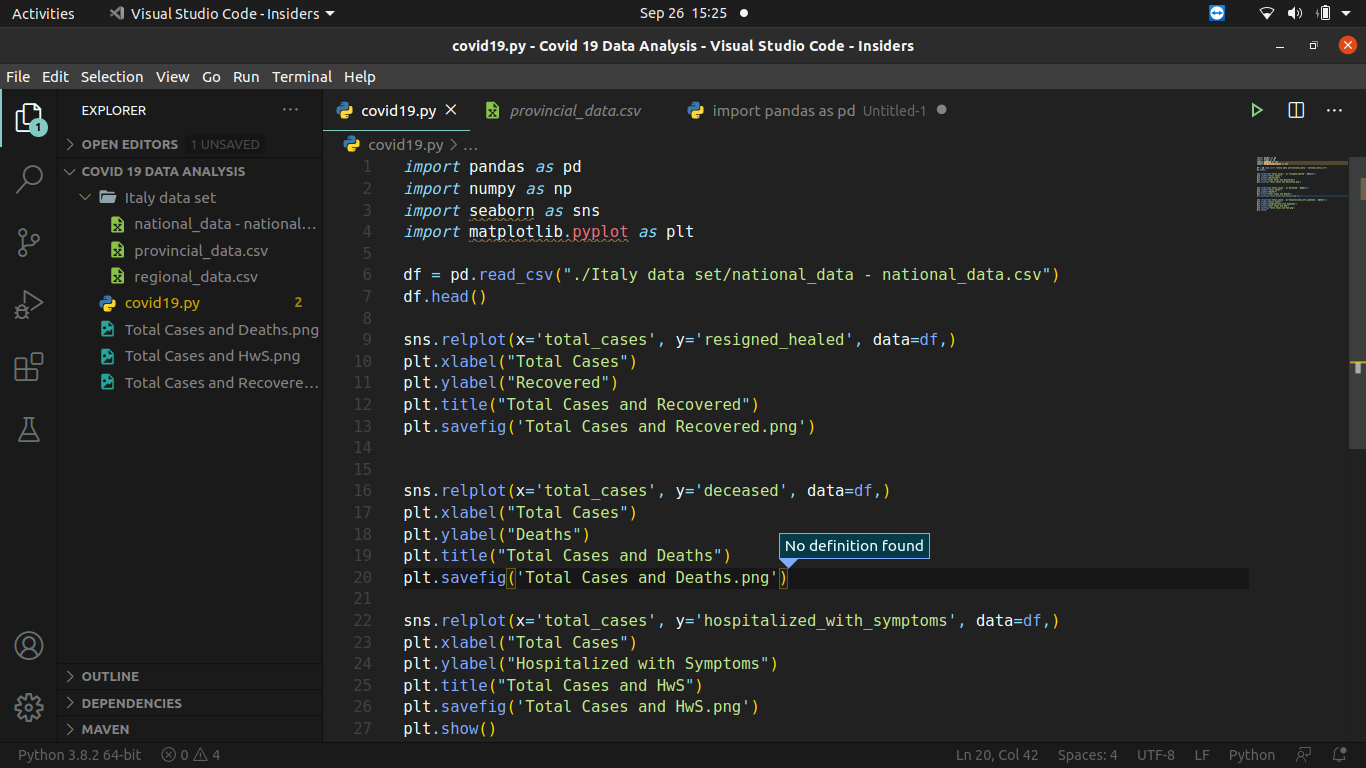
This program uses a dataset provided by Kaggle about the covid-19 data base in Italy and visualises the data into different rel plots using matplotlib library and seaborn library
Working
- The program open ups the data provide by Kaggle into a dataframe and reads it
- It then plot 3 different graphs one after the another
- 3 Diffrent graphs plotted between total Covid-19 cases, recovered patients, deaths and hospitalized with symptoms
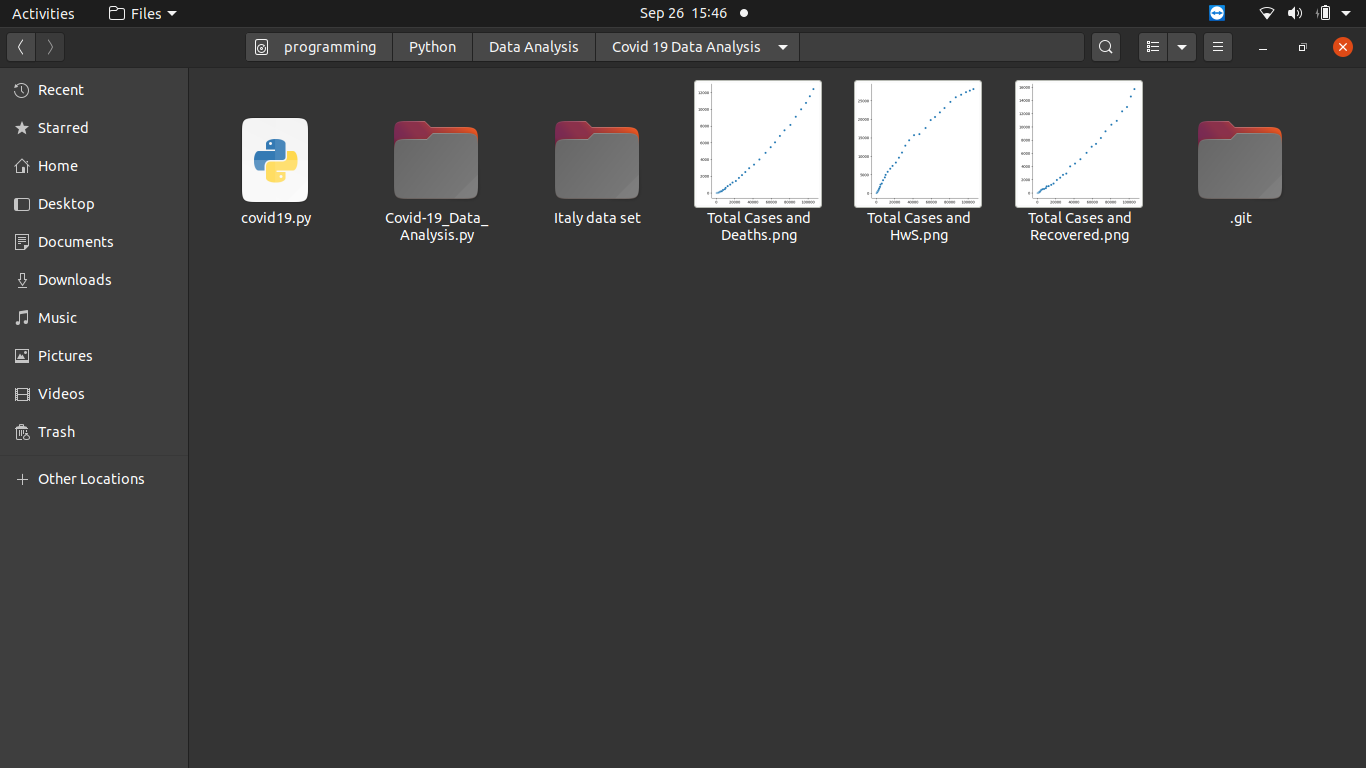
After execution the program stores the plotted graph in the destination folder as well

#Output

