Working with data can be challenging: it often doesn’t come in the best format for analysis, and understanding it well enough to extract insights requires both time and the skills to filter, aggregate, reshape, and visualize it. This session will equip you with the knowledge you need to effectively use pandas – a powerful library for data analysis in Python – to make this process easier.
Pandas makes it possible to work with tabular data and perform all parts of the analysis from collection and manipulation through aggregation and visualization. While most of this session focuses on pandas, during our discussion of visualization, we will also introduce at a high level Matplotlib (the library that pandas uses for its visualization features, which when used directly makes it possible to create custom layouts, add annotations, etc.) and Seaborn (another plotting library, which features additional plot types and the ability to visualize long-format data).
This is an introductory workshop on pandas first delivered at ODSC Europe 2021 and subsequently at the 5th Annual Toronto Machine Learning Summit in 2021 and PyCon US 2022. It's divided into the following sections:
We will begin by introducing the Series, DataFrame, and Index classes, which are the basic building blocks of the pandas library, and showing how to work with them. By the end of this section, you will be able to create DataFrames and perform operations on them to inspect and filter the data.
To prepare our data for analysis, we need to perform data wrangling. In this section, we will learn how to clean and reformat data (e.g., renaming columns and fixing data type mismatches), restructure/reshape it, and enrich it (e.g., discretizing columns, calculating aggregations, and combining data sources).
The human brain excels at finding patterns in visual representations of the data; so in this section, we will learn how to visualize data using pandas along with the Matplotlib and Seaborn libraries for additional features. We will create a variety of visualizations that will help us better understand our data.
We will practice all that you’ve learned in a hands-on lab. This section features a set of analysis tasks that provide opportunities to apply the material from the previous sections.
You should have basic knowledge of Python and be comfortable working in Jupyter Notebooks. Check out this notebook for a crash course in Python or work through the official Python tutorial for a more formal introduction. The environment we will use for this workshop comes with JupyterLab, which is pretty intuitive, but be sure to familiarize yourself using notebooks in JupyterLab and additional functionality in JupyterLab.
-
Install Python >= version 3.8.0 and <= version 3.10.2 OR install Anaconda/Miniconda. Note that Anaconda/Miniconda is recommended if you are working on a Windows machine and are not very comfortable with the command line. Alternatively, you can use this Binder environment if you don't want to install anything on your machine.
-
Fork this repository:
-
Clone your forked repository:
-
Create and activate a Python virtual environment:
-
If you installed Anaconda/Miniconda, use
conda(on Windows, these commands should be run in Anaconda Prompt):$ cd pandas-workshop ~/pandas-workshop$ conda env create --file environment.yml ~/pandas-workshop$ conda activate pandas_workshop (pandas_workshop) ~/pandas-workshop$
-
Otherwise, use
venv:$ cd pandas-workshop ~/pandas-workshop$ python3 -m venv pandas_workshop ~/pandas-workshop$ source pandas_workshop/bin/activate (pandas_workshop) ~/pandas-workshop$ pip3 install -r requirements.txt
-
-
Launch JupyterLab:
(pandas_workshop) ~/pandas-workshop$ jupyter lab -
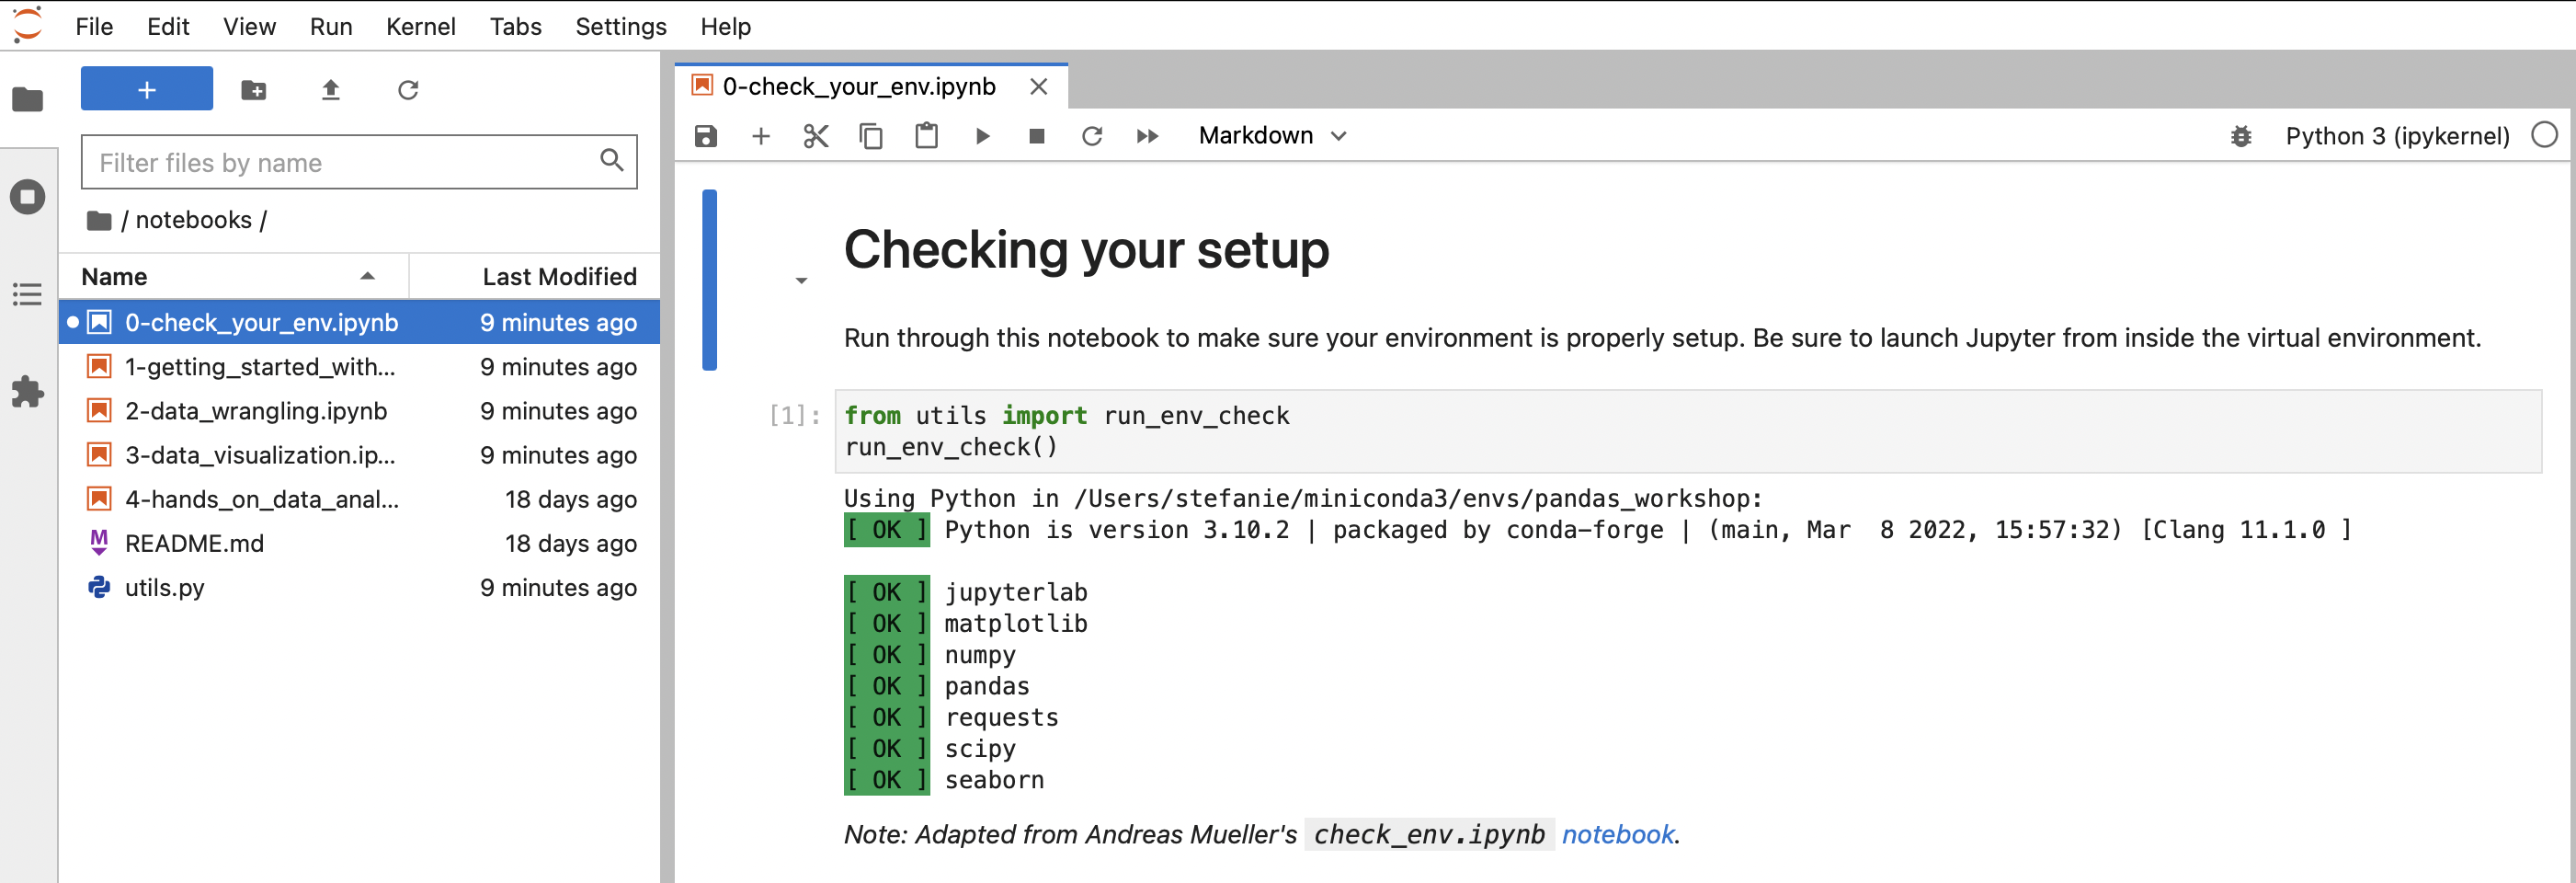
Navigate to the
0-check_your_env.ipynbnotebook in thenotebooks/folder: -
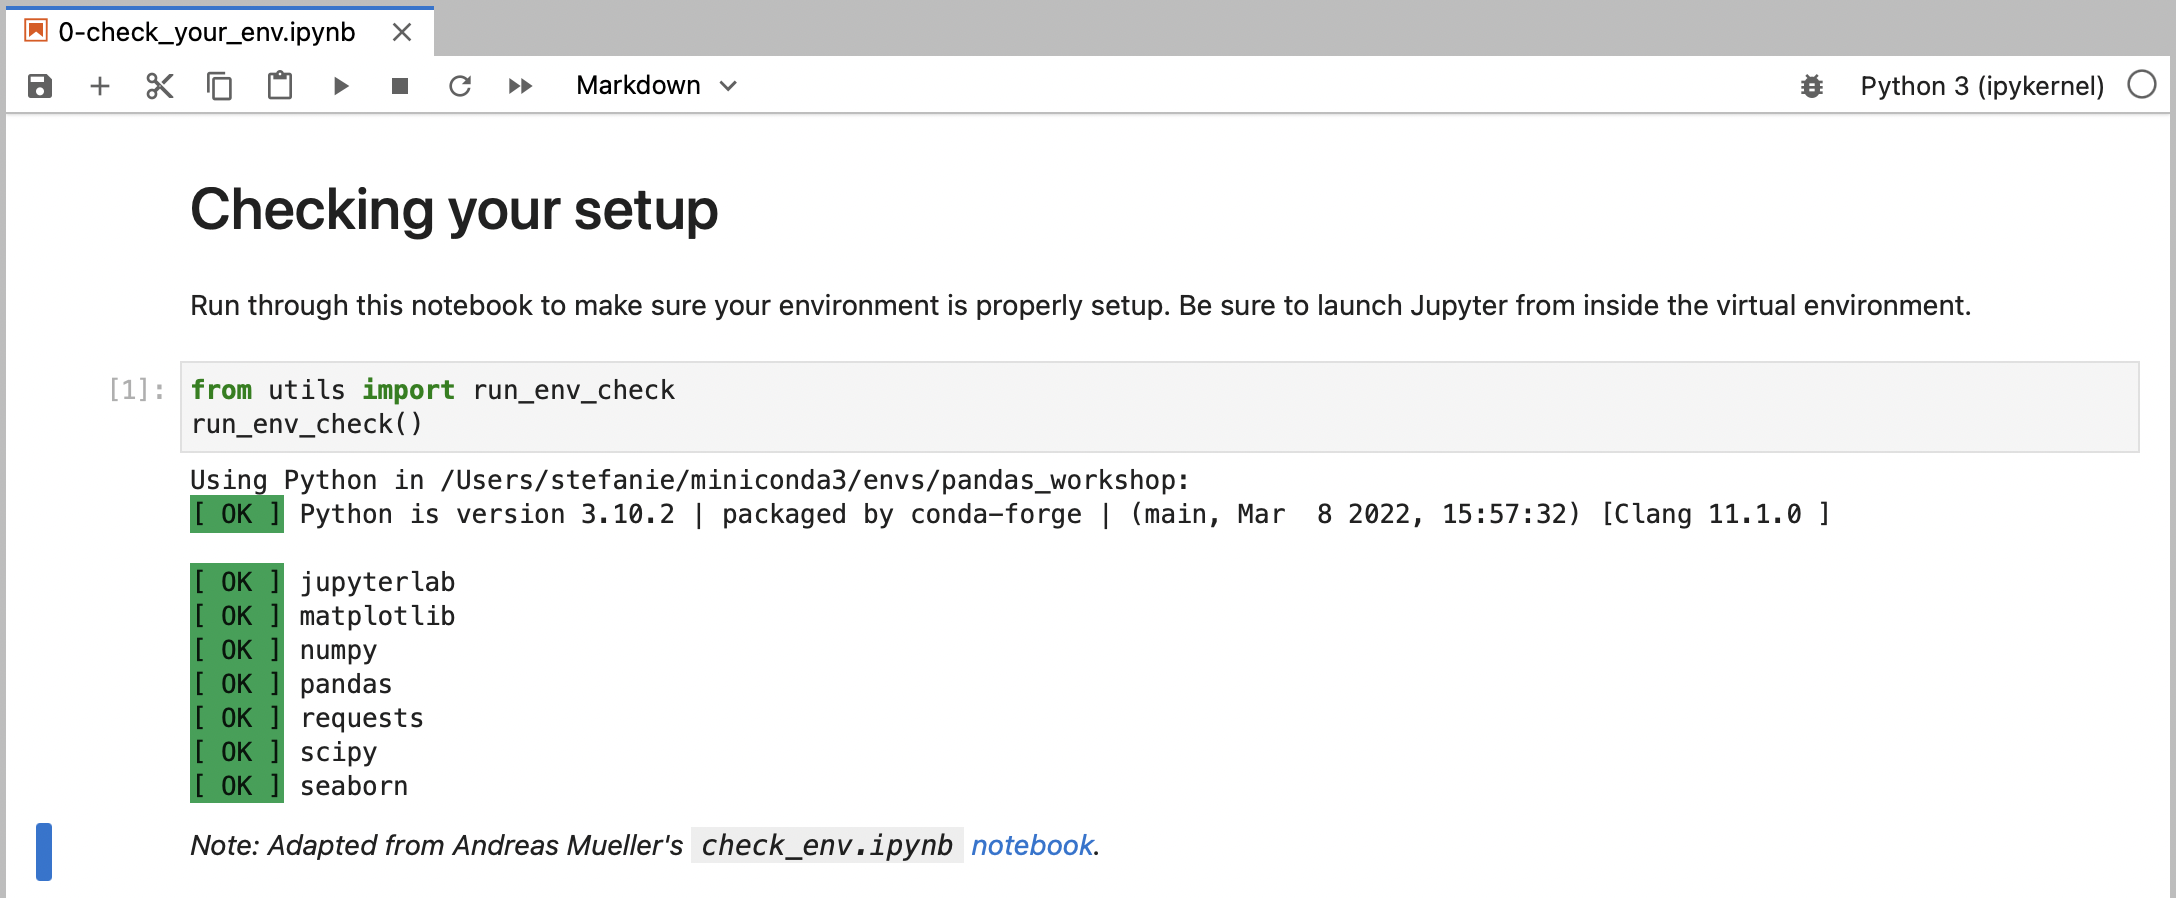
Run the notebook to confirm everything is set up properly:
Stefanie Molin (@stefmolin) is a software engineer and data scientist at Bloomberg in New York City, where she tackles tough problems in information security, particularly those revolving around data wrangling/visualization, building tools for gathering data, and knowledge sharing. She is also the author of Hands-On Data Analysis with Pandas, which is currently in its second edition. She holds a bachelor’s of science degree in operations research from Columbia University's Fu Foundation School of Engineering and Applied Science. She is currently pursuing a master’s degree in computer science, with a specialization in machine learning, from Georgia Tech. In her free time, she enjoys traveling the world, inventing new recipes, and learning new languages spoken among both people and computers.
All examples herein were developed exclusively for this workshop. Hands-On Data Analysis with Pandas contains additional examples and exercises, as does this blog post. For a deeper dive into data visualization in Python, check out my Beyond the Basics: Data Visualization in Python workshop.


