by Jonas Hartmann, Gilmour group, EMBL Heidelberg
Info:
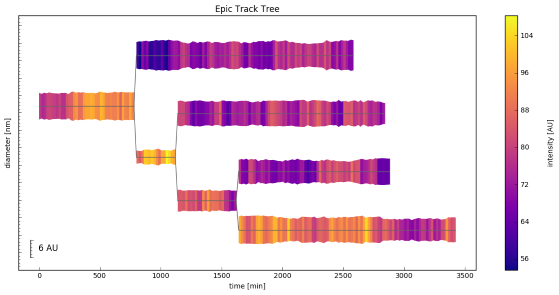
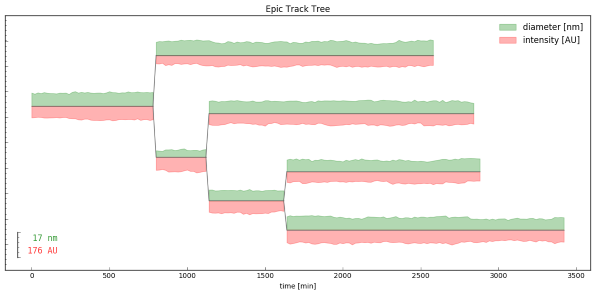
This pipeline reads time course data of a tracked object that divides into multiple objects over time (for example a cell as observed with a fluorescence microscope and tracked by image analysis) and plots the track data as a tree, visualizing measurements as an outline and/or through coloring.
See About section in track_tree.ipynb for more information!
Example 1: Tree with outline and color to represent track measurements
Example 2: Example tree with two outlines to represent track measurements

