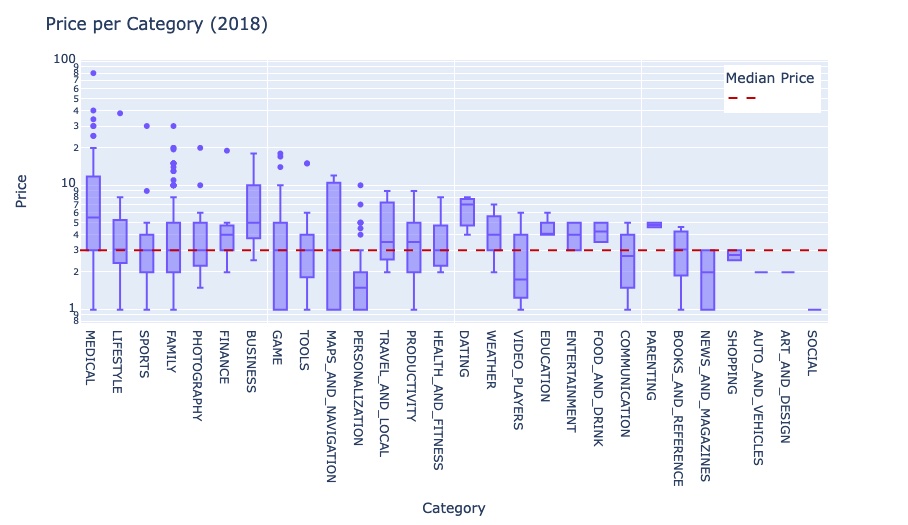
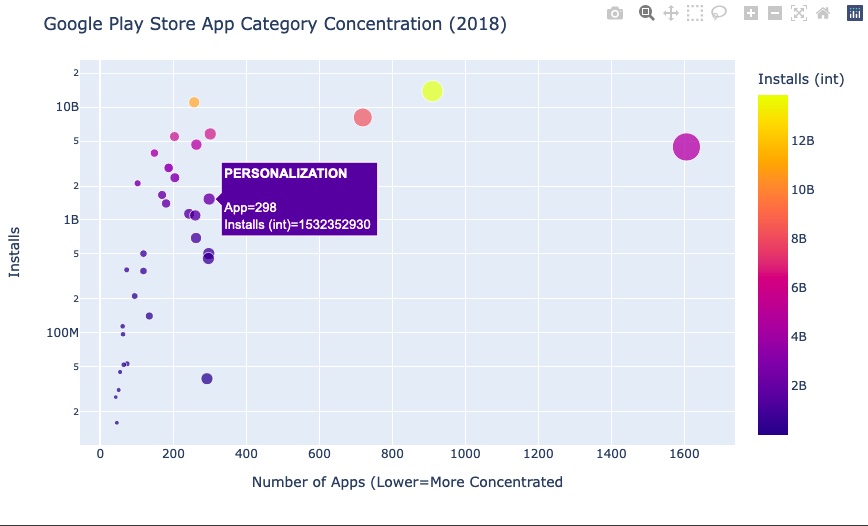
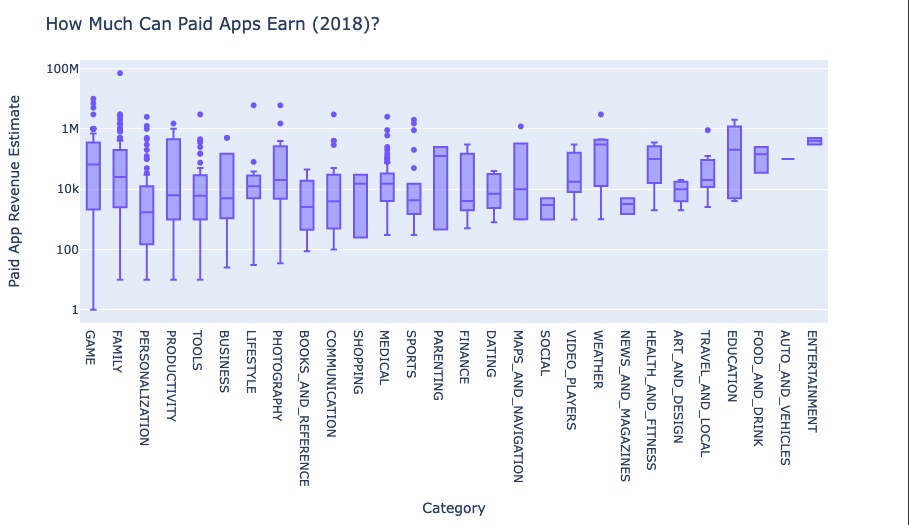
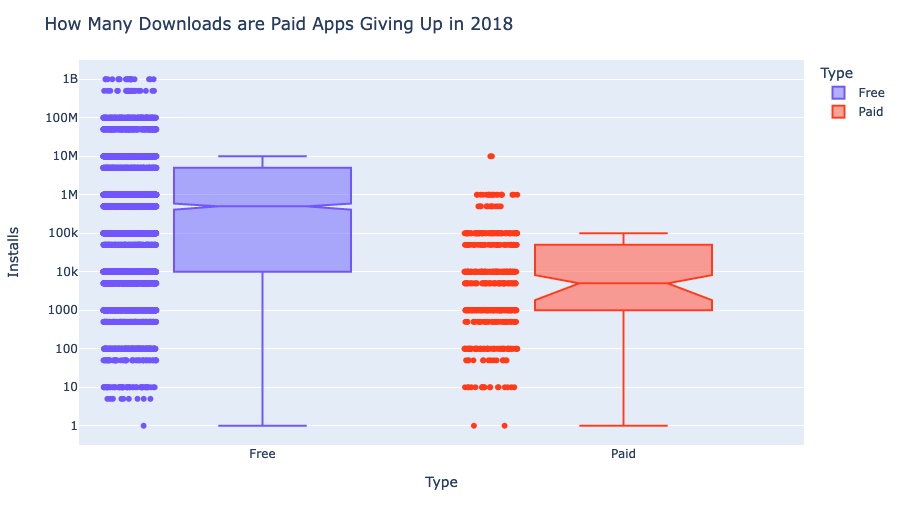
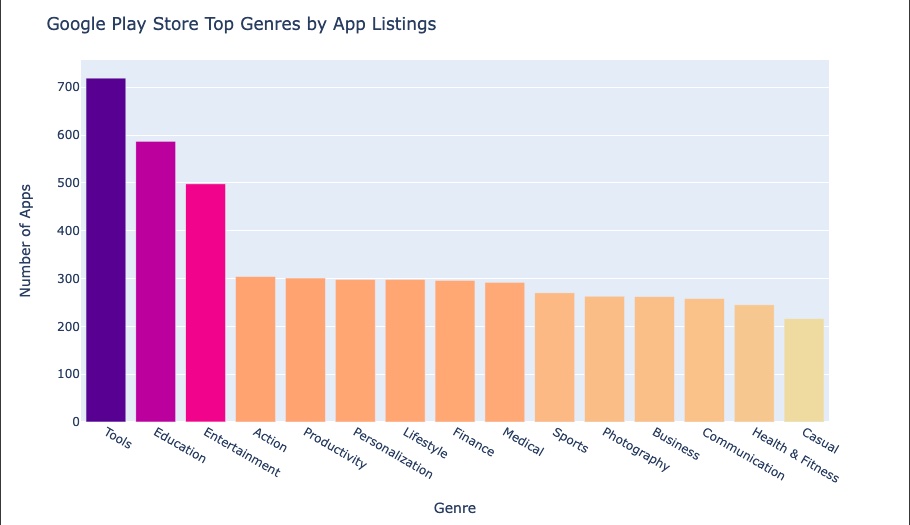
Compare thousands of apps in the Google Play Store with Colab Notebooks, Pandas and Plotly Express.
- 👋 Hi, I’m @WilliamSpanfelner
- 👀 I’m interested in using Python with Swift in iOS environments and why it may or may not be desirable.
- 🌱 I’m currently learning Python with the London App Brewery and Angela Yu's 100 Days of Code: The Complete Python Pro Bootcamp for 2022 on Udemy.
- 🧑💻 Delve into Google Play Store mobile apps market data. Slice and dice data and create different chart types to make sense of it all. Python and Colab/Jupyter notebooks lends tremendous versatility in presenting and digesting the data. Will your next app be paid or free?
- 💞️ I’m looking to collaborate on application development.
- 📫 How to reach me...
