A script to interpret csv files provided by HSBC to a matplotlib graph and save it to a .png image file.
Simply download a .csv from your HSBC account page on HSBC.co.uk, place it in the /data folder with the name account_data.csv and run the application and it will provide you with a graph of your balance over time.
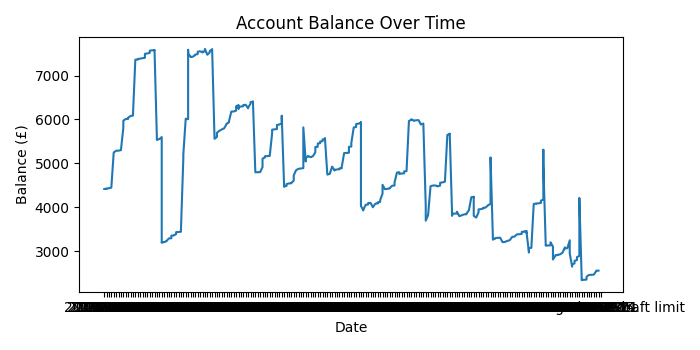
Here is an example of the output: