DataWhale matplotlib 学习记录
一、Matplotlib 初相识
1. 认识matplotlib
Matplotlib是一个Python 2D绘图库,能够以多种硬拷贝格式和跨平台的交互式环境生成出版物质量的图形,用来绘制各种静态,动态,交互式的图表。
我们所熟知的pandas和seaborn的绘图接口其实也是基于matplotlib所作的高级封装。
2.一个简单的绘图

Code
import matplotlib.pyplot as plt
import matplotlib as mpl
import numpy as np
fig, ax = plt.subplots() #创建一个包含一个axes的figure
ax.plot([1, 2, 3, 4], [1, 4, 2, 3]) #绘制图像
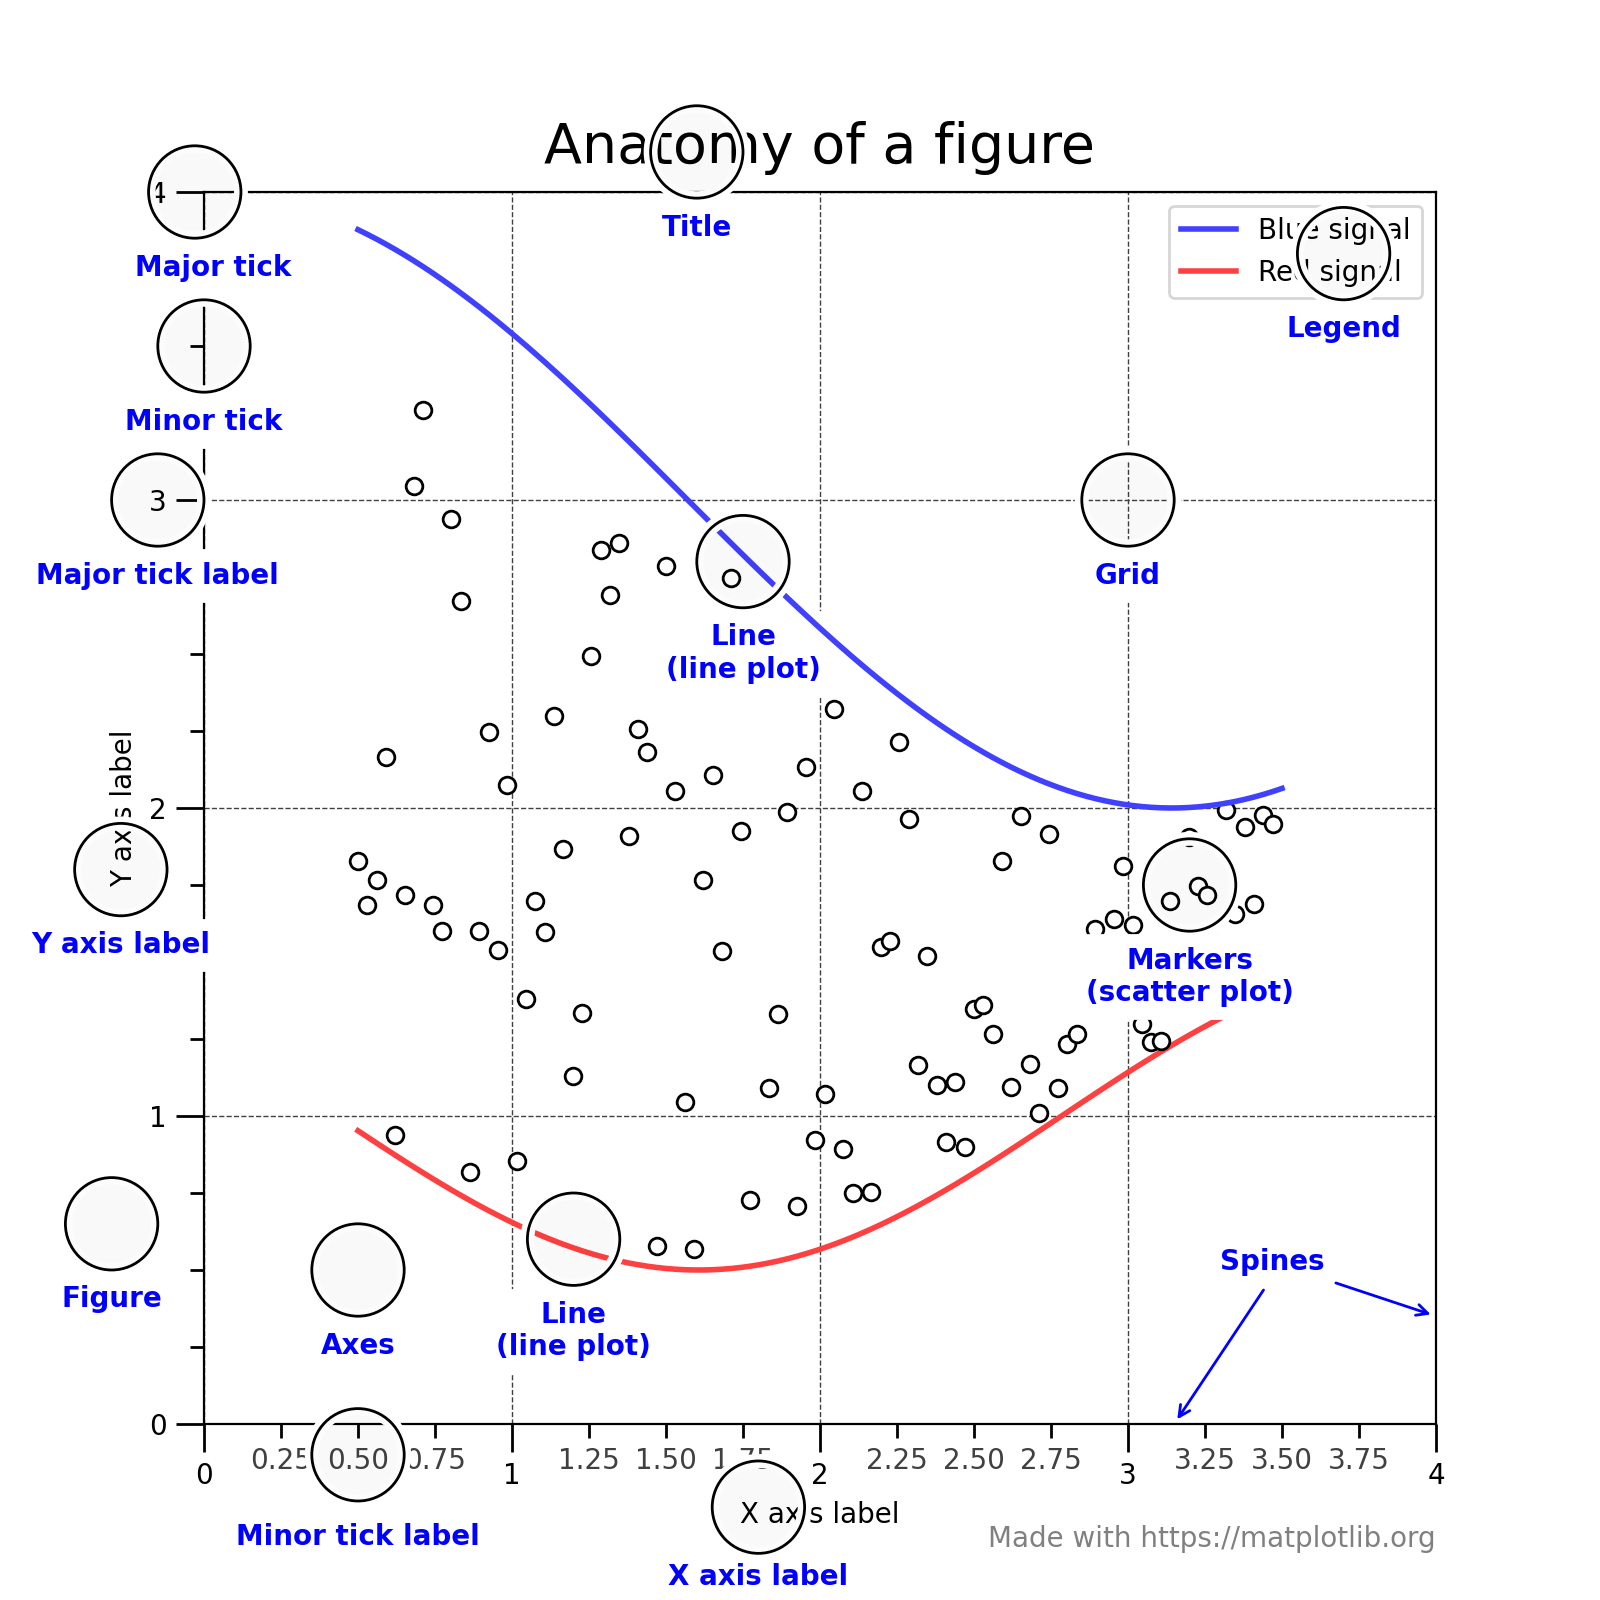
plt.show() #显示图像3.Figure的组成
完整的matplotlib图像通常会包含以下四个层级,每个层级也叫container(容器)
- Figure: 顶层级别,用来容纳==所有==的绘图元素
- Axes: matplotlib的==核心==,容纳了大量元素来构造一幅幅子图,一个 figure可以由==多个或一个==子图组成
- Axis: axes的下属层级,用于处理所有和==坐标轴,网格==有关的元素
- Tick: axis的下属层级,用来处理所有与==刻度==有关的元素
4.两种绘图接口

Code_1
import matplotlib.pyplot as plt
import matplotlib as mpl
import numpy as np

x = np.linspace(0, 2, 100)
#作为序列生成器, numpy.linspace()函数用于在线性空间中以均匀步长生成数字序列。
#array = numpy.linspace(start, end, num=num_points)将在start和end之间生成一个统一的序列,共有num_points个元素。
#num_points更大,曲线更顺滑

fig, ax = plt.subplots()
#创建子图plt.subplots(nrows, ncols)
#在一个界面内以网格布局,展示多个函数图像,以二维数组一样的位置,设置该处的内容

ax.plot(x, x, label = 'linear')
ax.plot(x, x**2, label = 'quadratic')
ax.plot(x, x**3, label = 'cubic')

ax.set_xlabel('x label')
ax.set_ylabel('y label')
ax.set_title('Simple Plot')

ax.legend()  #用于给图像加图例
#图例是集中于地图一角或一侧的地图上各种符号和颜色所代表内容与指标的说明,有助于更好的认识地图。

plt.show()
Code_2
import matplotlib.pyplot as plt
import matplotlib as mpl
import numpy as np

x = np.linspace(0, 2, 100)

plt.plot(x, x, label = 'linear')
plt.plot(x, x**2, label = 'quadratic')
plt.plot(x, x**3, label = 'cubic')

plt.xlabel('x label')
plt.ylabel('y label')
plt.title('Simple Plot')

plt.legend()
plt.show()
关于更多matplotlib.pyplot.subplots(nrows, ncols)使用请点击参见
Matplotlib subplots()函数 - Matplotlib教程™ (yiibai.com)
link:https://www.yiibai.com/matplotlib/matplotlib_subplots_function.html
关于更多的matplotlib.pyplot.legend(*args, **kwargs)使用请点击参见:matplotlib中plt.legend等的使用方法 - Rogn - 博客园 (cnblogs.com)
5.通用绘图模板

Code
import matplotlib.pyplot as plt
import matplotlib as mpl
import numpy as np

#step1 准备数据
x = np.linspace(0, 2, 100)
y = x**2

#step2 设置绘图样式
mpl.rc('lines', linewidth = 4, linestyle = '-.')

#stpe3 定义布局
fig, ax = plt.subplots()

#step4 绘制图像
ax.plot(x, y, label = 'linear')

#step5 添加标签,文字和图例
ax.set_xlabel('x label')
ax.set_ylabel('y label')
ax.set_title('Simple Plot Template')
ax.legend()
plt.show()
6.思考题
- 请思考两种绘图模式的优缺点和各自适合的使用场景
- 在第五节绘图模板中我们是以OO模式作为例子展示的,请思考并写一个pyplot绘图模式的简单模板
OO-style代码更复杂,但更适用于复杂图像
而pyplot绘图可以使得代码更简洁,但只适合与简单的图像
import matplotlib.pyplot as plt
import matplotlib as mpl
import numpy as np

#step1 准备数据
x = np.linspace(0, 2, 100)
y = x**2

#step2 设置绘图样式
mpl.rc('lines', linewidth = 4, linestyle = '-.')

#step3 绘制图像
plt.plot(x, y, label = 'linear')

#step4 添加标签,文字和图例
plt.xlabel('x label')
plt.ylabel('y label')
plt.title('Simple Plot Template')
plt.legend()
plt.show()