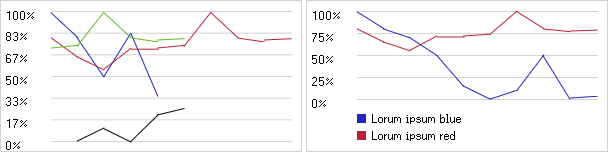
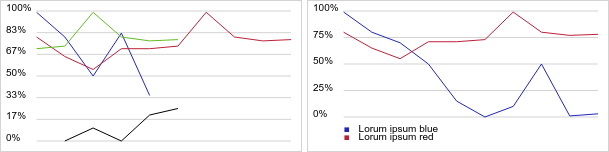
Charts working in SerenityOS Browser/Ladybird
<script src="canvas-chart.js"></script>
<script>
    drawGraph({type: "line", range: "percentage", steps: 7, fontSize: 10, fontFamily: "Arial", showLabel: false, padding: 10, elementId: "myCanvas"}, [
        {config: {color: "#2026bc", label: "Lorum ipsum blue"}, data: [99, 80, 50, 83, 35]},
        {config: {color: "#bc2038", label: "Lorum ipsum red", style: "dotted"}, data: [80, 65, 55, 71, 71, 73, 99, 80, 77, 78]},
        {config: {color: "#62bc20", label: "Lorum ipsum green", style: "dashed"}, data: [71, 73, 99, 80, 77, 78]},
        {config: {color: "#000000", label: "Lorum ipsum black", style: "solid"}, data: [null, 0, 10, 0, 20, 25]}
    ]);

    drawGraph({type: "line", range: "percentage", steps: 5, showLabel: true, elementId: "myCanvas2"}, [
        {config: {color: "#2026bc", label: "Lorum ipsum blue"}, data: [99, 80, 70, 50, 15, 0, 10, 50, 1, 3]},
        {config: {color: "#bc2038", label: "Lorum ipsum red"}, data: [80, 65, 55, 71, 71, 73, 99, 80, 77, 78]},
    ]);
</script>