  ____    _____   ____    _____   _____    ___     ___    _
 |  _ \  | ____| |  _ \  |  ___| |_   _|  / _ \   / _ \  | |
 | |_) | |  _|   | |_) | | |_      | |   | | | | | | | | | |
 |  __/  | |___  |  _ <  |  _|     | |   | |_| | | |_| | | |___
 |_|     |_____| |_| \_\ |_|       |_|    \___/   \___/  |_____|
The perftool module helps Analyse the performance of command line execution.
The goal of the perftool module is to allow you to understand the performance of any command line execution, it is compactable with Python 2 and 3.
It is designed to be used as follows:::
# Interactive console
python perftool

# For Command execution
python perftool netstat

# Without reports
python perftool netstat --report False

# For Debug
python perftool netstat --DEBUG

# For Multiword commands
python perftool "netstat -an"

# For Live reporting
python perftool "jmeter -n -t test.jmx" --report live
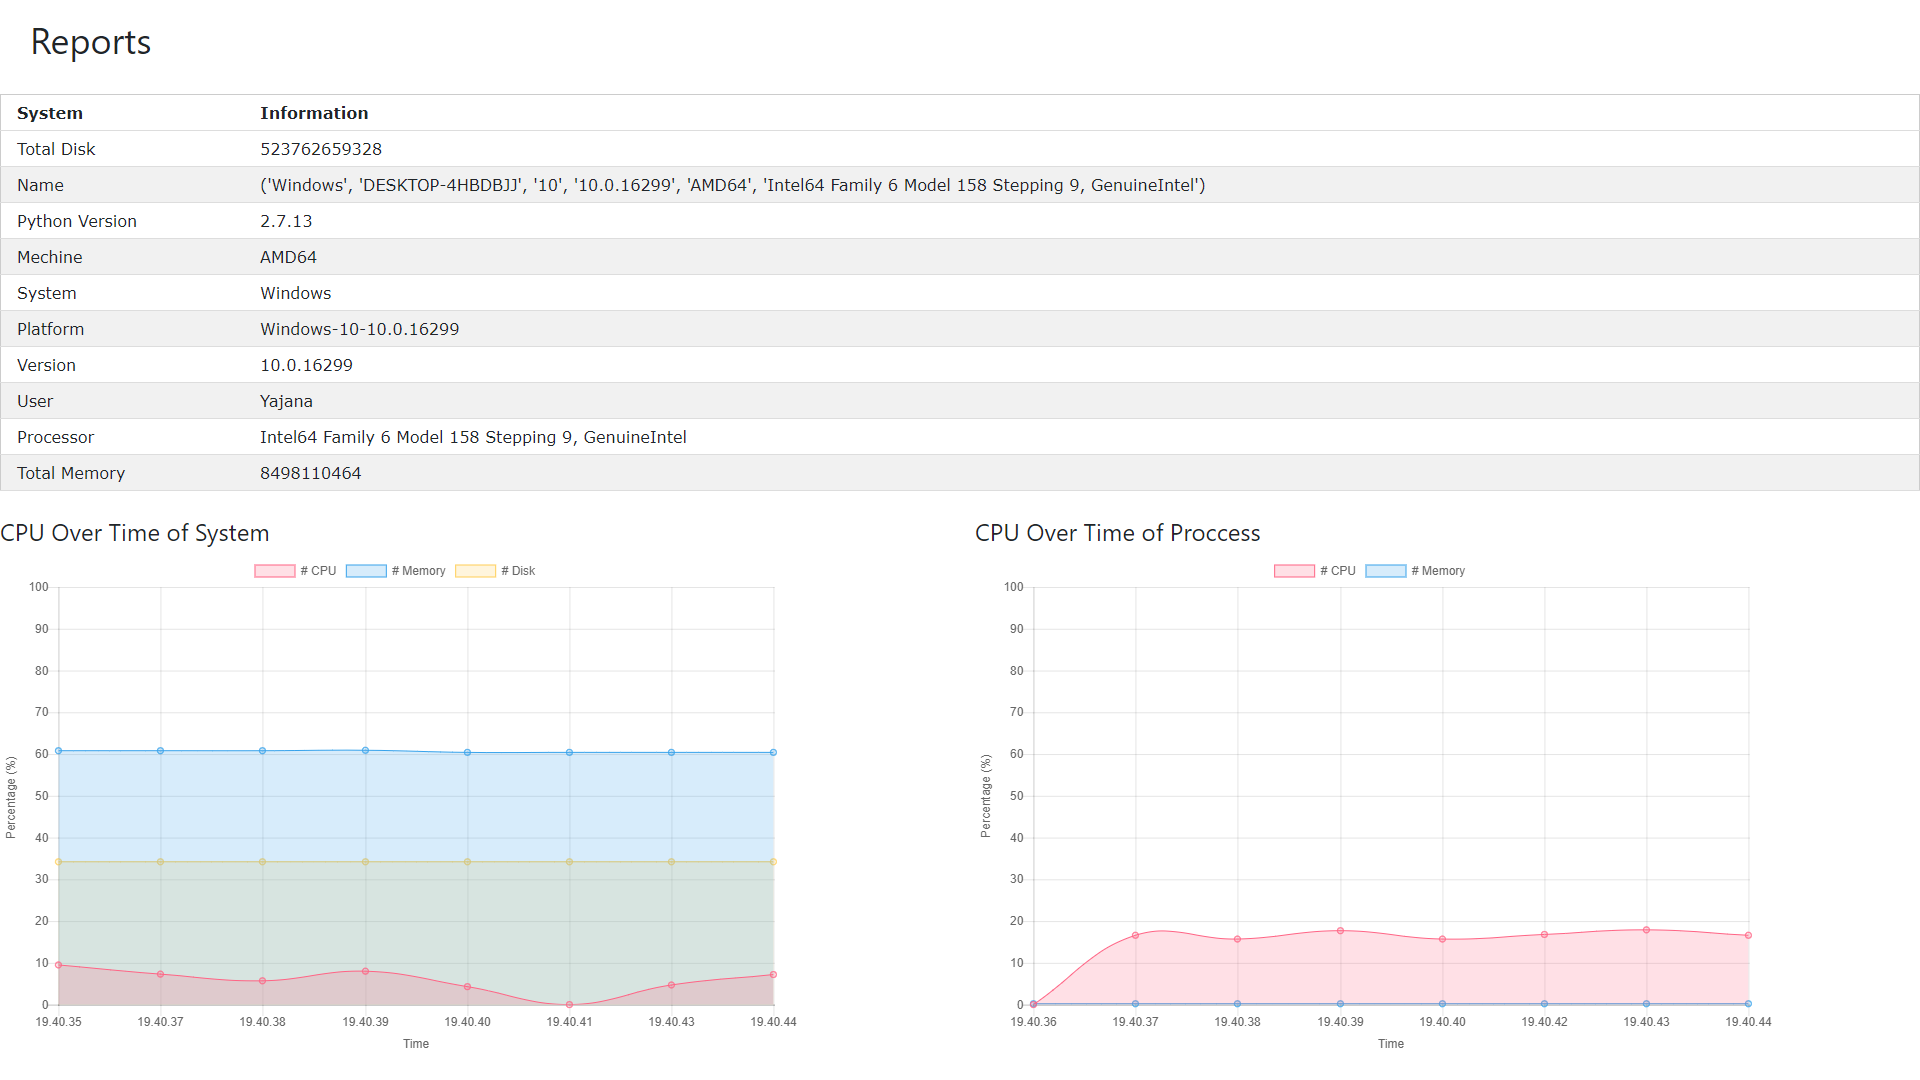
Features Measure the time taken for the execution of system commands and record the performance while executing. HTML, CSV reports are genearated at the end. Live reports can be seen on web by enabling live reporting feature mentioned above.
- Flask API
- Chart.js
- D3.js
- Influx DB
- Grafana
If live reporting option is enable via defaults.ini or from command line parameter --report=live, A page will be opened in default browser with live graphs
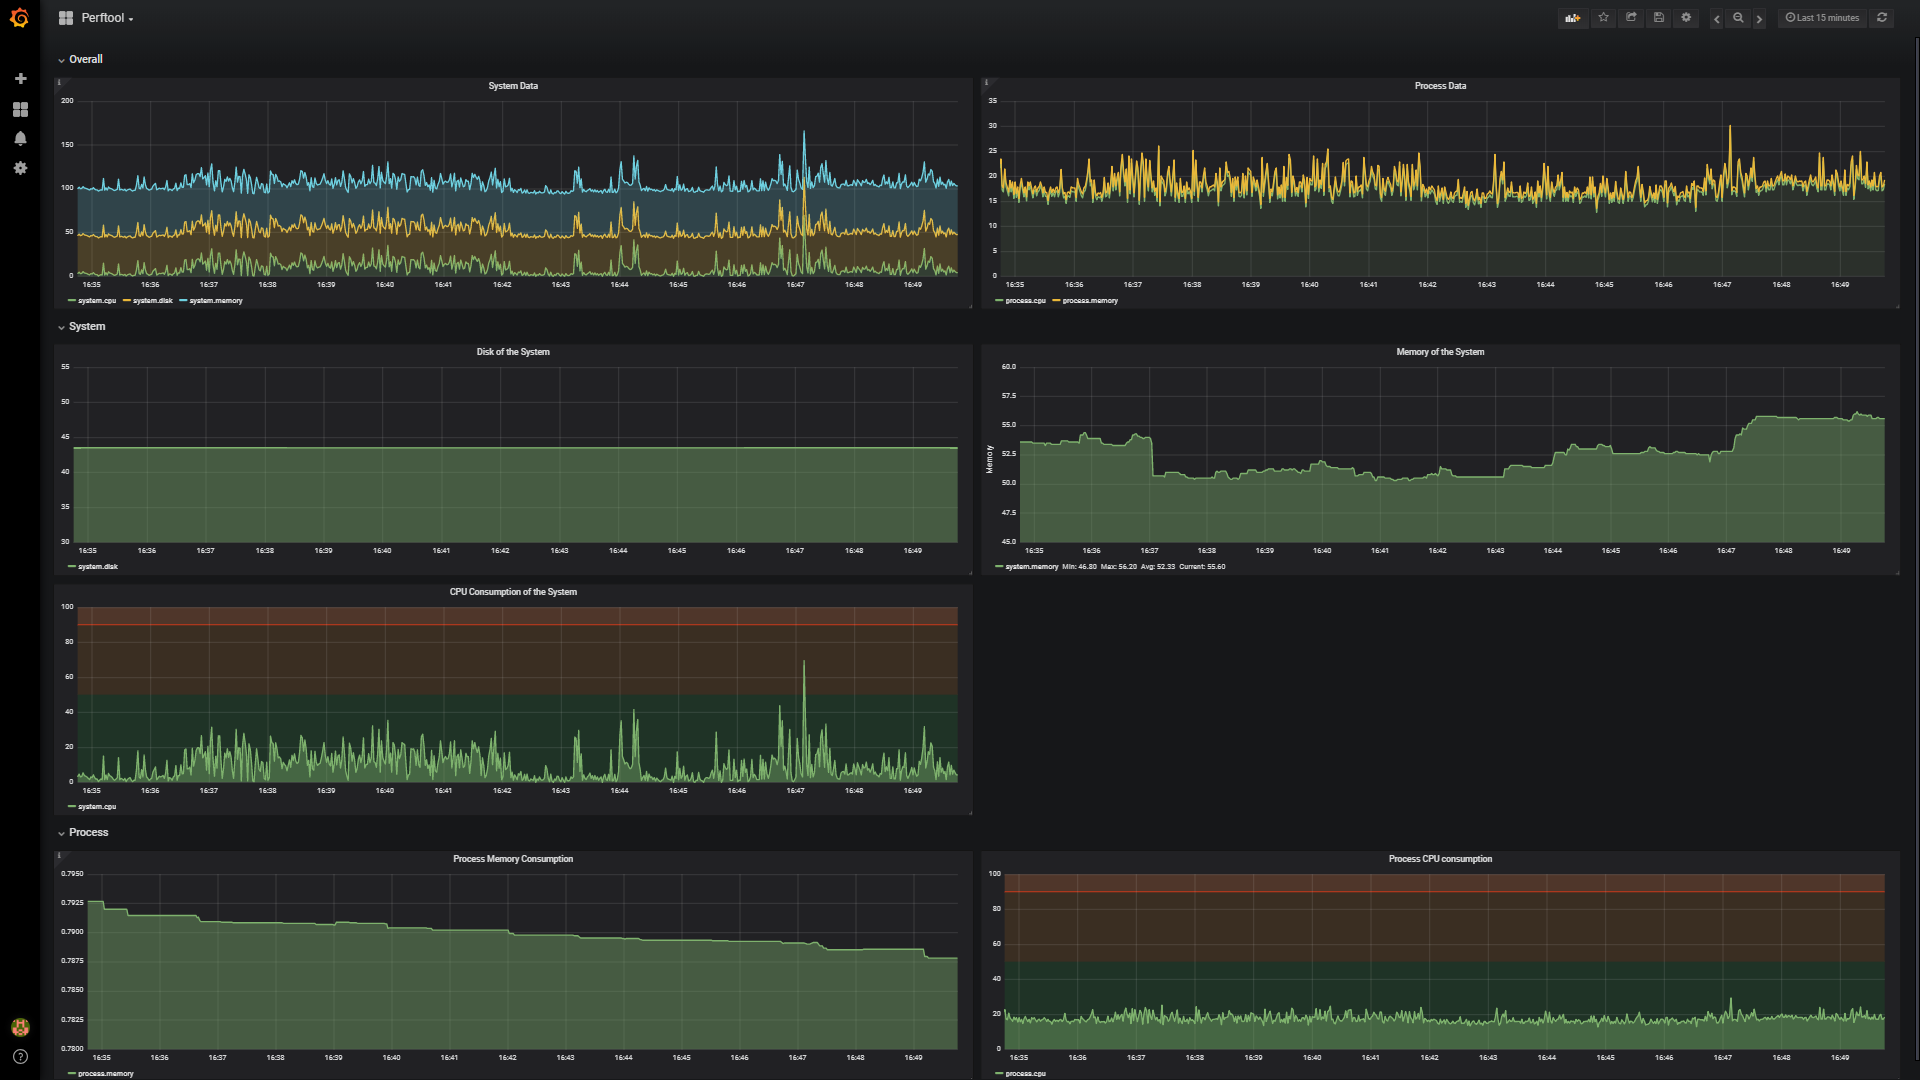
If influx database is enabled in defaults.ini file, System and Process data will be pushed to the influx. Using grafana you can generate live reports. (Dashboard template is in resource folder)
Windows 10
Ubuntu 16
Ubuntu 17
1. Clone the source code from github
2. cd to Perftool
3. The the path in enviroment variable
4. Run pip install -r requirements.txt
5. Start executing


