field_data_analysis
Load library
library(agricolae)
Load your data
yourdata = read.csv("yourdata.csv", h = T, sep =",")
Run the ANOVA
model = <-aov(CI~Group, data=yourdata)
summary(model)
Mean comparison
HSD.test(model,"Group", group=TRUE,console=TRUE)
Today .8 02 2022 Meeting with Kanf.
- Remove Sefa data and rerun the analyses : BLUES and BLUPS, Genetic correlation following variables
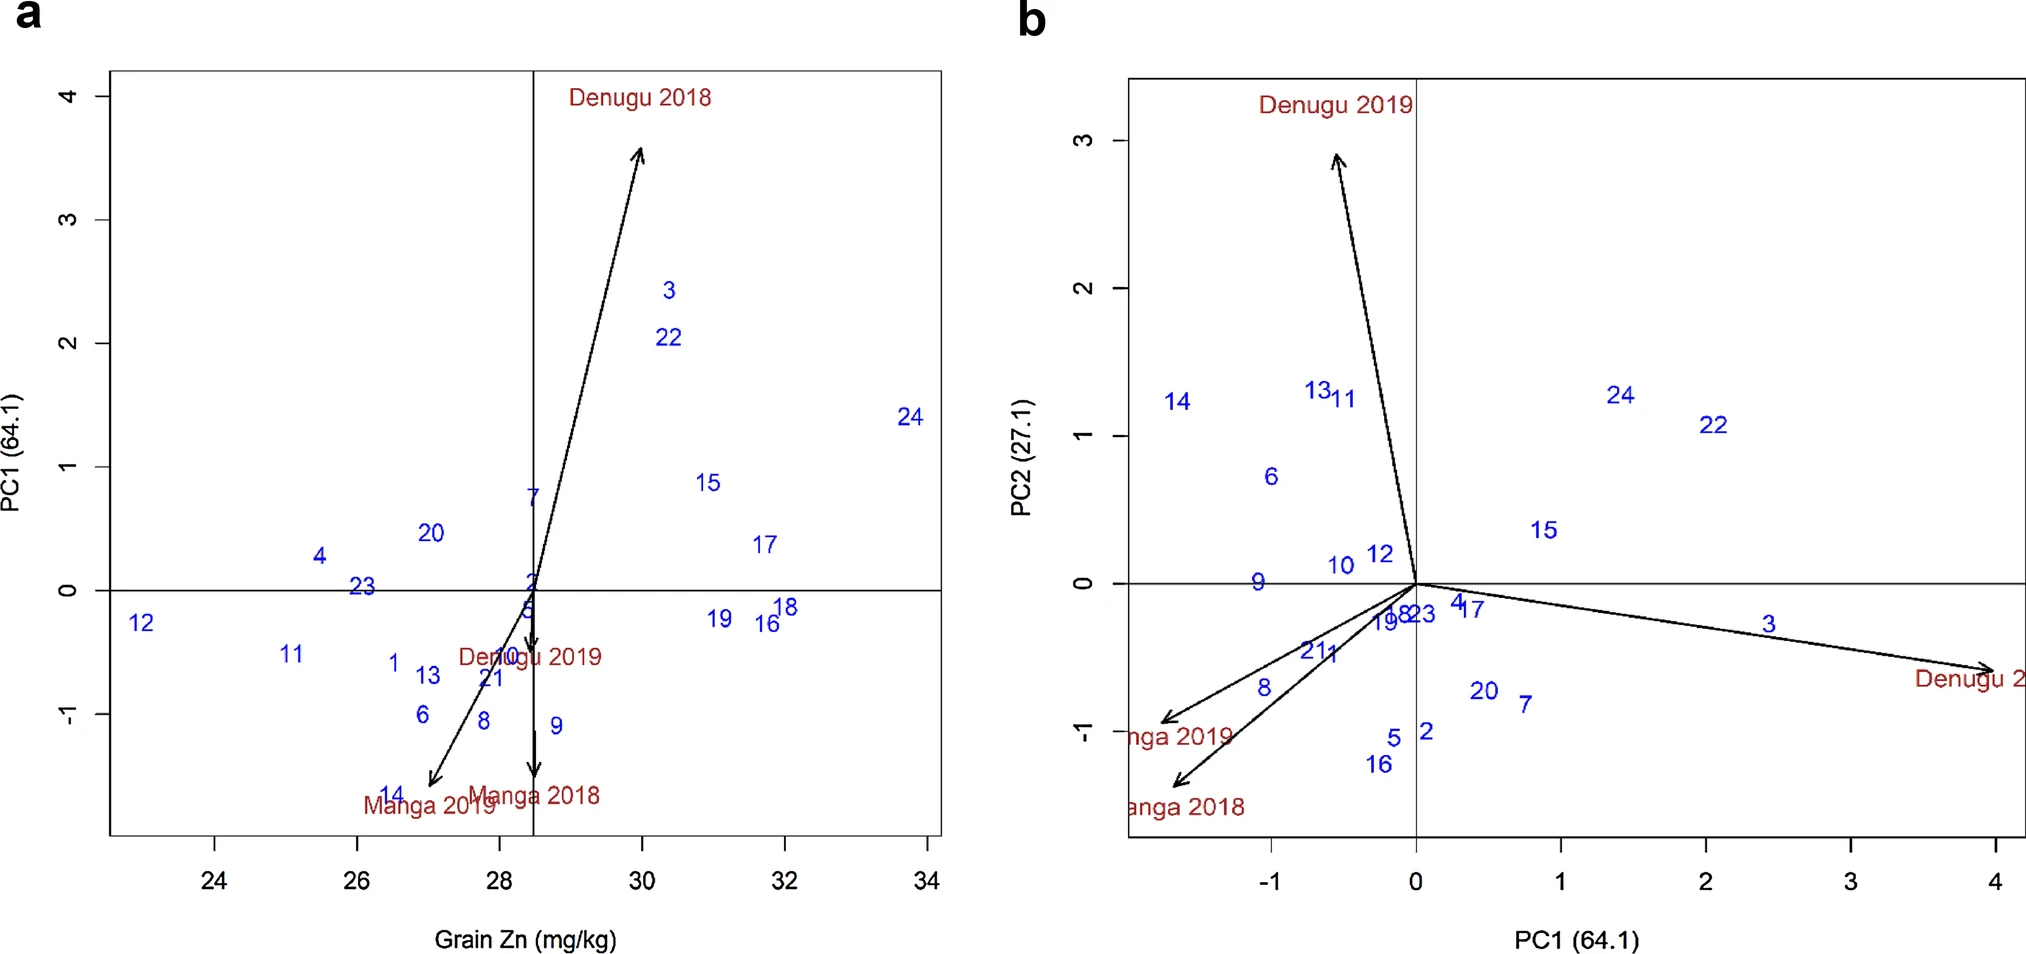
- Use the BLUPs value to to the GGBiplot analysis
- Box plot showing the variability of data following the three sites - use the blup value for each entry per site for each variable to plot the box plot
- plot a regression plot showing year following yield, FLO, Fe and Zn separetely .....Use BLUPs values (See EiB M2Breeding doc page 12) for the year check here and the draft paper from Kanf.
Special Issue "Utilizing Genetic Resources for Agronomic Traits Improvement"
https://www.mdpi.com/journal/agronomy/special_issues/Agronomic_Traits
Oil, protein lignan
3- Correlation of Lignan Contents with Protein and Oil Contents in the Seeds of Sesamum indicum L.
4- Protein 1 , 2, 3 , machine rapid N cube by Elementar Analysensysteme GmbH
5- very interesting more closer to our experiment I think here
6 - Characteristics of antioxidant activity and composition of pumpkin seed oils in 12 cultivars
-
Genetic divergence, path analysis and molecular diversity analysis in cluster bean (Cyamopsis tetragonoloba L. Taub.)
-
Diversity in Indian sesame collection and stratification of germplasm accessions in different diversity groups
-
Aerial high-throughput phenotyping enables indirectselection for grain yield at the early generation, seed-limitedstages in breeding programs
-
Quantitative genetic analysis of agronomic and morphological traits in sorghum, Sorghum bicolor
-
Korean soybean core collection: Genotypic and phenotypic diversity population structure and genome-wide association study
choice 1: Leveraging phenotypic variation in a worldwide panel from the Korean genebank to enhance yield, protein, lignan and oil oriented sesame breeding.
choice 2: Leveraging phenotypic variation in a worldwide panel from the Korean genebank to identify new resources for yield, protein, lignan and oil oriented sesame breeding.
choice 3: Leveraging phenotypic diversity in a worldwide panel from the Korean genebank to identify new resources for yield, protein, lignan and oil oriented sesame breeding.
-
Lignans of Sesame (Sesamum indicum L.): A Comprehensive Review
-
Lignan contents in sesame seeds and products
-
Near-infrared reflectance spectroscopy reveals wide variation in major components of sesame seeds from Africa and Asia
To cross-validate the results of NIRS scanning, the 70 samples with sufficient seeds were subjected to chemical determination. Approximately 10 g of cleaned seed samples were manually ground to fine powder with liquid nitrogen. Seed oil was estimated by the conventional Soxhlet method using petroleum ether as extraction solvent [13]. Total protein content was determined by the Kjeldahl method according to AOAC [14]. Determination of oleic and linoleic acids was performed following Stefanoudaki et al. [15]. Each sample was tested in triplicate.
-
Lignans of sesame: Purification methods, biological activities and biosynthesis – A review
-
Broadening the genetic base of sesame (Sesamum indicum L.) through germplasm enhancement
-
Diversity in Indian sesame collection and stratification of germplasm accessions in different diversity groups
-
https://link.springer.com/article/10.1023/A:1008652420477
-
Genetic parameter estimation and selection in advanced breeding population of white Guinea yam
-
Heterosis and combining abilities in a diverse seven-parent pearl millet population diallel tested in West Africa
Raw data of each location were checked for outliers and tested for normality. The statistical analysis was performed following a one-step approach. Adjusted entry means were calculated based on the performance of the parents, controls, and hybrids using the following model across six environments:

where yijkl is the observed phenotype; µ represents the general mean; gi refers to the effect of the ith genotype; ej refers to the effect of the jth environment; (g×e)ij is the interaction effect between genotype i and environment j; rjk is the effect of the kth replication in the jth environment; bjkl is the effect of lth block nested in the kth replication of jth environment; and εijkl is the residual effect. For the estimation of entry means, the genotypic effects were considered fixed and all other effects were random. For the variance component estimation, all effects were regarded as random (Piepho et al. 2003). Broad-sense heritability (H2 ) for all 13 agronomic traits was calculated across environments, using the following formula,

Tutorial 1 (ASReml-R) - Estimating the heritability of birth weight
A tutorial on the statistical analysis of factorial experiments with qualitative and quantitative treatment factor levels Tuto | Paper
sommer | tuto | sommer vs lme4](https://rdrr.io/cran/sommer/f/inst/doc/v5.sommer.vs.lme4.pdf) | paper | usage heterescedasticity option| poster
Other functions such as summary, fitted, randef (notice here is randef not ranef), anova, variogram, residuals, coef and plot applicable to typical linear models can also be applied to models fitted using the mmer2-type of functions.