##Project description
Description
In this project, the groups could select the datasets which interest them most from the approved data sources (most of them are free online). It is best that the selected dataset has not be analyzed before (such that the results and codes could be downloaded directly). The datasets which have been analyzed TOO many times should be avoided.
Main contents
Background introduction data source, preliminary analyses (bar plot, histogram, correlation, matrix plot, boxplot, etc.) Statistical hypothesis or problems Formal analyses using statistical approaches. Interpret your results. Conclusions. Job division among the group members.
Students are also encouraged to apply the previously learned techniques (from, e.g., DATA 602 and 603) to the selected datasets. Think of ways to visualize your findings
The project report should be written using R Markdown, Latex or Word. The code, as well as the generated results, should be inserted. this is NOT a research project. Just apply what you learned from the class to your selected dataset to get the output, visualize the output, properly interpret the output.
- This Dataset is instrumental if you are working on a machine-learning project where you are working in which you need information about smartphones, and feature phone available in the Indian market.
- This Dataset is having 5 columns -> model name, price, ratings, reviews, and specifications.
- Do not confuse it with the duplicated values in the name and the price columns, because in the model name, there are the same phones available with different color options Google pixel 6pro is available in 2-3 color options but the price was the same. So your domain knowledge and how better you do the feature engineering over this dataset is dependent. The price is in the Indian rupee you can convert it according to your use case.
- Now I Updated the dataset and added a new version of the dataset after some Preprocessing (Updated_Mobile_Dataset.csv)
- In which the new version does not contain any null values added the company column in the new version and also separated the Rom and Ram columns.
- The shape of the newly updated data set is (28036, 8)
- The objective here is to forecast the price of mobile phones.
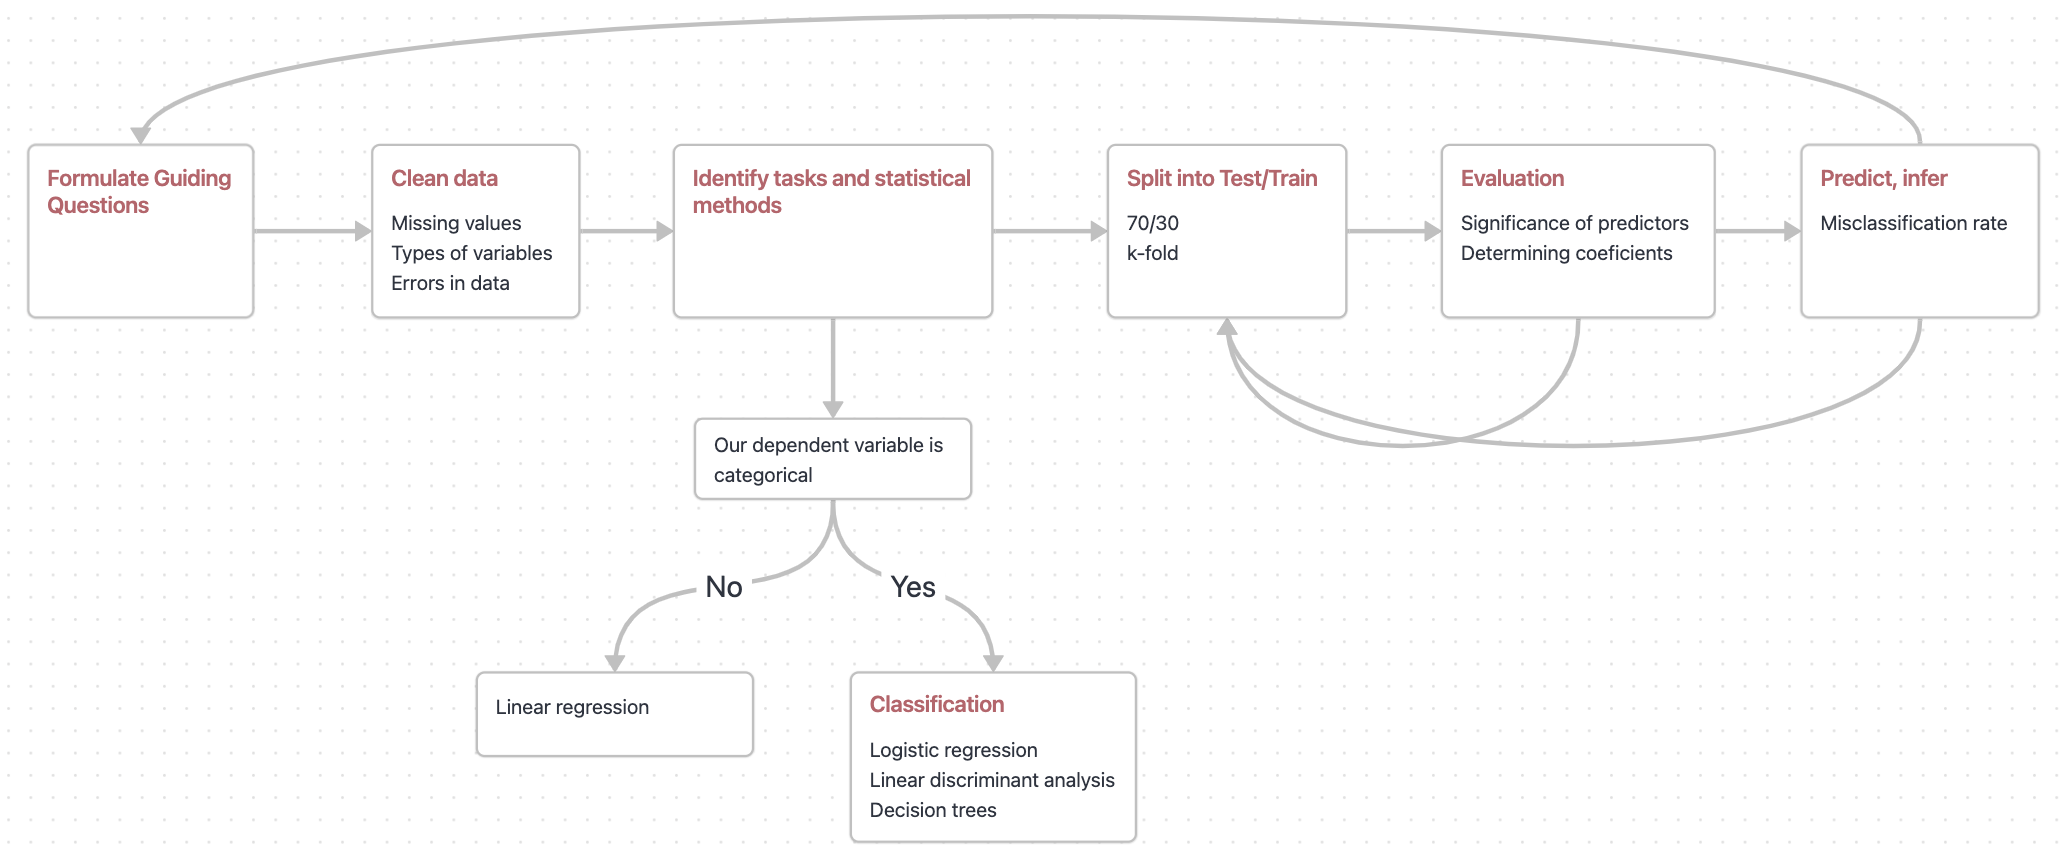
Our team is finalizing what the full analysis of the dataset will look like, but a preliminary template and breakdown of work by team member has been included below. The different colors represent which components of the project different team members would take on. It is anticipated that all members will assist in the finalization of the report.
