This is a non-official implementation of the trend labeling method proposed in the paper A Labeling Method for Financial Time Series Prediction Based on Trends.
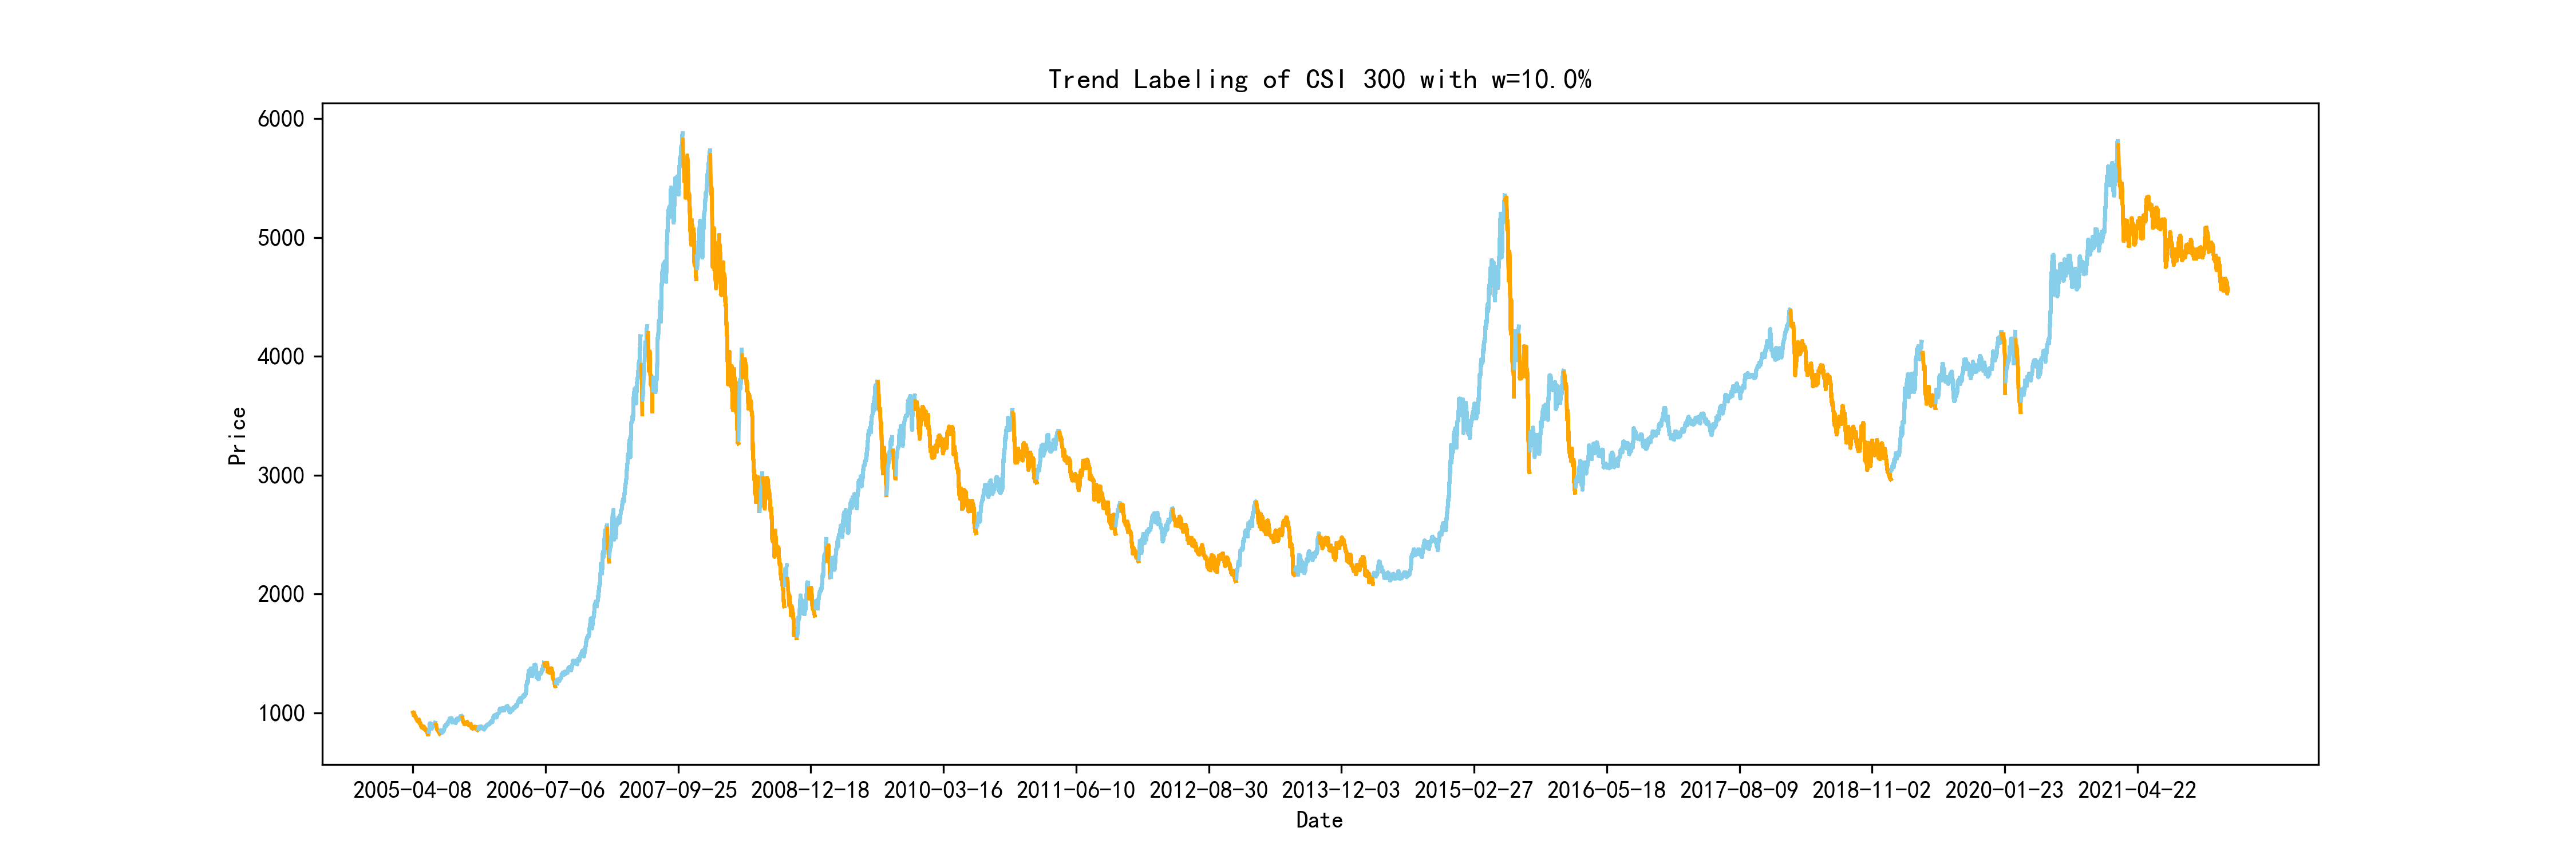
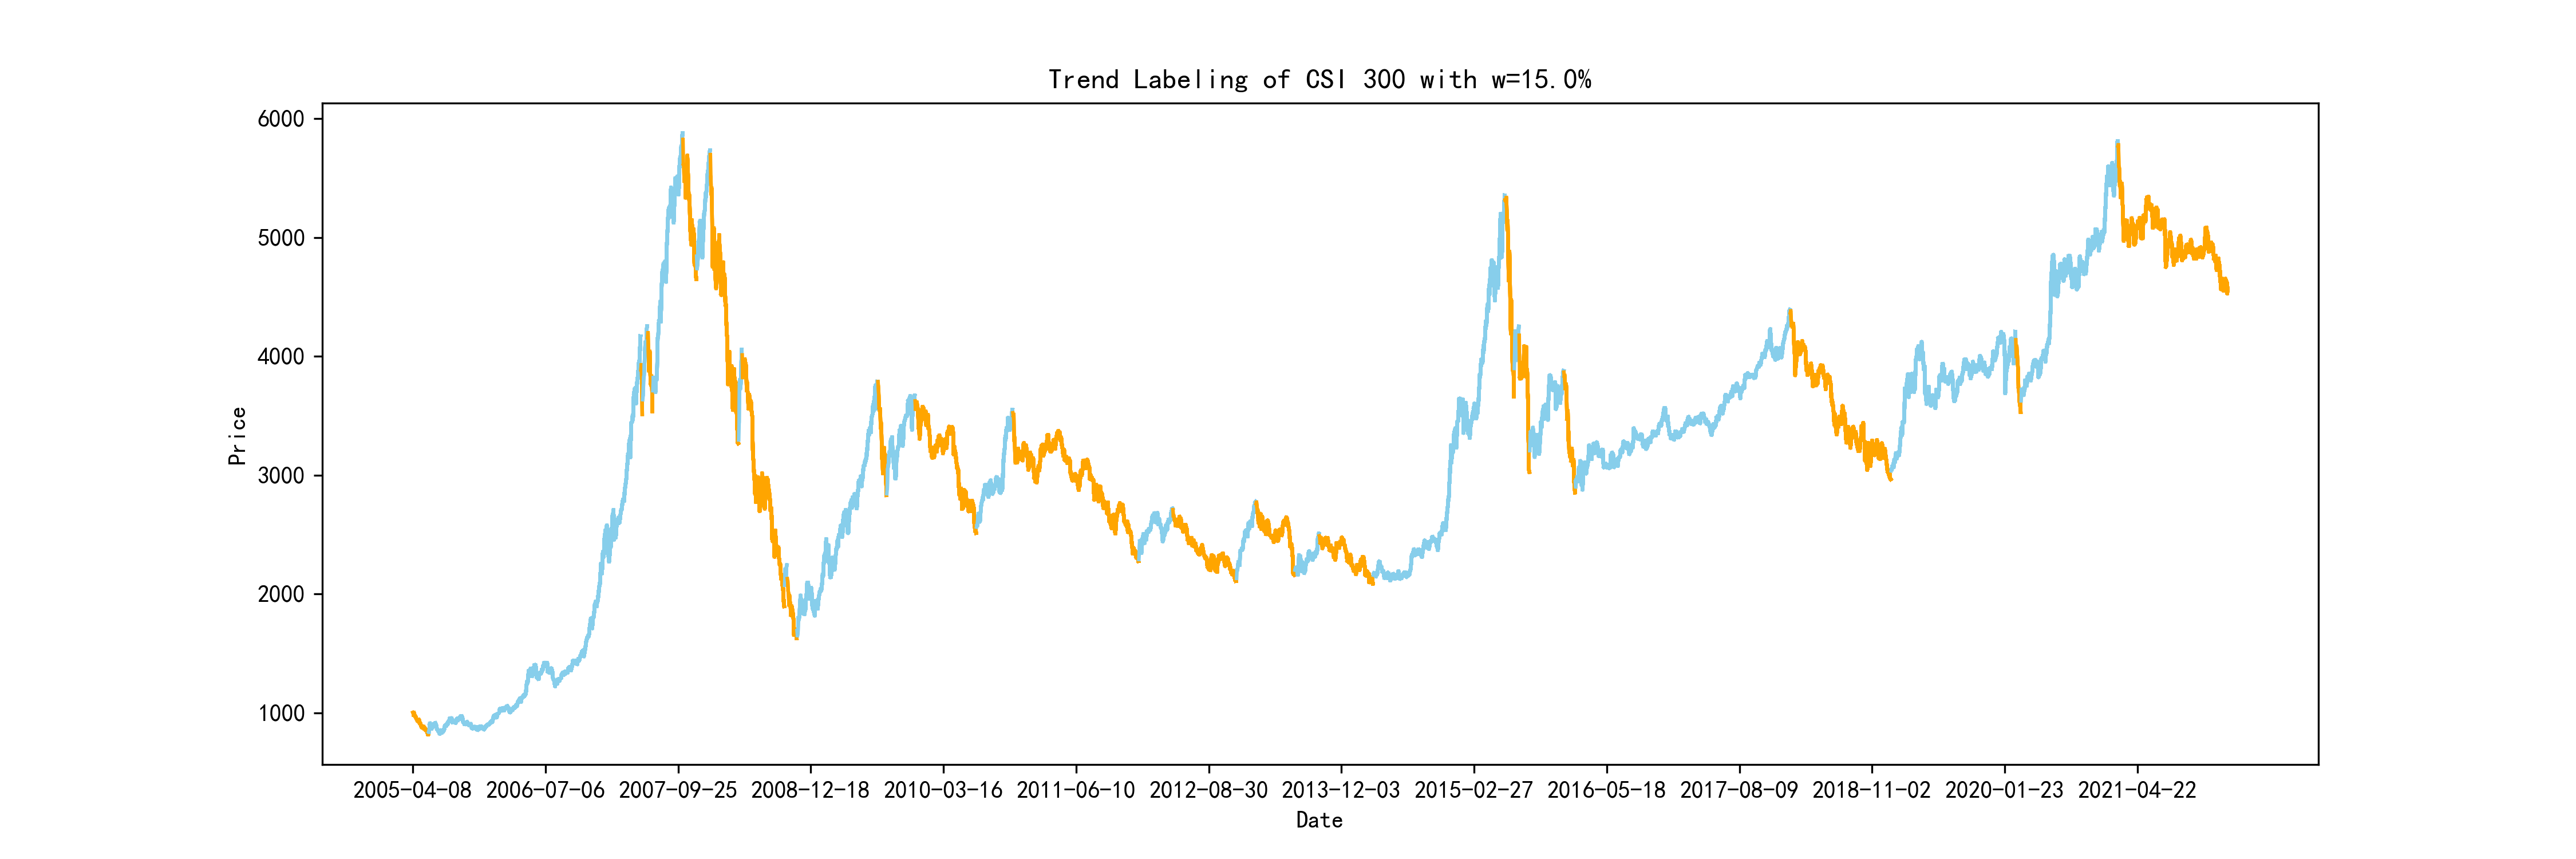
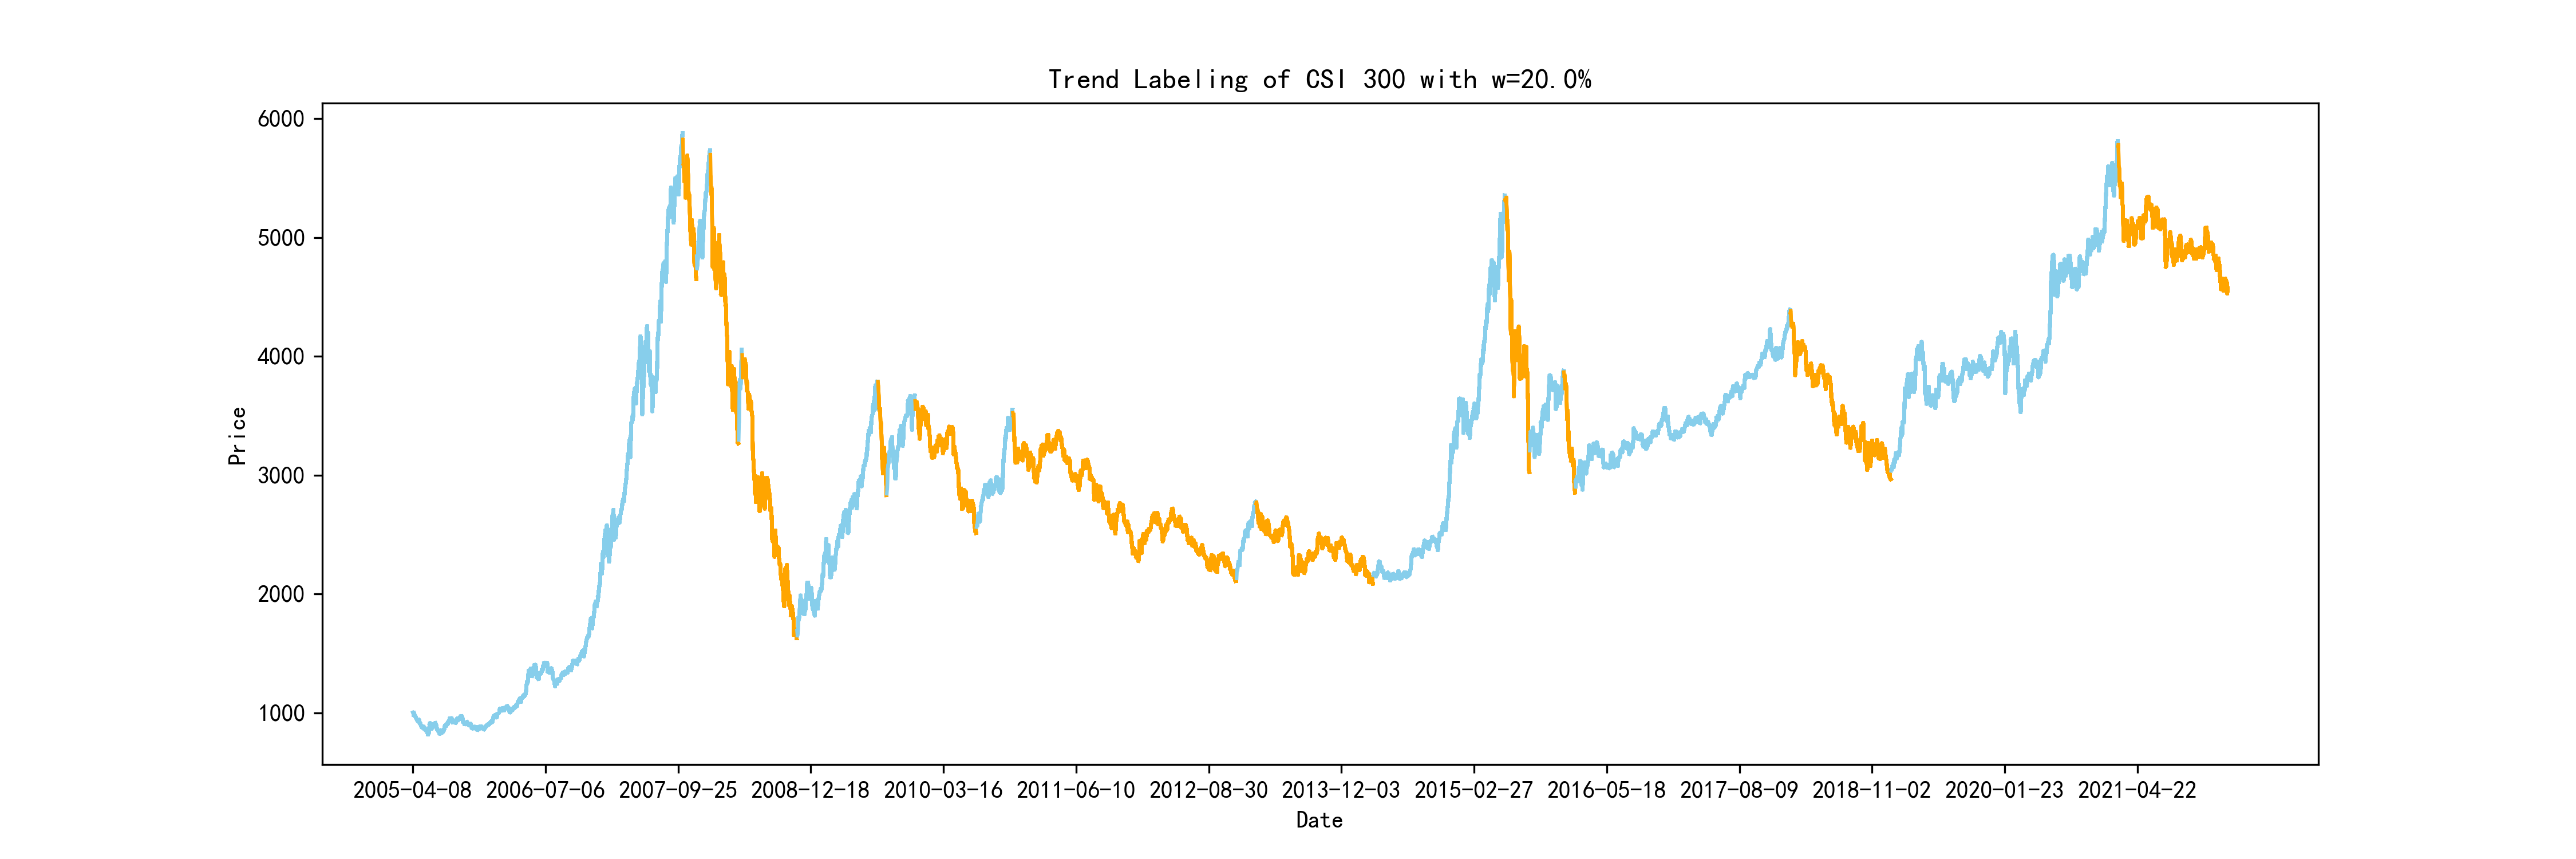
In this method, the trend is labeled based on a certain parameter w. Once the price rises by more than w from the local trough, it is regarded as an uptrend, and the local trough is labeled as the beginning of the uptrend. Meanwhile, when the price falls by more than w from the local peak, this method labels a downtrend starting from the local peak.
The following three figures show the labeling results for the CSI 300 price time series with w=10%, 15%, and 20%, respectively.
To run this example you need the following packages:
pip install numpy tqdm akshare matplotlib
If you find this code useful please cite these following two papers in your work:
@article{wu_labeling_2020,
	title = {A {Labeling} {Method} for {Financial} {Time} {Series} {Prediction} {Based} on {Trends}},
	volume = {22},
	issn = {1099-4300},
	doi = {10.3390/e22101162},
	language = {en},
	number = {10},
	journal = {Entropy},
	author = {Wu, Dingming and Wang, Xiaolong and Su, Jingyong and Tang, Buzhou and Wu, Shaocong},
	month = oct,
	year = {2020},
	pages = {1162}
}
@article{xiu_crash_2021,
	title = {Crash {Diagnosis} and {Price} {Rebound} {Prediction} in {NYSE} {Composite} {Index} {Based} on {Visibility} {Graph} and {Time}-{Evolving} {Stock} {Correlation} {Network}},
	volume = {23},
	issn = {1099-4300},
	url = {https://www.mdpi.com/1099-4300/23/12/1612},
	doi = {10.3390/e23121612},
	language = {en},
	number = {12},
	journal = {Entropy},
	author = {Xiu, Yuxuan and Wang, Guanying and Chan, Wai Kin Victor},
	month = dec,
	year = {2021},
	pages = {1612}
}


