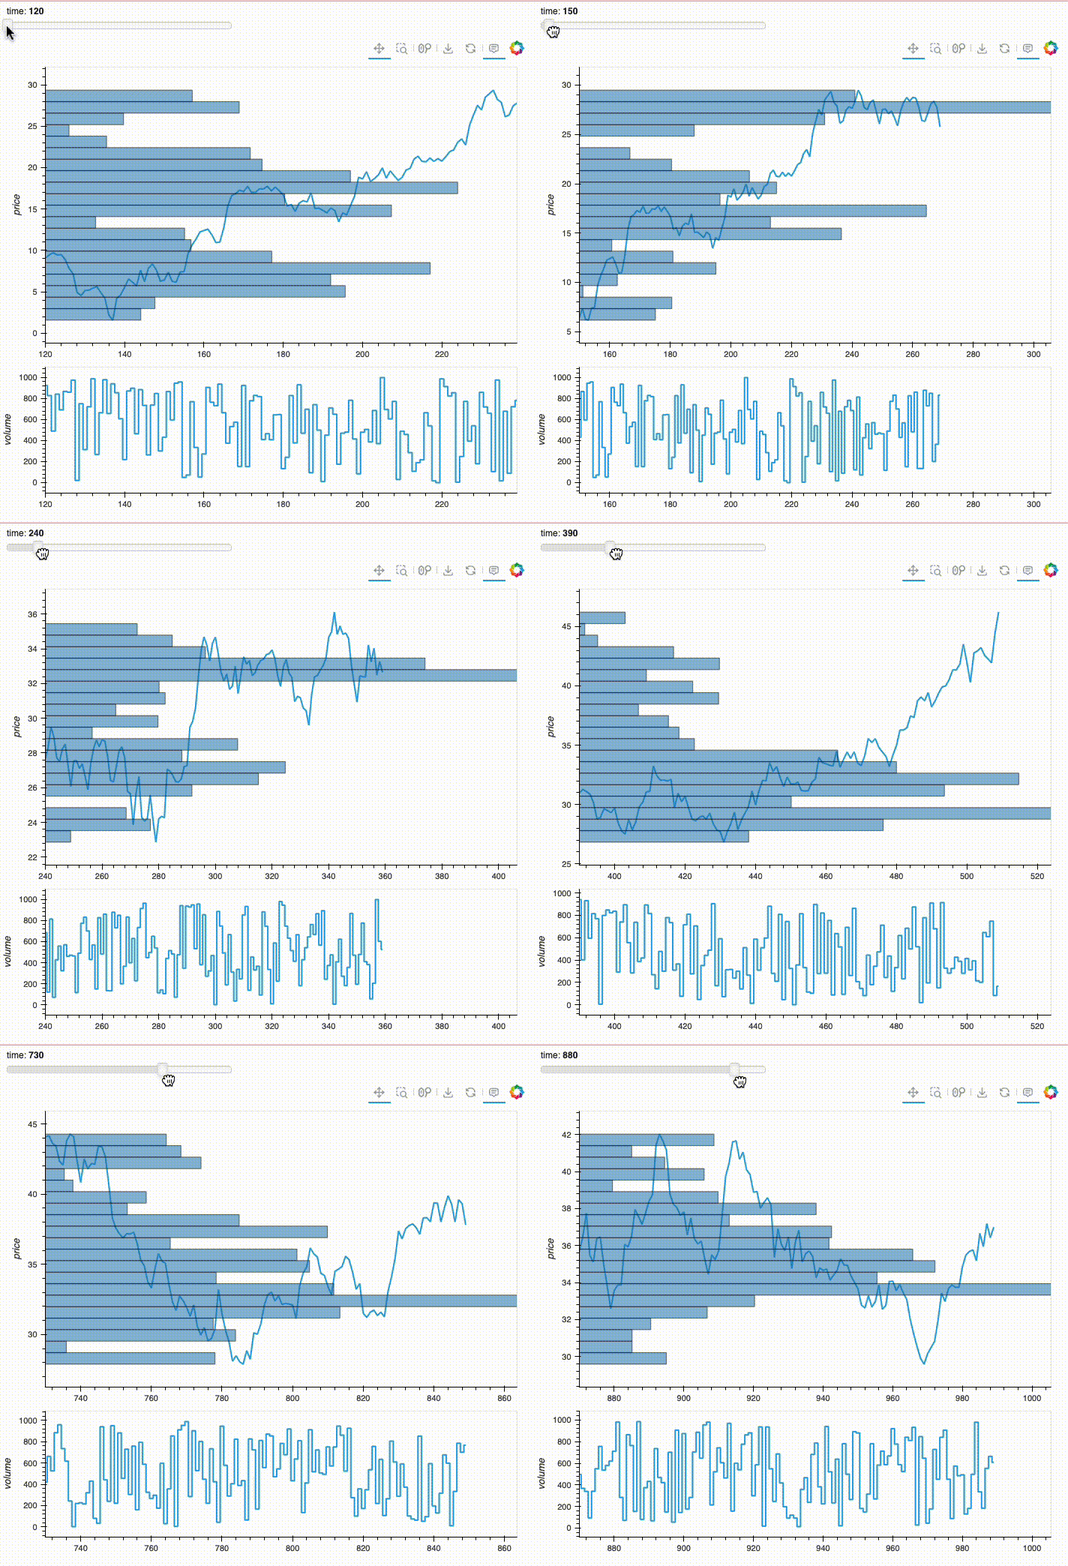
The Polars Price by Volume (PBV) extension is a powerful tool for analyzing and visualizing financial data. This extension provides various functions to calculate and visualize the price by volume (PBV) data using the Polars DataFrame library.
To use the Polars PBV extension, you need to install the following packages:
•	polars
•	polars_pbv
You can install these packages using pip:
pip install polars polars_pbvIf you want to visualize the pbv chart, you need to install the following packages:
•	hvplot
•	holoviews
•	panel
You can install these packages using pip:
pip install hvplot holoviews panelThe PBV extension provides several functions:
1.	pbv
2.	pbv_pct
3.	pbv_topn_vp
4.	pbv_topn_v
Calculates the price by volume over a specified window size and bins.
def pbv(
    price: IntoExpr,
    volume: IntoExpr,
    window_size: int,
    bins: int,
    center: bool = True,
    round: int = -1,
) -> pl.Expr:
Return type will be the struct contain the key with price and volume and the value both list
Calculates the percentage price by volume over a specified window size and bins.
def pbv_pct(
    price: IntoExpr,
    volume: IntoExpr,
    window_size: int,
    bins: int,
    center: bool = True,
    round: int = -1,
) -> pl.Expr:
Same as above return type with the volume norm as percentage.
Calculates the top N price by volume over a specified window size and bins.
def pbv_topn_vp(
    price: IntoExpr,
    volume: IntoExpr,
    window_size: int,
    bins: int,
    n: int,
    center: bool = True,
    round: int = -1,
) -> pl.Expr:
Return will be list of price.
Calculates the top N price by volume over a specified window size and bins, with an option to calculate percentages.
def pbv_topn_v(
    price: IntoExpr,
    volume: IntoExpr,
    window_size: int,
    bins: int,
    n: int,
    center: bool = True,
    round: int = -1,
    pct: bool = False,
) -> pl.Expr:
Return will be list of volume or volume norm as pct.
Below is an example of how to use the Polars PBV extension. This example demonstrates how to calculate the PBV data and visualize it using hvplot and holoviews.
import numpy as np
import polars as pl
import polars_pbv as pl_pbv
import hvplot.pandas
import holoviews as hv
import panel as pn

# Initialize Panel extension
pn.extension()

# Define parameters
n = 1000
w = 120
b = 20

# Create a Polars DataFrame with example data
df = pl.DataFrame({
    "index": np.arange(0, n),
    "price": np.random.normal(size=n),
    "volume": np.random.randint(0, 1000, n),
}).with_columns(
    pl.col("price").cum_sum()
).with_columns(
    pl_pbv.pbv_pct("price", "volume", w, b, center=False).alias("pbv")
)

# Display the widget and the plot
i_slider = pn.widgets.IntSlider(name='i', start=0, end=n-w, step=1, value=0)

def plot_pbv(i):
    print(f"use {i}")
    df_pbv = df.slice(i+w, 1).select(
        pl.col("pbv").struct.field("price").list.explode(),
        pl.col("pbv").struct.field("volume").list.explode() * n,
    )
    pbv_data = df_pbv.to_dicts()
    step = pbv_data[1]["price"] - pbv_data[0]["price"]
    pbv_v_max = df_pbv["volume"].max()
    return ((df.slice(i, w).plot.line(x="index", y="price", height=400) *
      hv.Rectangles([[i, r["price"], i + r["volume"], r["price"] + step] for r in pbv_data], ).opts(alpha=0.5)
     ) + df.slice(i, w).plot.step(x="index", y="volume", height=200)).cols(1)

interactive_plot = pn.bind(plot_pbv, i=i_slider)

# Create a dashboard with the slider and the plot
dashboard = pn.Column(i_slider, interactive_plot)
dashboard.servable()

# If running in a Jupyter notebook or JupyterLab
dashboard
This example demonstrates how to create a Polars DataFrame, calculate the PBV data, and visualize it using hvPlot and HoloViews. The interactive slider allows you to dynamically update the plot by changing the value of i.
