- 1. Quick start
- 2. Draw Results
- 3. Important scripts/modules/packages
- 4. Key Python requirements
Note: Clone the repository using recursive command
git clone --recursive git@github.com:yangdangfu/predictor_selection.git
or
git clone --recursive https://github.com/yangdangfu/predictor_selection.git
- Prepare data
python main_data_preparation.py --region SC
Or download data from TeraBox or BaiduDisk. Put the download folder DATA under the project directory.
If the raw data is not well-prepared, the later option is better.
- Run predictor elimination algorithm
python main_select.py --reverse_sel False --multirun 10 --re_pred False --re_weight False --re_score False --region SC --model CNN10
- Run reverse predictor elimination algorithm
python main_select.py --reverse_sel True --multirun 10 --re_pred False --re_weight False --re_score False --region SC --model CNN10
- Run predictor elimination based on correlation analysis
python main_select_cc.py --reverse_sel False --multirun 10 --re_pred False --re_weight False --re_score False --region SC --model CNN10
- Draw results
- draw results of GBP-based predictor elimination
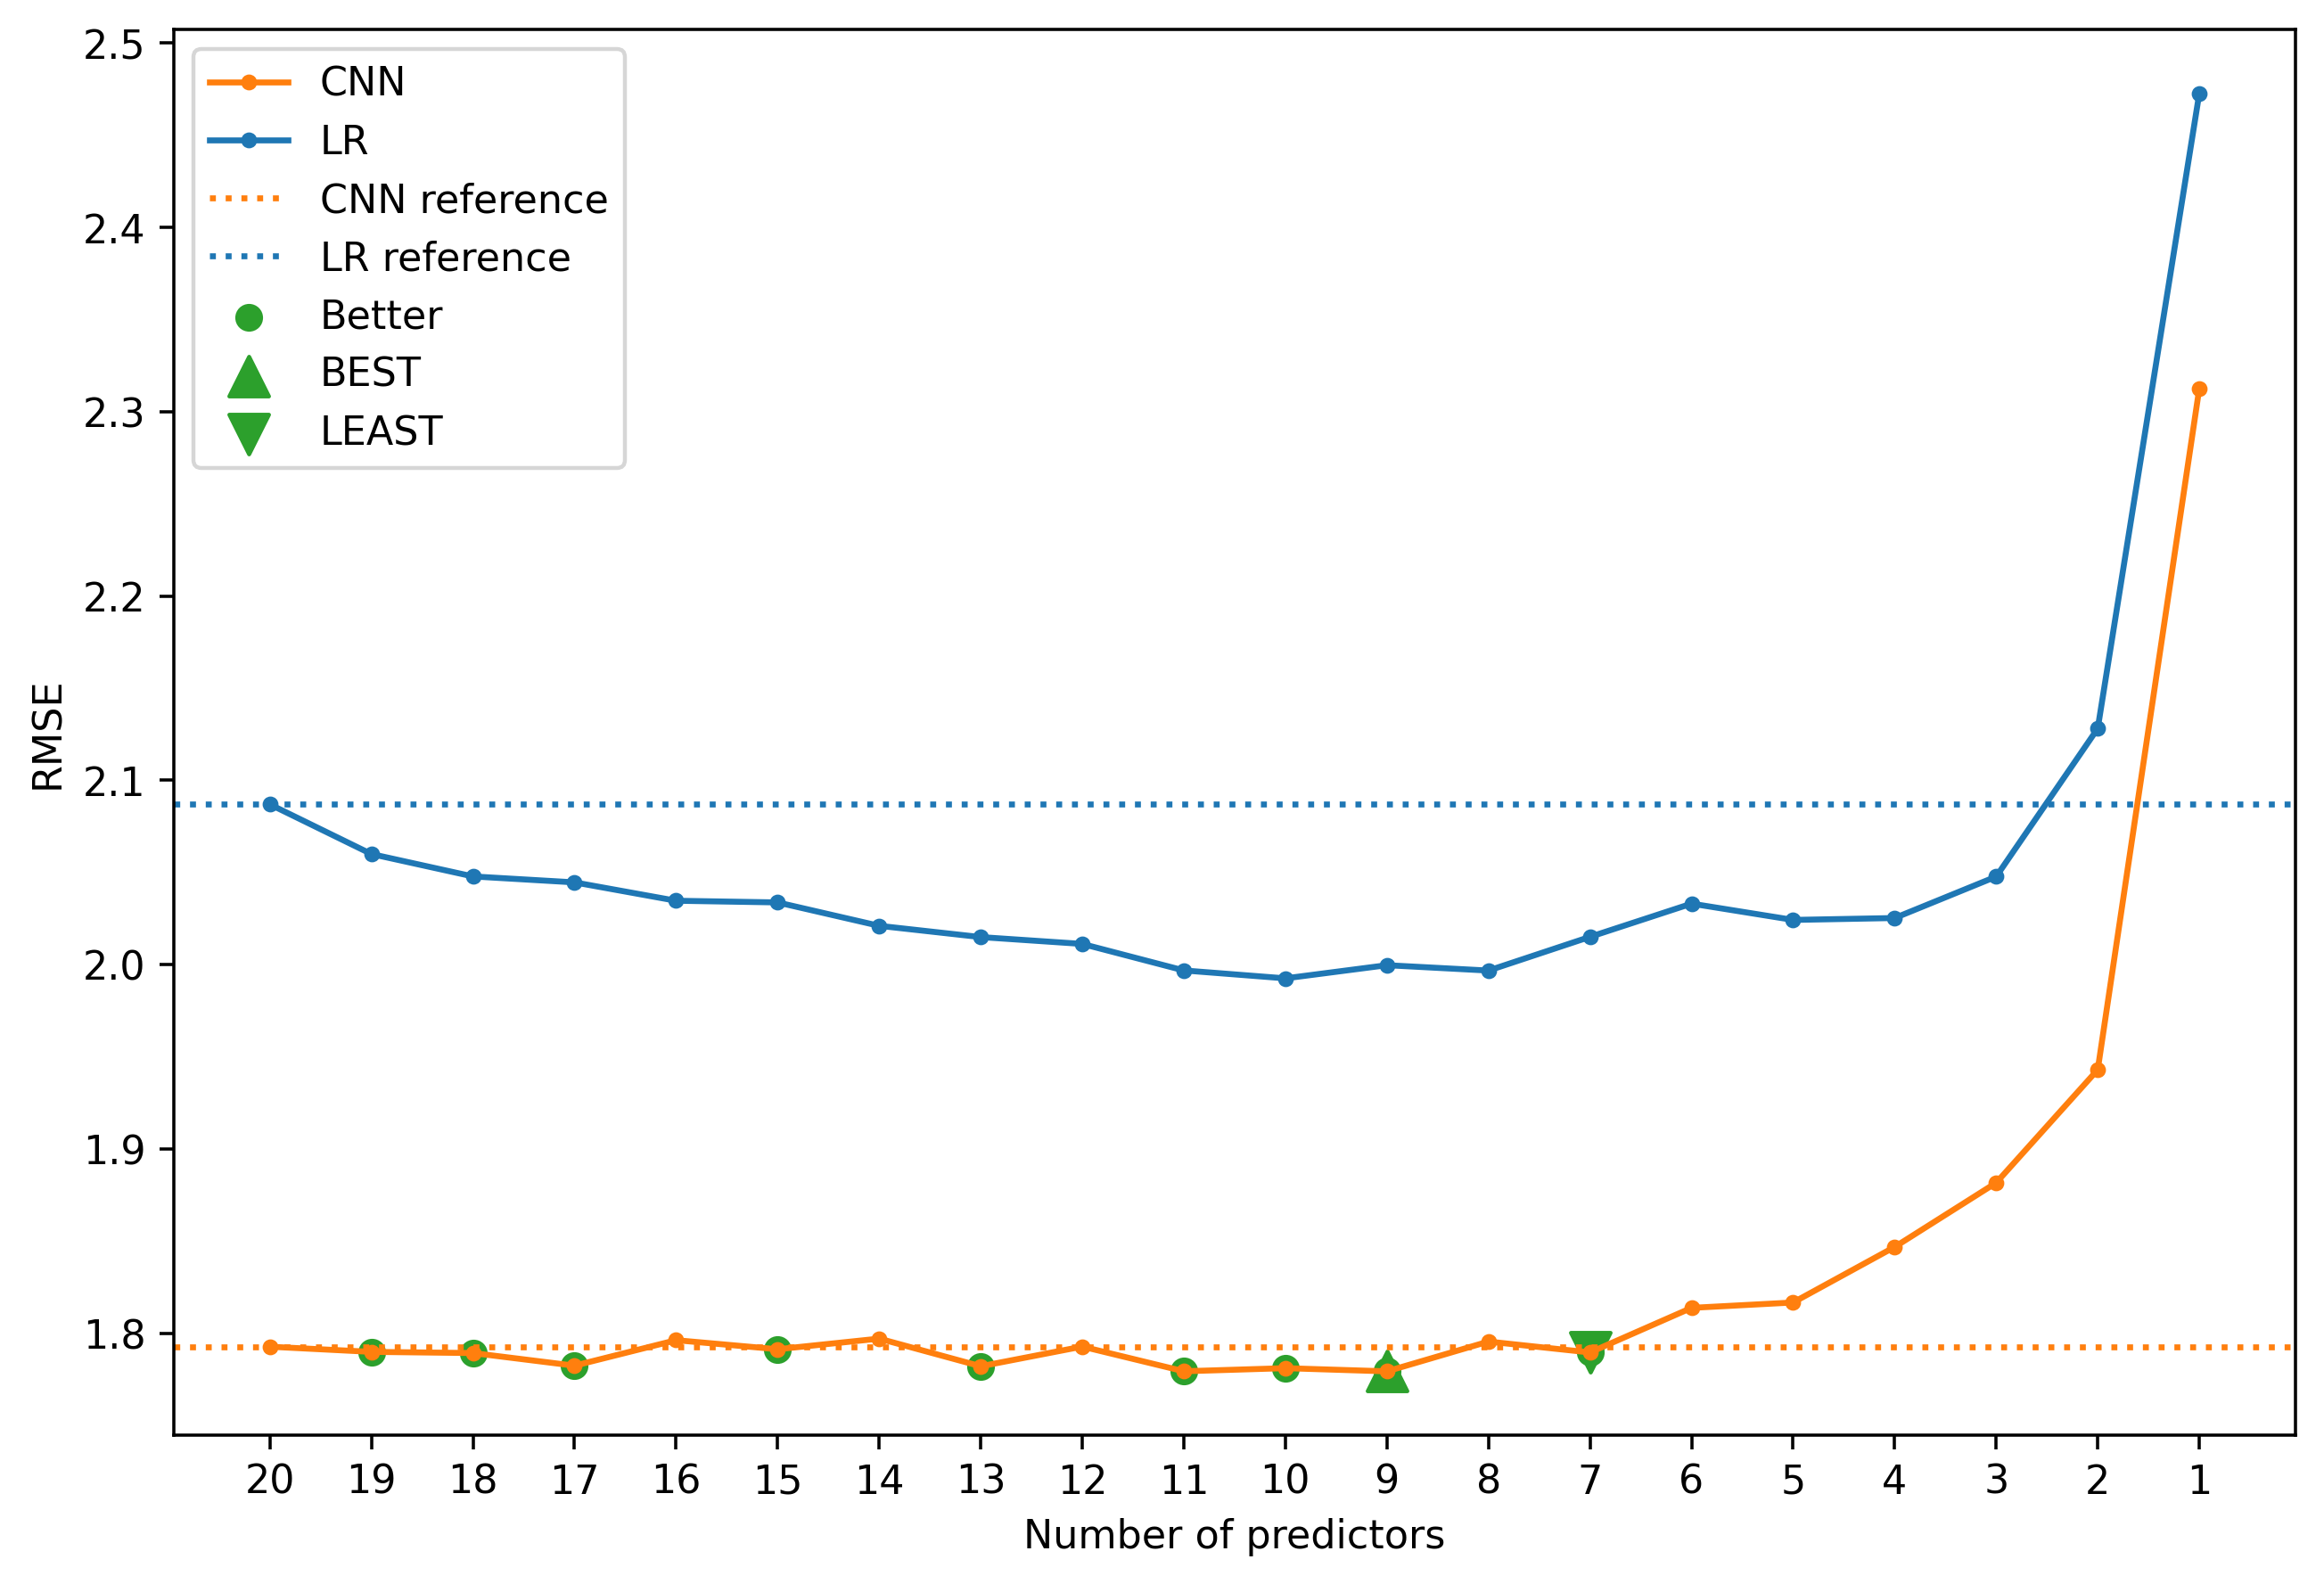
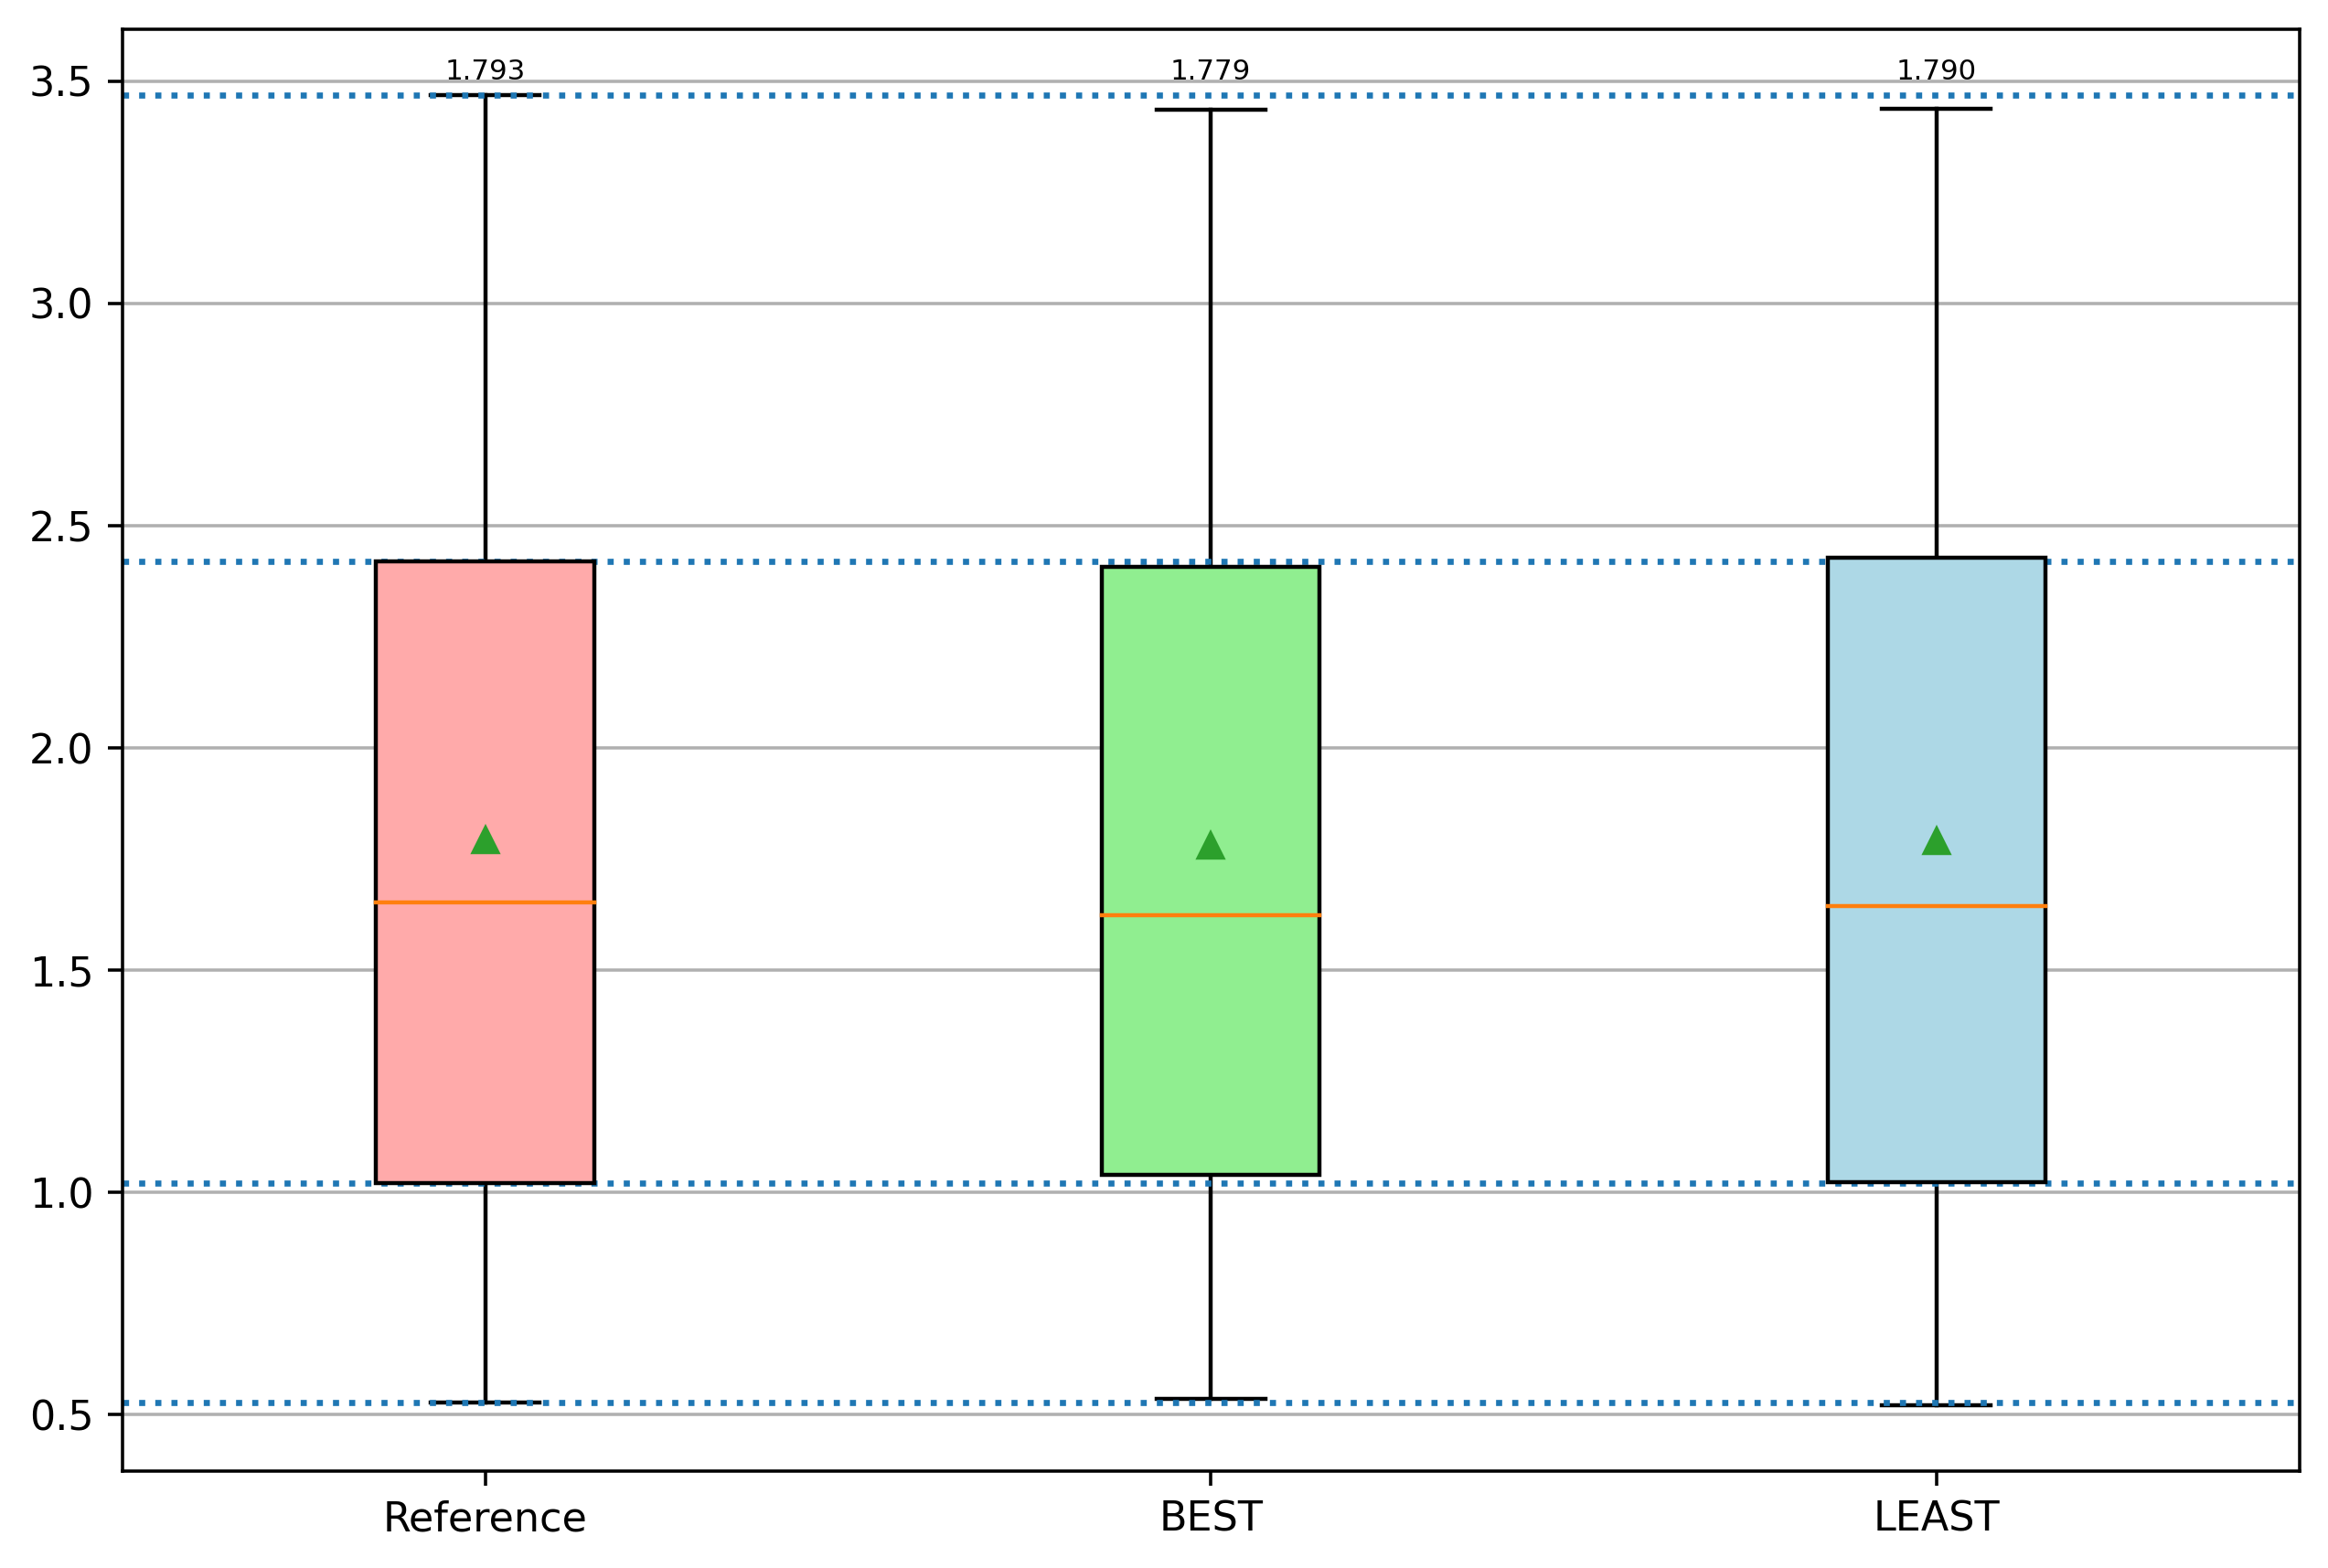
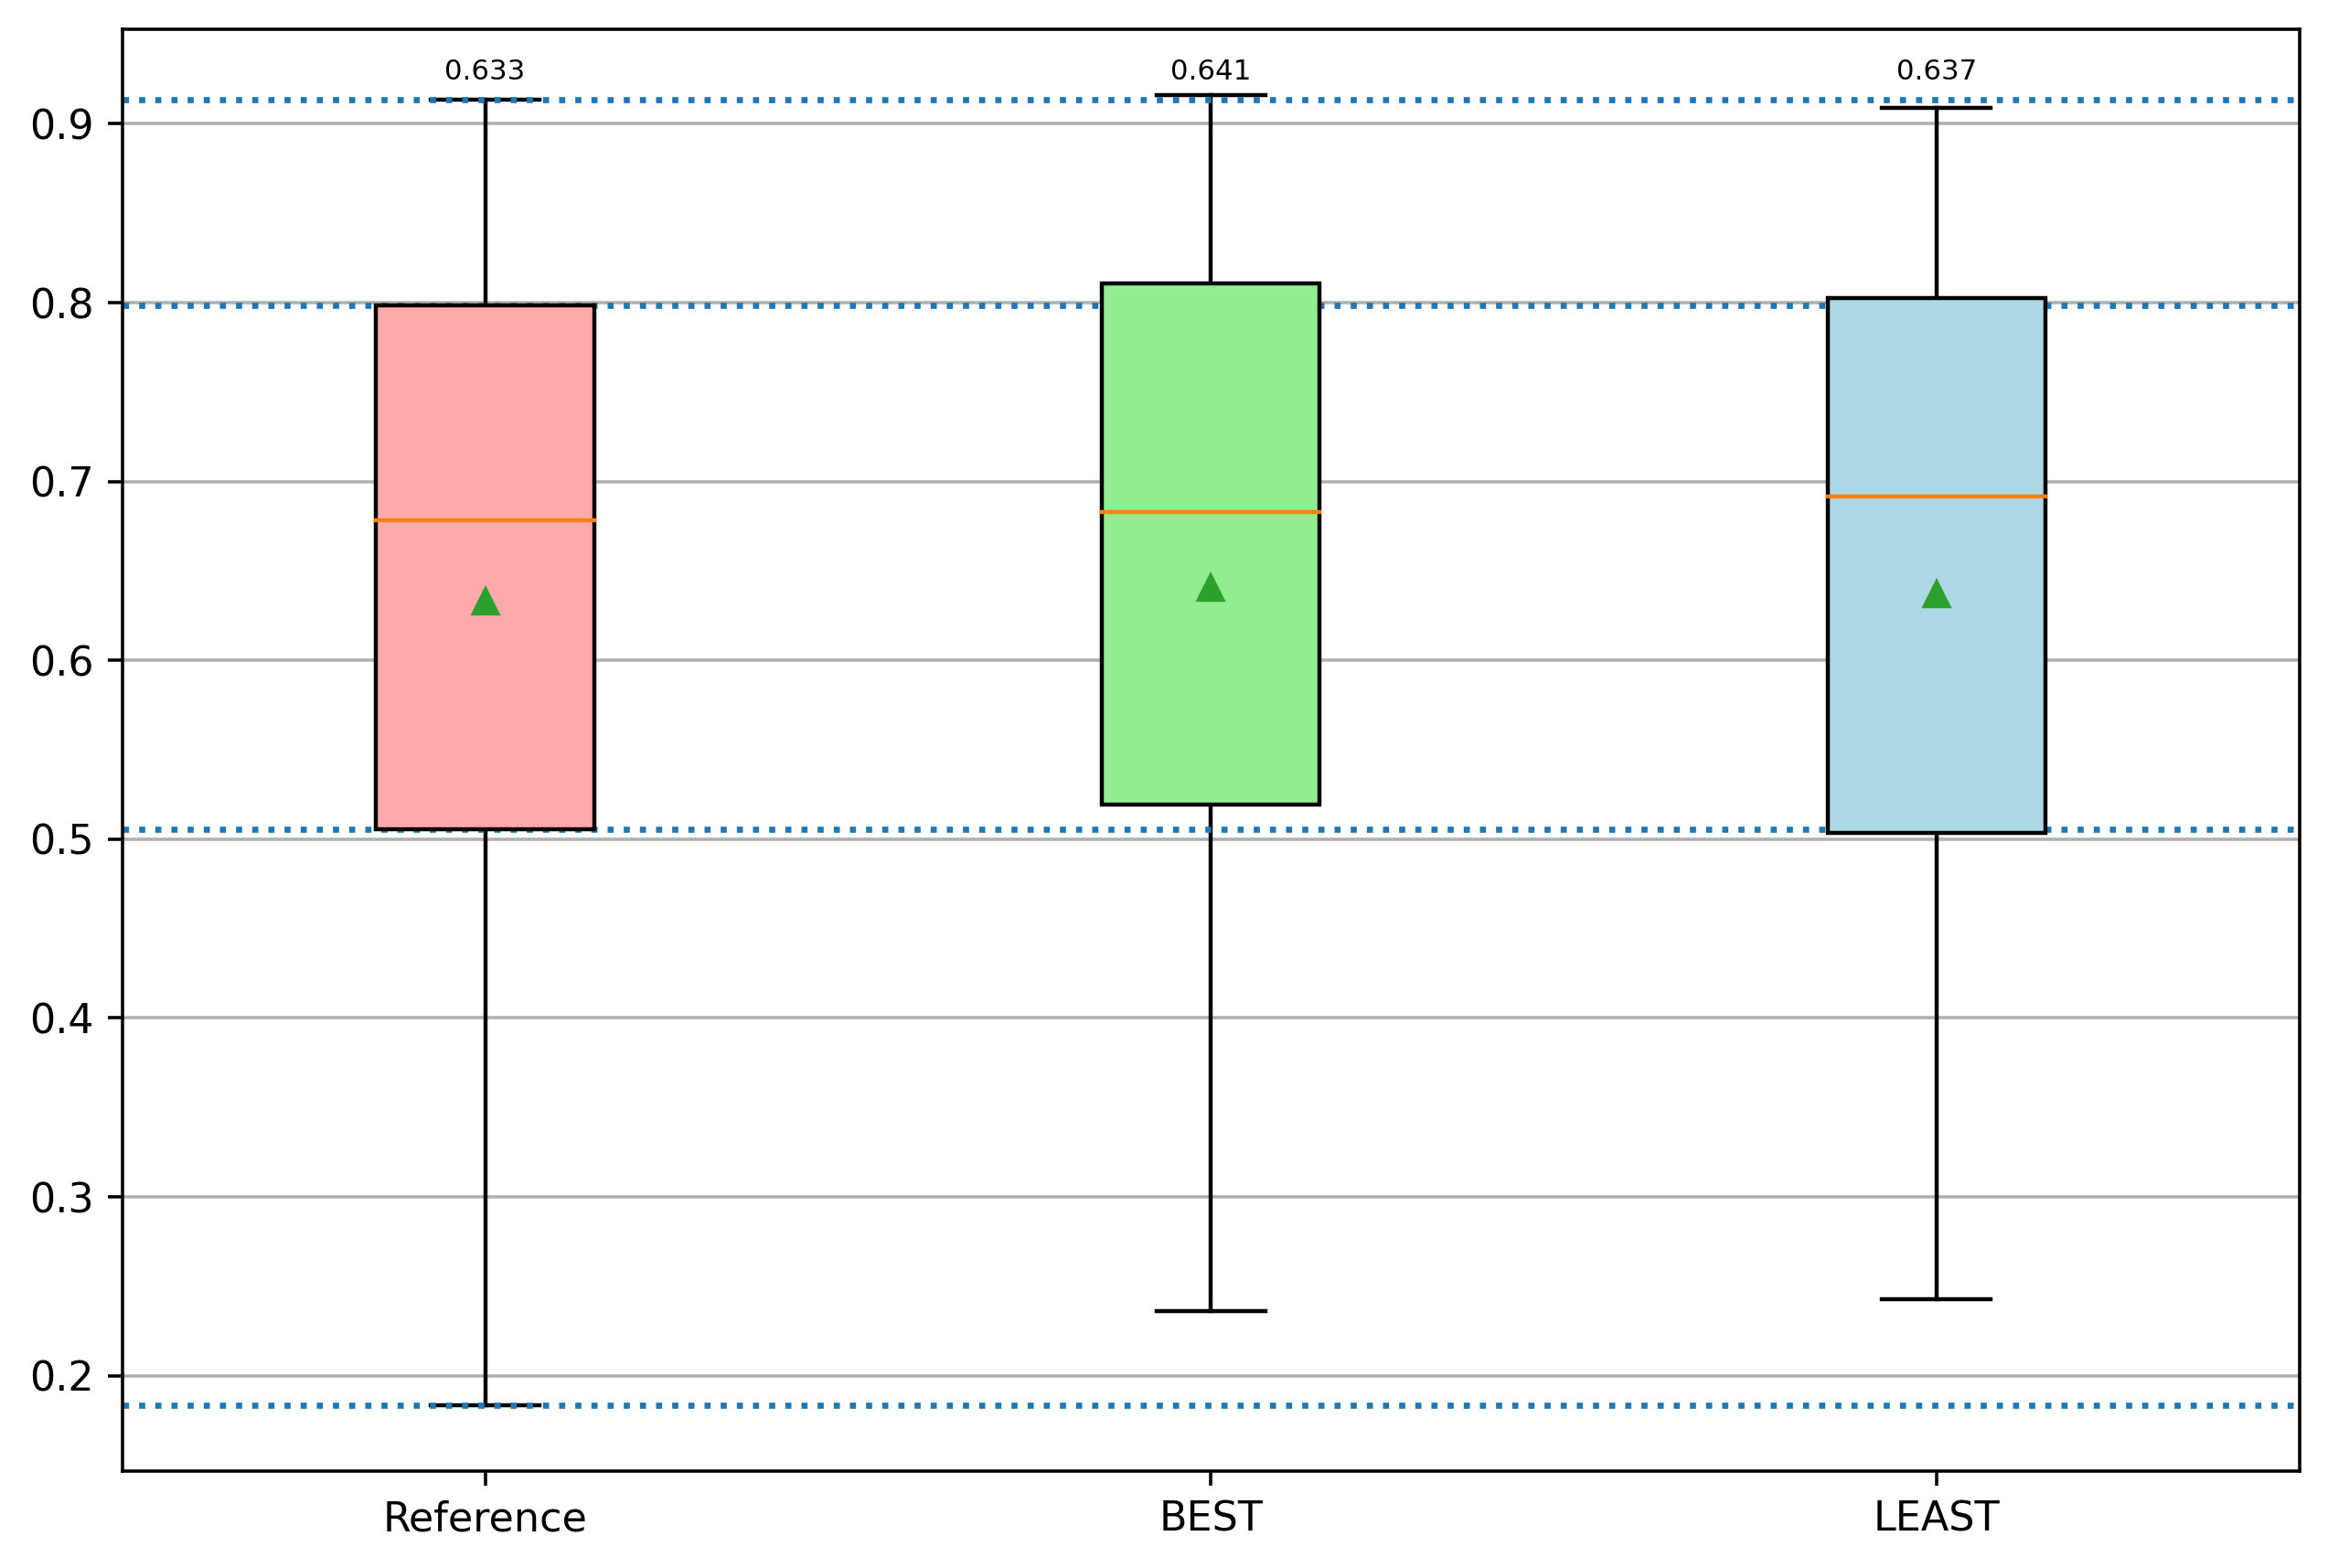
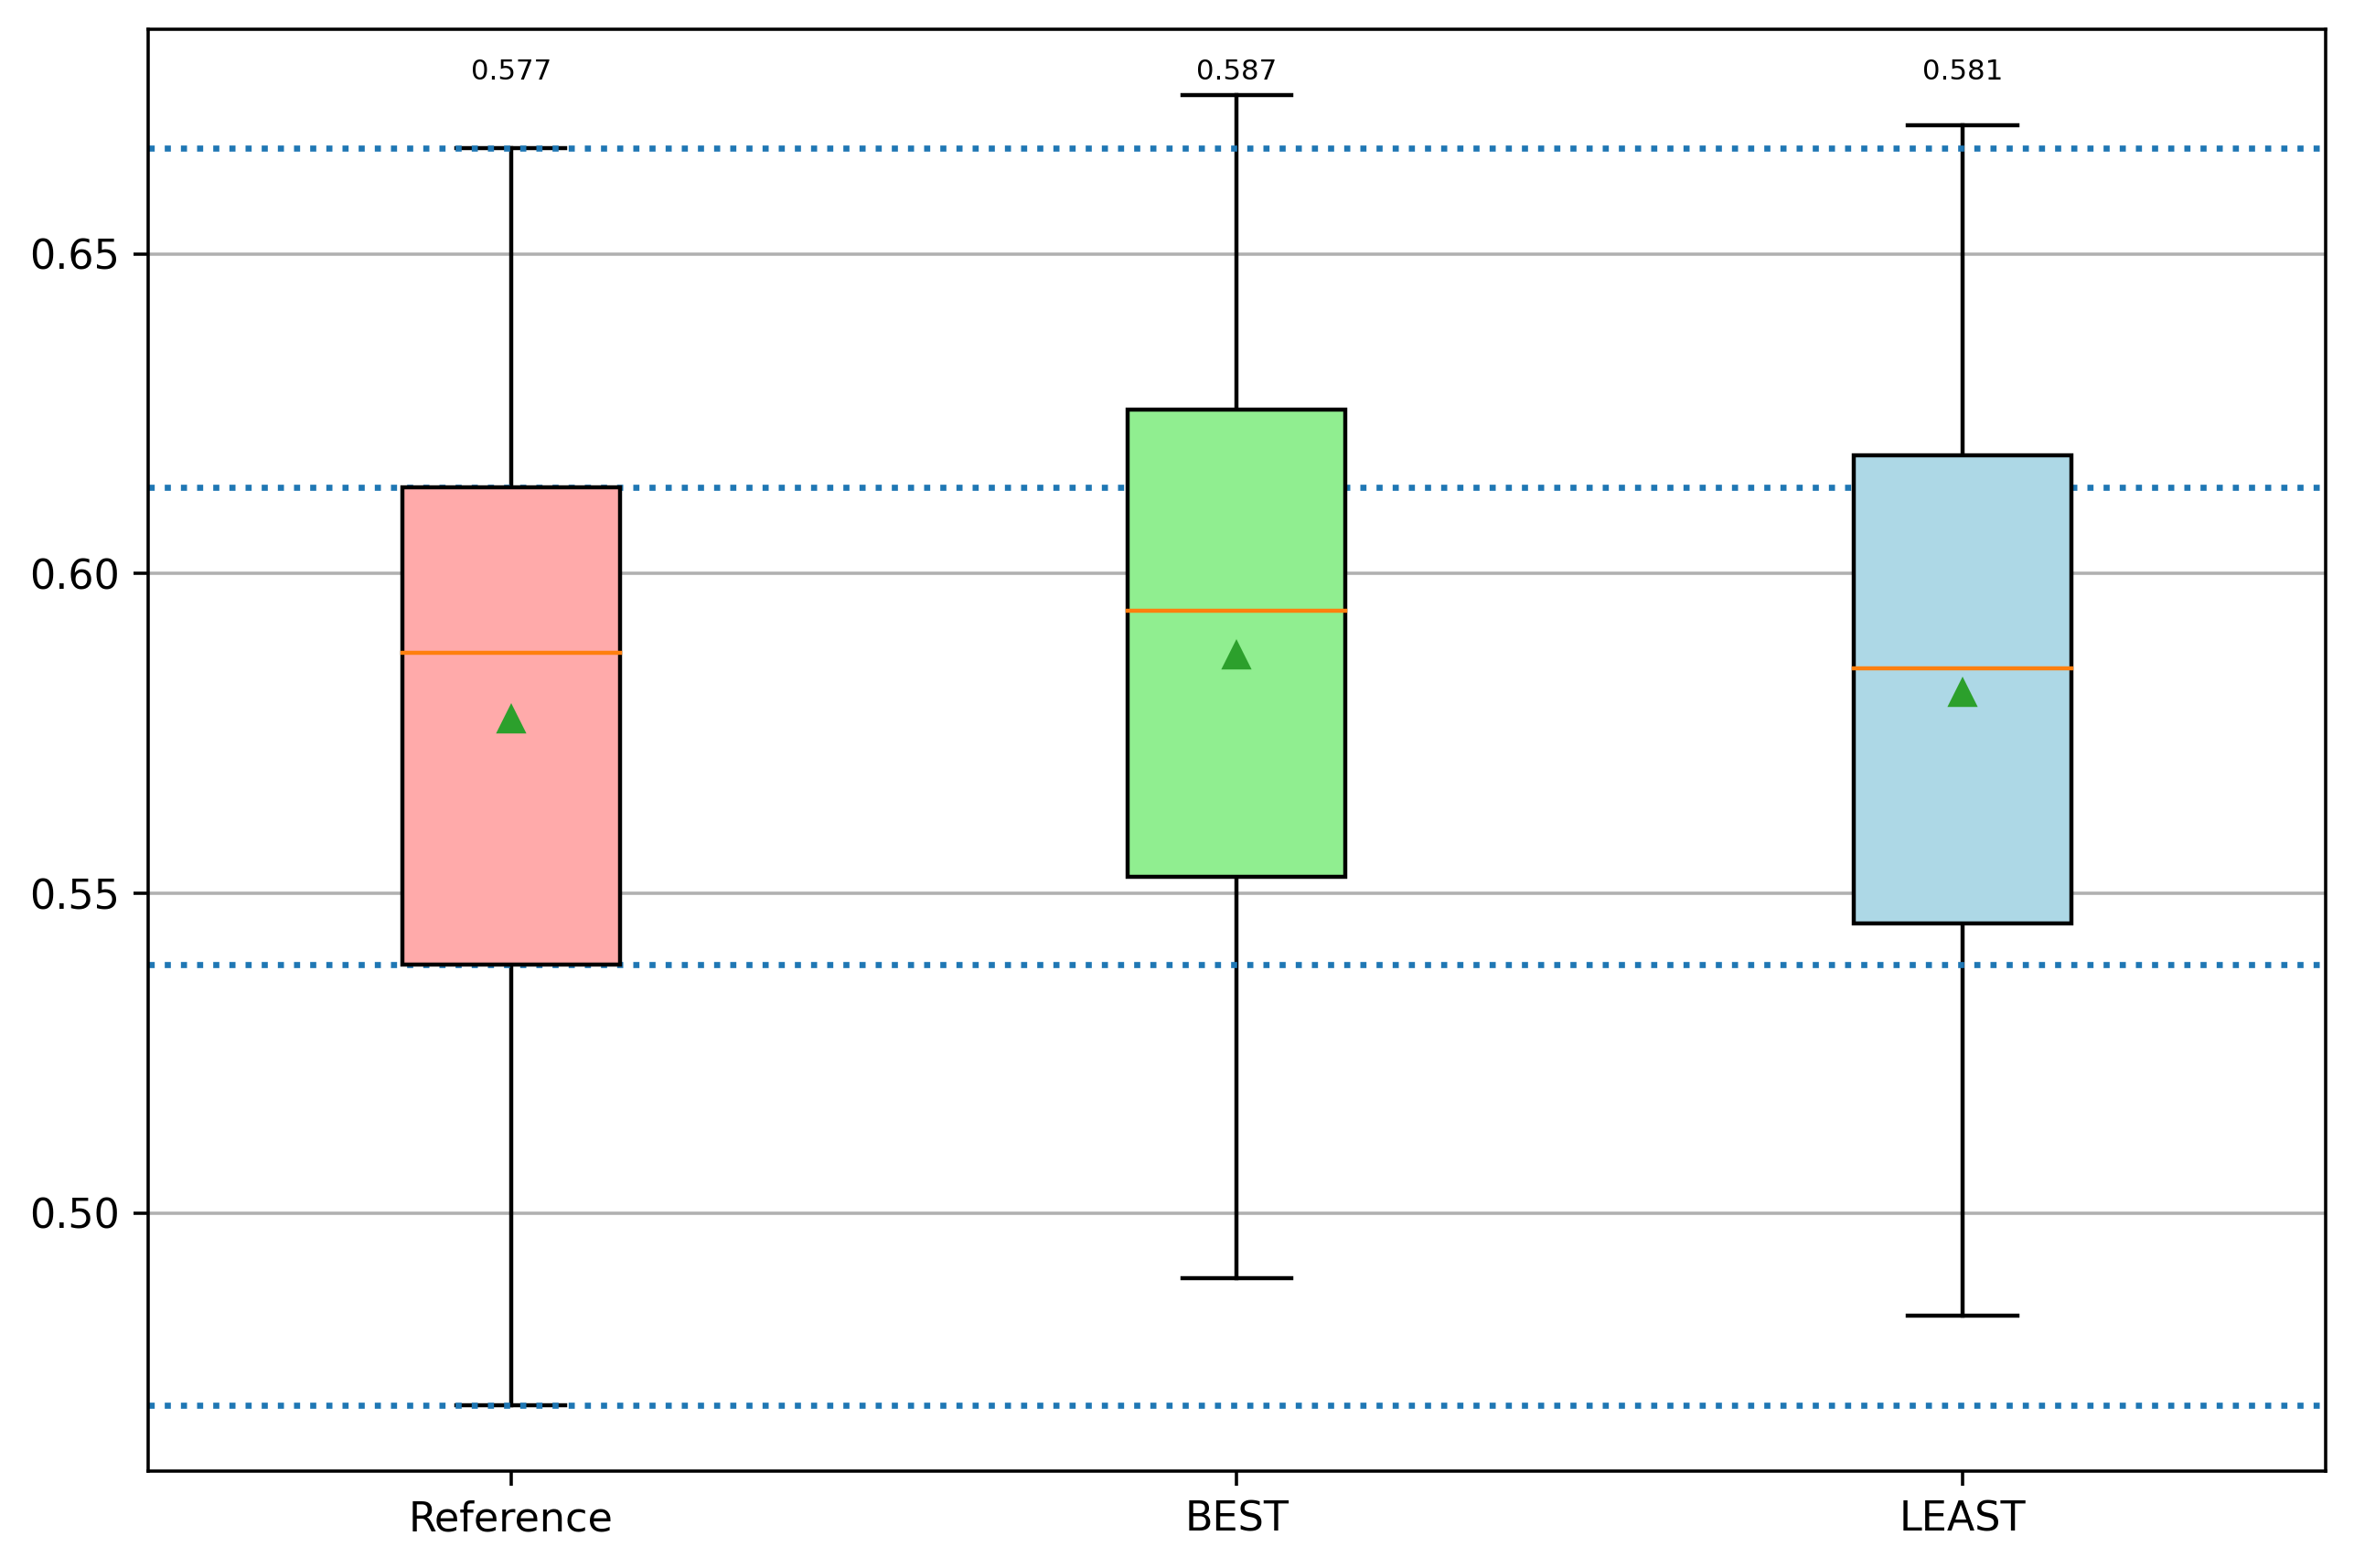
python main_draw_scores.py --cc False --reverse_sel False --dset test --region SC --model CNN10 --multirun 10
python main_draw_scores.py --cc False --reverse_sel True --dset test --region SC --model CNN10 --multirun 10- draw results of correlation-analysis-based predictor elimination
python main_draw_scores.py --cc True --reverse_sel False --dset test --region SC --model CNN10 --multirun 10- draw heatmaps
python main_draw_grads.py
python main_draw_cc.py
All plots will be saved in folder ./IMAGES.
Modify --multirun 10 to --multirun 1 for a quicker experiment, which will disable the multiple-run strategy.
Modify the arguments model to CNNdense, CNN1, CNN-FC, CNN-LM, CNN-PR to run experiments using other models.
Modify the arguments region to Yangtze to run experiments over reigon Yangtze River Basin. Note we also provide the well-prepared data for the region Yangtze in the given data download link.
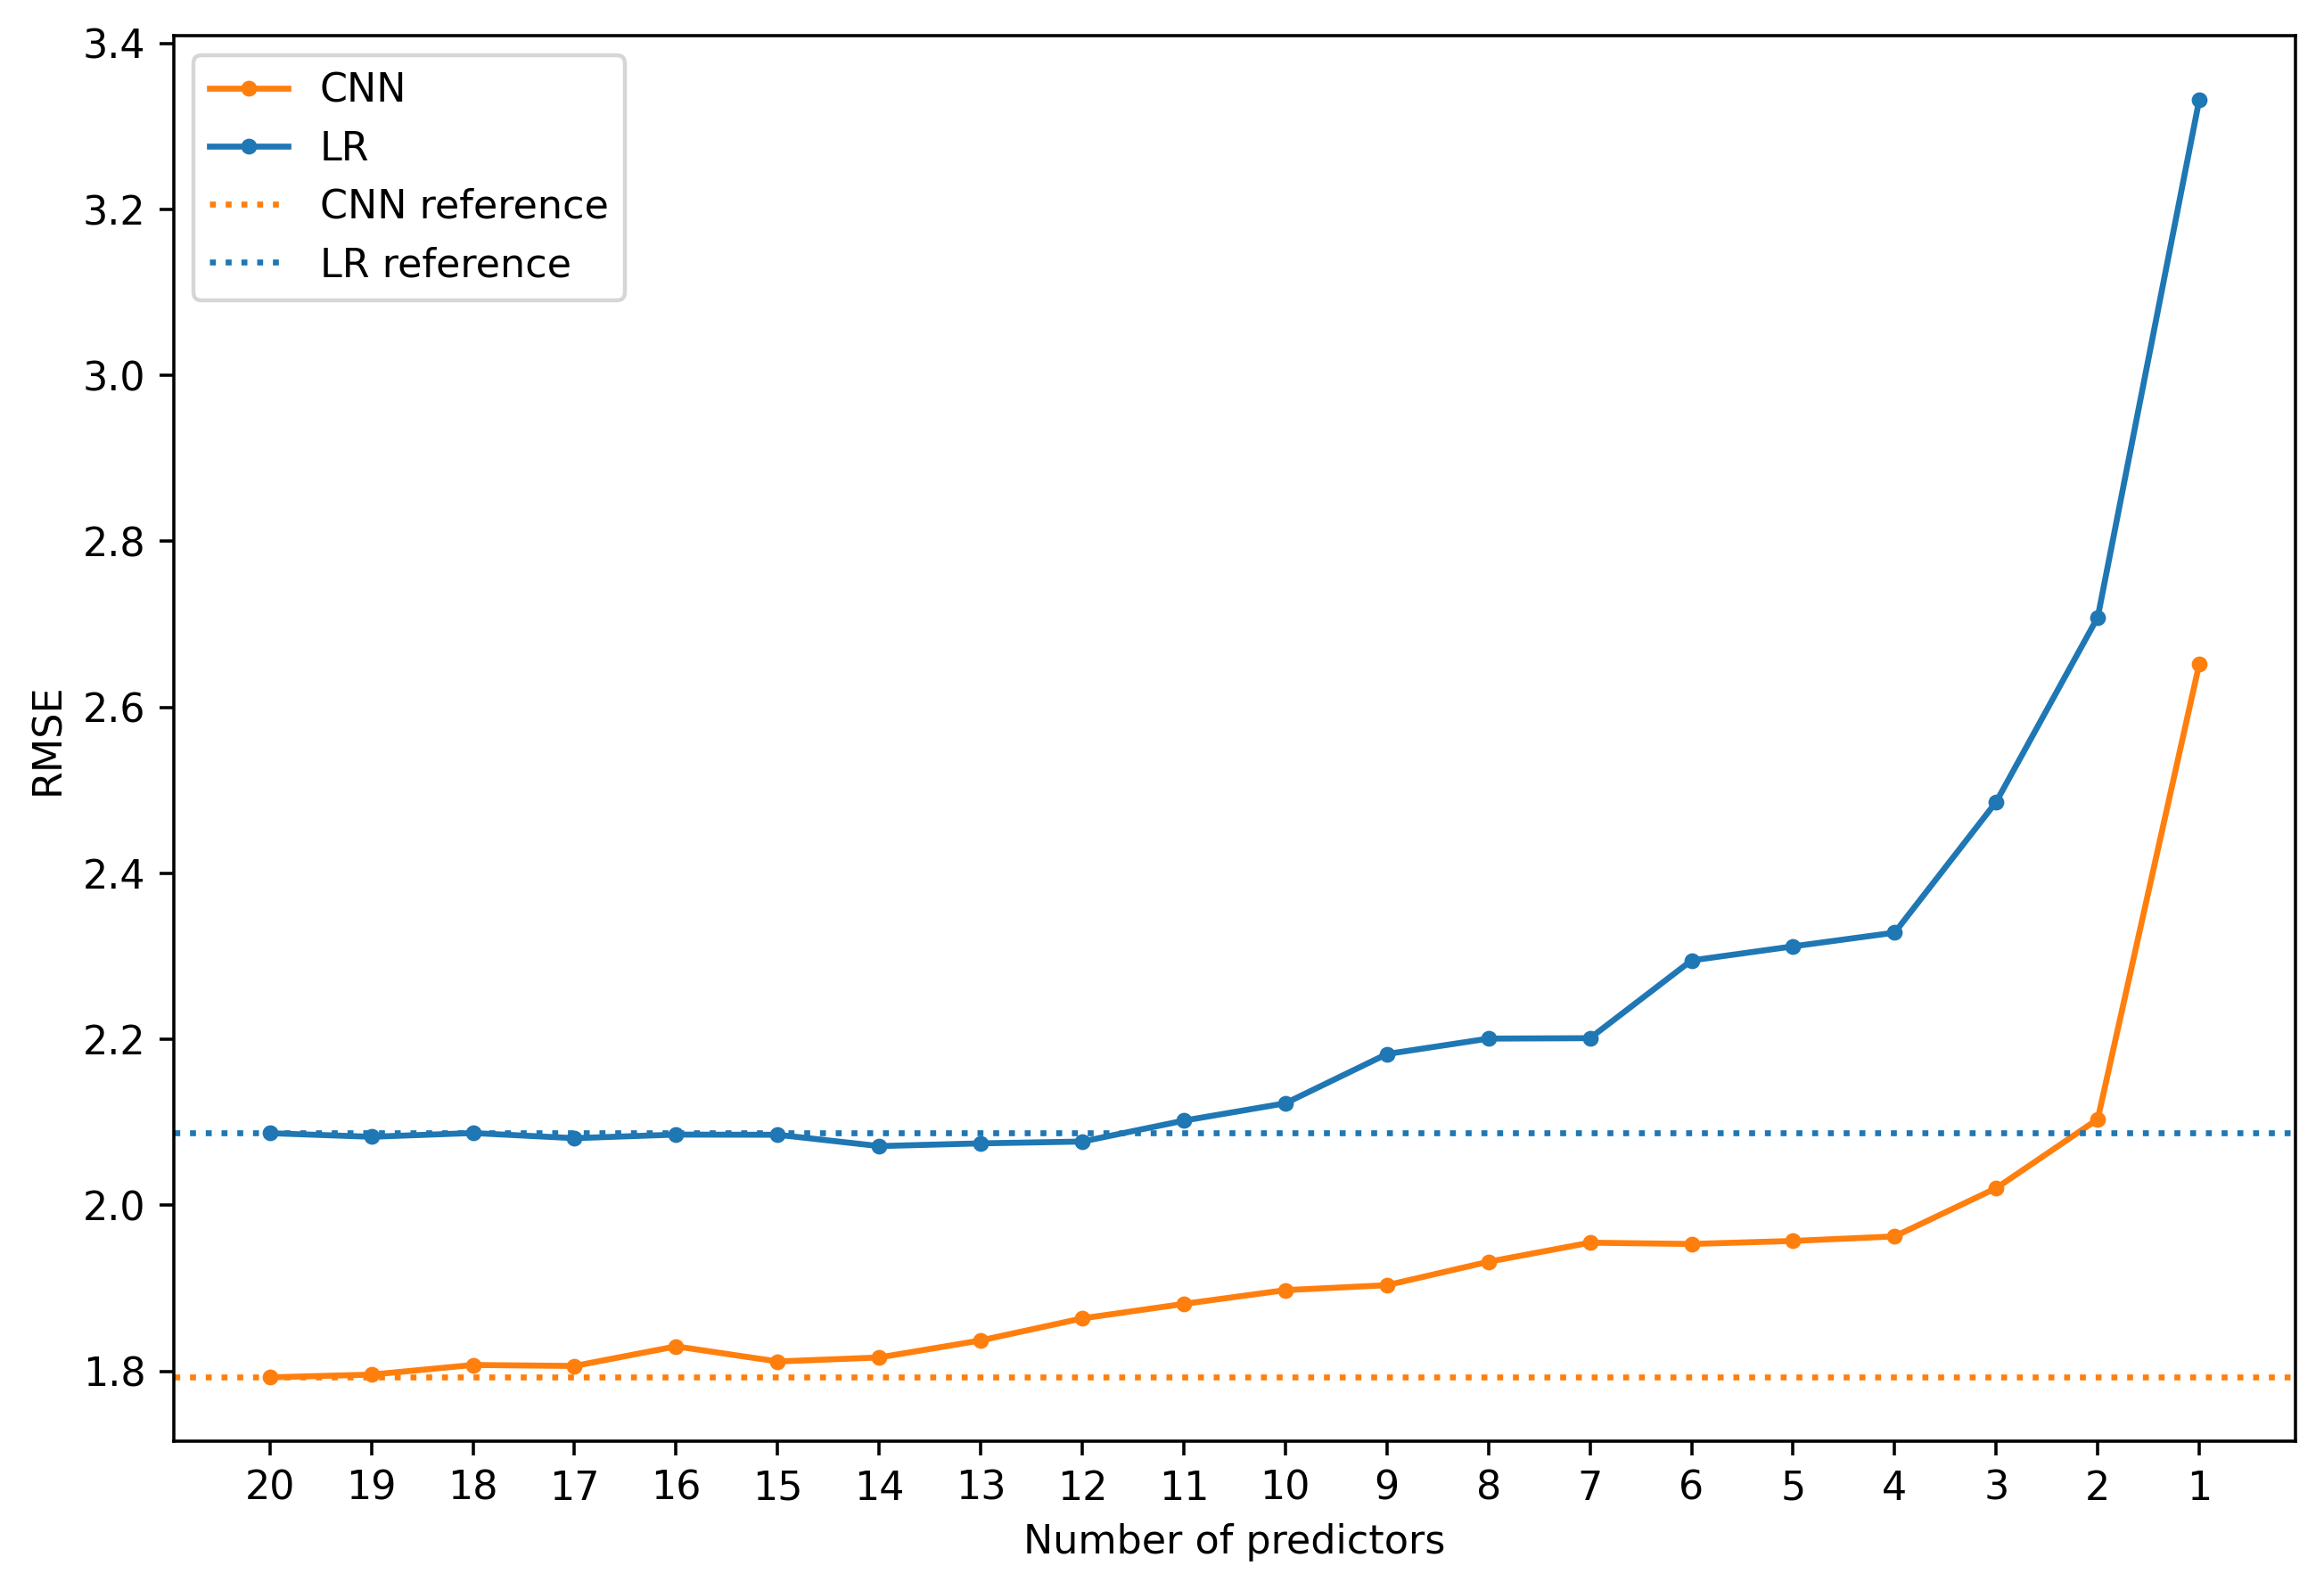
2.1. Plot results using main_draw_scores.py
| RMSE | CC | ATCC |
|---|---|---|
 |
 |
 |
| RMSE | CC | ATCC |
|---|---|---|
 |
 |
 |
ATCC & bias & box plots of bias
 |
 |
| RMSE | CC | ATCC |
|---|---|---|
 |
 |
 |
| RMSE | CC | ATCC |
|---|---|---|
 |
 |
 |
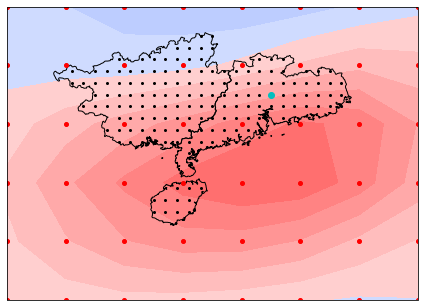
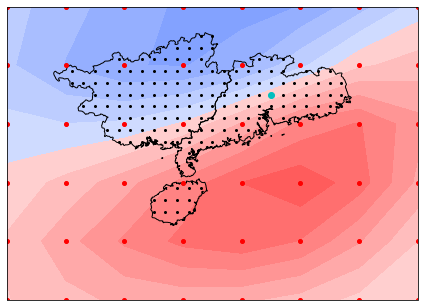
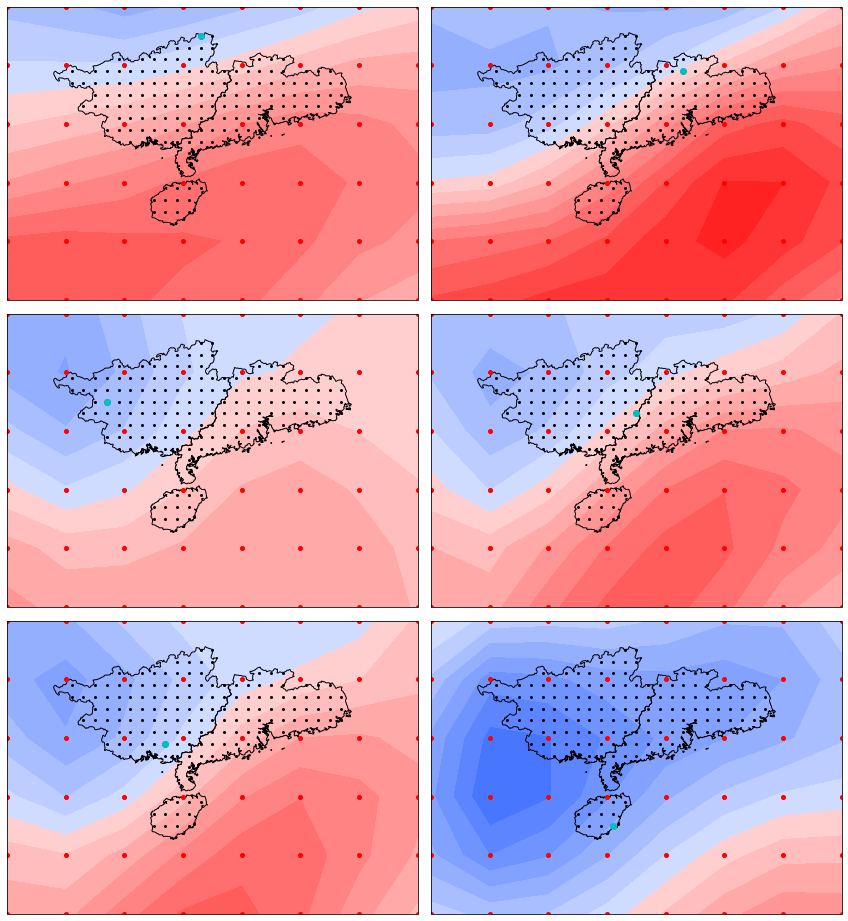
using main_draw_grads.py and main_draw_cc.py
See IMAGES_SAVED/GRADS/ and IMAGES_SAVED/CORR/ for heatmaps (.png) of more predictors
| GRAD | 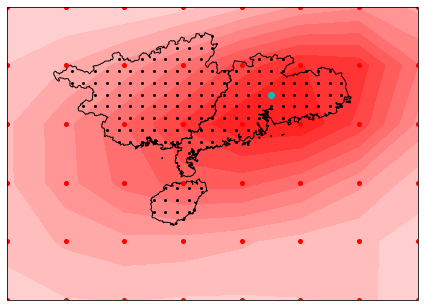 |
 |
 |
|---|---|---|---|
| CC | 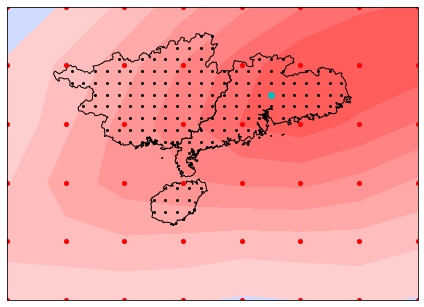 |
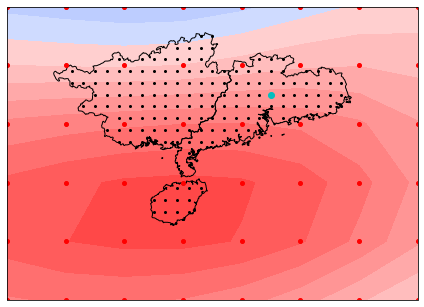 |
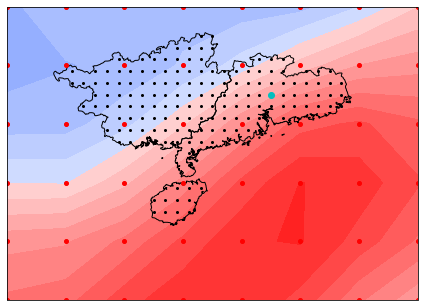 |
| shum500 | uwnd500 | vwnd1000 |
See IMAGES_SAVED/GRADS/ and IMAGES_SAVED/CORR/ for heatmaps (.gif)) of more predictors
| GRAD | 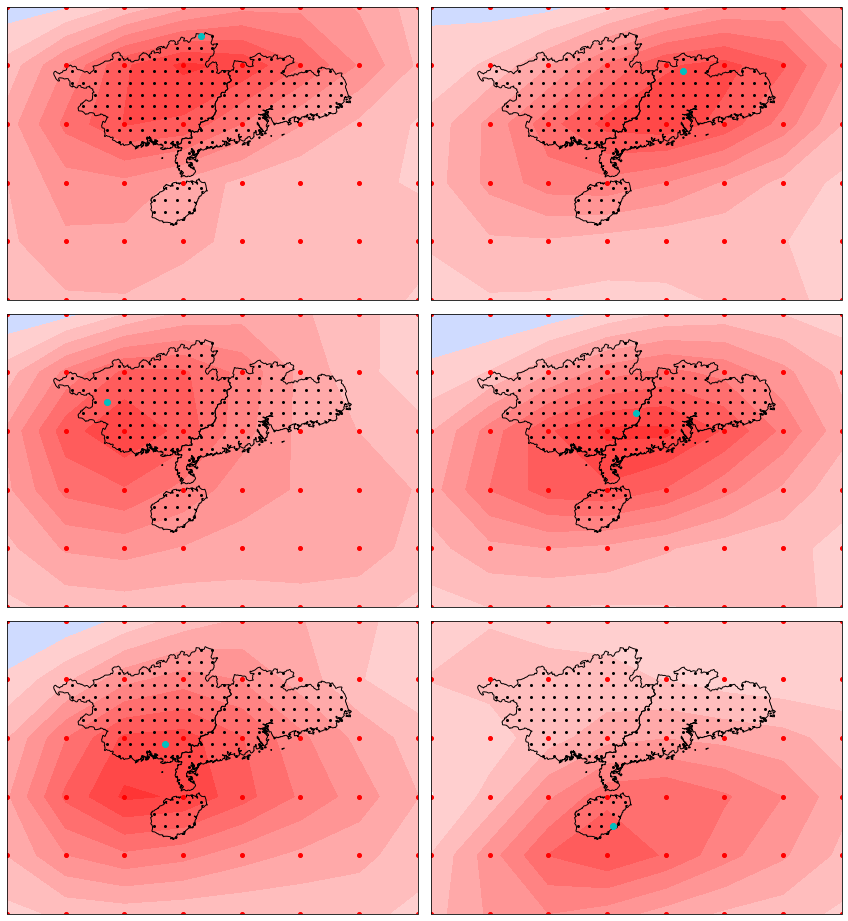 |
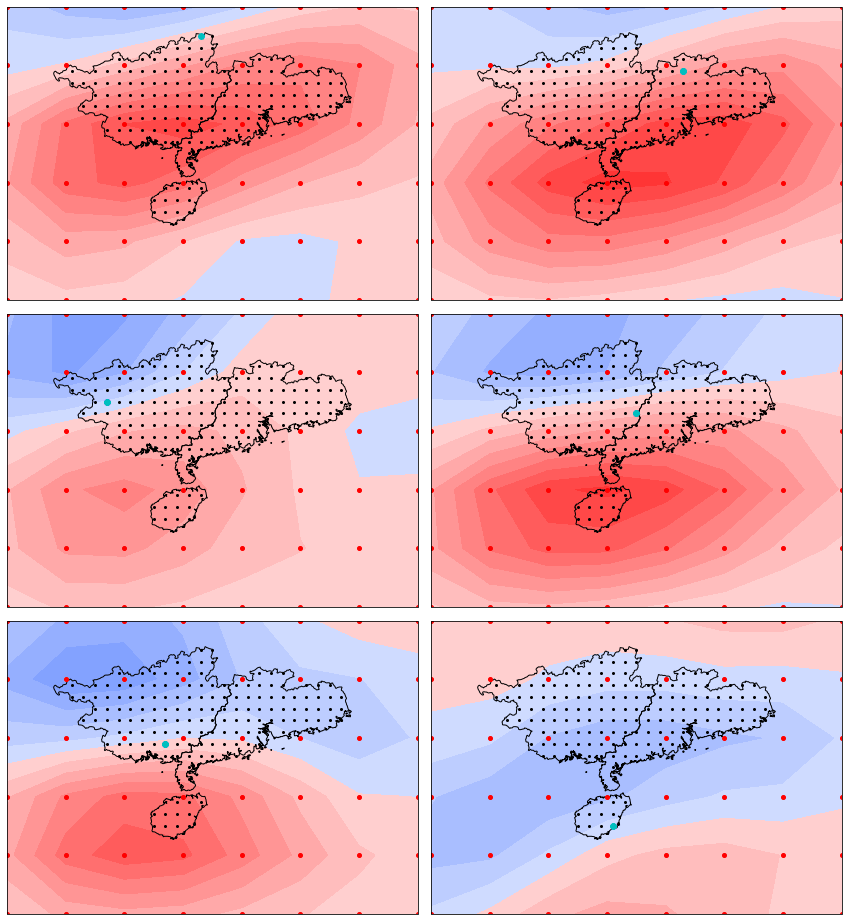 |
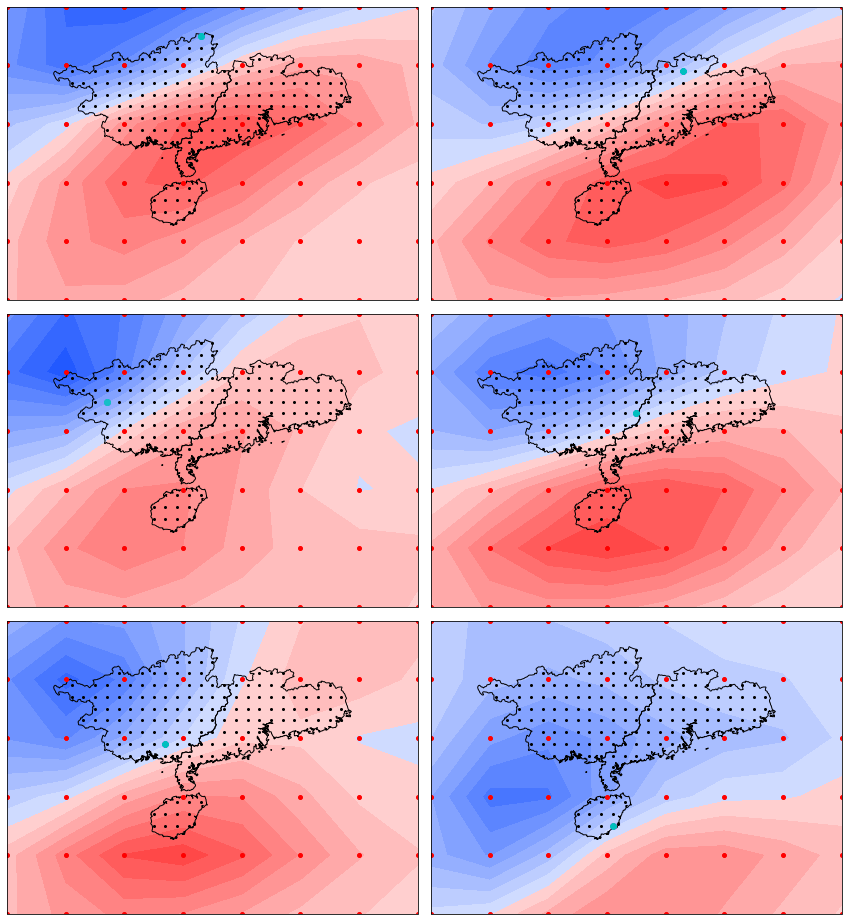 |
|---|---|---|---|
| CC | 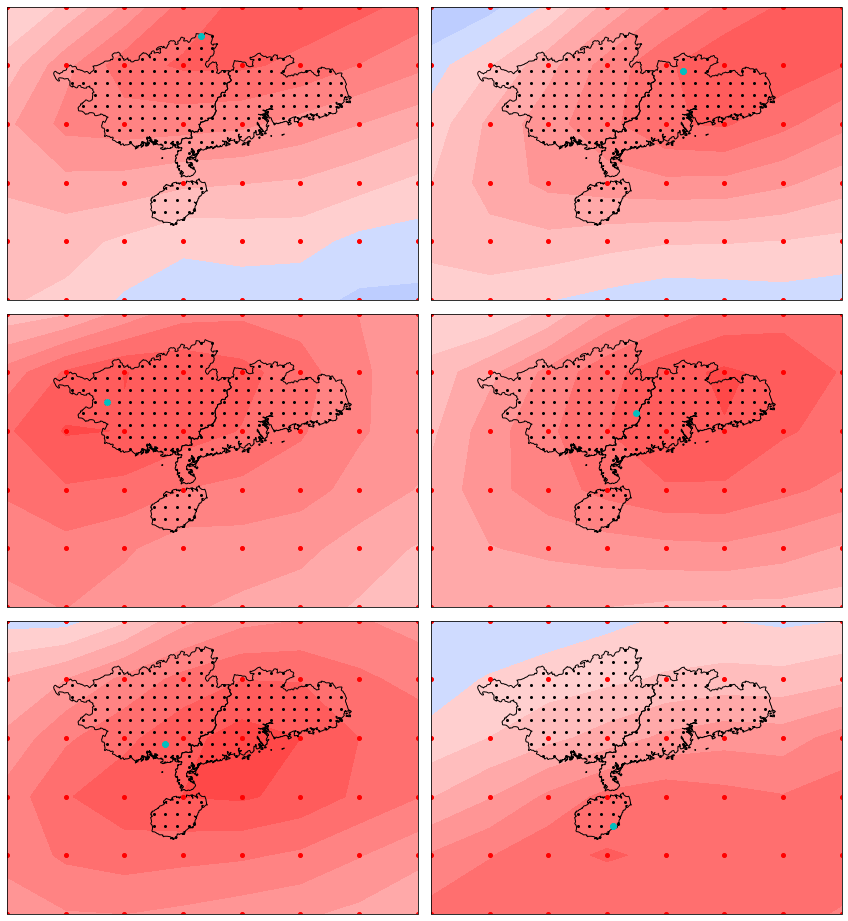 |
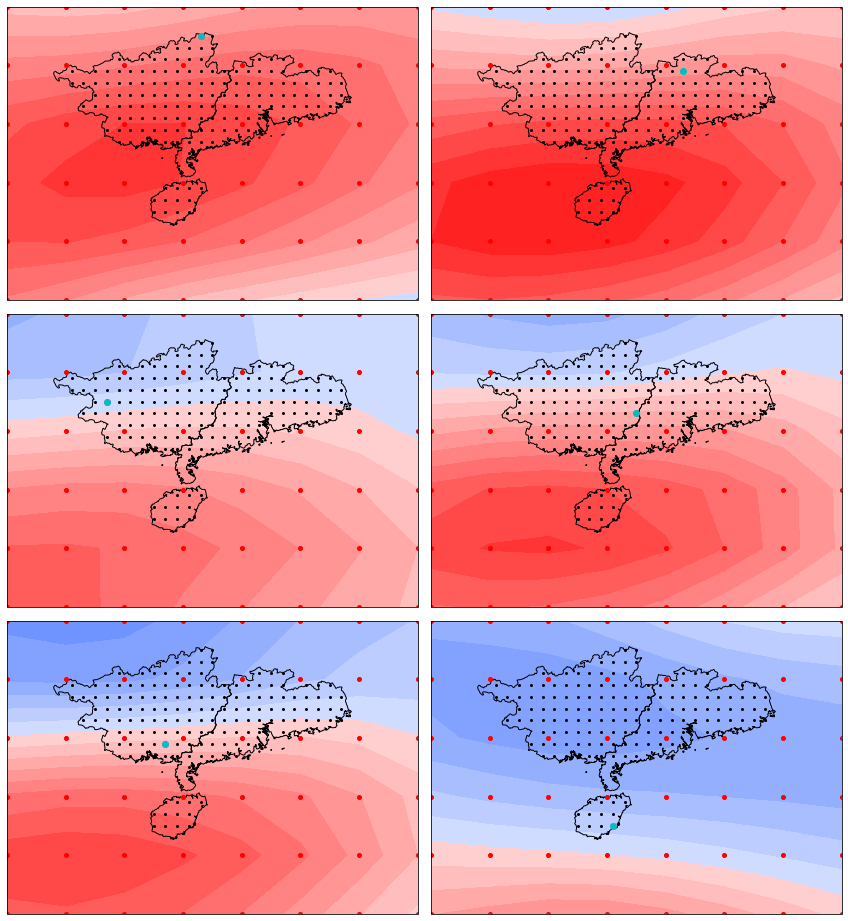 |
 |
| shum500 | uwnd500 | vwnd1000 |
Note: Scripts are the main entry of the programs that can perform certain tasks, such as main_data_preparation.py can be executed to prepare data; main_train.py is used to train the models without multiple-run; 'main_multirun.py' wraps main_train.py and main_eval.py to perform model train & evaluation with multiple-run support.
- Data preparation
- data_utils: packages for downloading, loading raw data and other processes
- main_data_preparation.py: script to load data for given regions
- Utilities
- utils.preprocessing.py: data preprocessing and anti-processing functions
- utils/dataset_splits.py: module to perform dataset split
- utils/get_rundirs.py: functions to fetch the directories according to given parameters (the trained models of different parameters are saved in directories in a regular way)
- utils/cli_utils.py: defined a function to check required argument list in CLI
- Selector
- selector.predictor_selector.py: predictor selector
- CNN model
- dataloader.py: dataloader module for Pytorch training
- model_wrapper.py: module to wrap all CNN archs together with pytorch_lightning
- trainer.py: module to train the CNN, implementing based on pytorch_lightning and hydra
- main_train.py: Script of CLI that execute CNN trainer with given parameters
- predict.py: A module to run prediction on given raw input data, as well as model and its metadata
- score.py: A module to compute scores of prediction
- weights_attribution.py: Module to attribute weights to different predictors
- main_eval.py: Script to run prediction, evaluation and other processes for trained CNN models, all intermediate results will be saved for latter use
- main_multirun.py: Script for multiple-run strategy, that is run the training and evaluation for multiple times
- Linear regression
- predict_ml.py: Module to predict and combine grid-wise predictions using linear regression models
- main_ml.py: Script for fitting, prediction, evaluation of linear regression models
- Program
- main_select.py: Script CLI wrapping all the routines of predictor selection on CNNs
- main_select_cc.py: Script CLI wrapping all the routines of predictor selection using correlation analysis method on CNNs
- Plot
plotspackage- plots/agg_scores.py: Module for aggregating and averaging scores over models of multiple-run.
- plots/draw_boxplot.py: Module for drawing box plots
- plots/draw_dist.py: Module for drawing geographic distribution
- main_draw_scores.py: Script for drawing RMSE, ATCC, CC scores in line, distribution and box plots.
- main_draw_grads.py: Script for drawing heatmaps of gradients of predictors, the results are .png and .gif images.
- main_draw_cc.py: Script for drawing heatmaps of correlation coefficients between predictors and grid precipitation, the results are .png and .gif images.
The K-fold cross-validation is implemented in train and eval processes.
The Multiple-run strategy is implemented in main_multirun.py by executing the train and eval multiple times. Automatic runs counting is supported.
- Anaconda (numpy, pandas, etc.)
- hydra-core
- xarray
- pytorch
- pytorch-lightning
- fire
- coloredlogs, prettytabble
- xskillscore
- cmaps
- geopandas