This program simulates the results of the Swiss System for the League of Legends (LoL) Season 13 (S13). The Swiss system is a common format in eSports and traditional sports tournaments, especially when a large number of teams need to be narrowed down to a select few.
To determine the strength and win probability of each team, this simulation uses the ELO rating mechanism. Each team starts with a given ELO, which represents their initial strength. After each matchup, the teams' ELO ratings get updated based on the outcome and the ELO difference between the teams.
ELO rating system is a method to calculate the relative skill levels of players. In our simulation, it's used to estimate the strength and win probability of each team.
ELO Score Update Formula: [ \text{New ELO}{\text{A}} = \text{Old ELO}{\text{A}} + K \times (\text{Result}{\text{A}} - \text{Expected Result}{\text{A}}) ] Where:
- (\text{New ELO}_{\text{A}}) is the updated ELO score for team A.
- (\text{Old ELO}_{\text{A}}) is the previous ELO score for team A.
- (K) is a factor that determines the maximum change in rating (which can be adjusted based on the difference in ELO scores between the two teams, as defined in the function
get_k_value). - (\text{Result}_{\text{A}}) is the actual result of the match (1 for a win, 0.5 for a draw, and 0 for a loss).
- (\text{Expected Result}_{\text{A}}) is the expected result for team A against team B, calculated using the win probability formula below.
Win Probability Formula: [ P(\text{A wins}) = \frac{1}{1 + 10^{\frac{\text{ELO}{\text{B}} - \text{ELO}{\text{A}}}{400}}} ] Where:
- (P(\text{A wins})) is the probability of team A winning against team B.
- (\text{ELO}{\text{A}}) and (\text{ELO}{\text{B}}) are the ELO scores of team A and team B respectively.
In ELO systems, the K-factor determines the magnitude of ELO adjustments after each match. A higher K-value results in larger rating changes. In this simulation, the K-factor dynamically adjusts based on the ELO difference between the two teams. This ensures that upsets (where a lower-rated team beats a higher-rated team) have a more significant impact on ratings.
The dynamic adjustment is implemented as (you can change it by yourself):
def get_k_value(elo_diff):
    if elo_diff > 400:
        return 64
    elif 200 <= elo_diff <= 400:
        return 48
    elif 100 <= elo_diff <= 200:
        return 32
    else:
return 24Several plots have been generated to help visualize the results of the simulation:
-
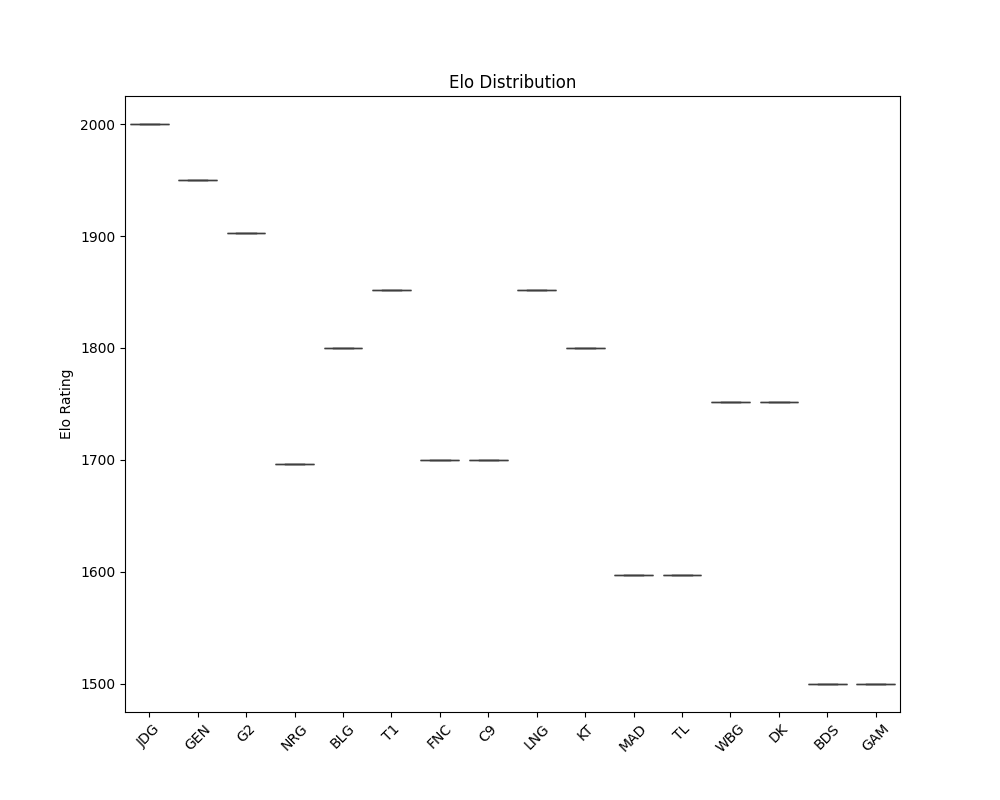
ELO Distribution (
figs/elo_distribution.png): Displays the distribution of ELO scores for all teams at the end of the simulation. -
Histogram of Wins (
figs/histogram.png): Represents the qualified possibility for each team. -
Pie Chart of Wins and Losses (
figs/pie_chart.png): Illustrates the proportion of qualified probability for each team. -
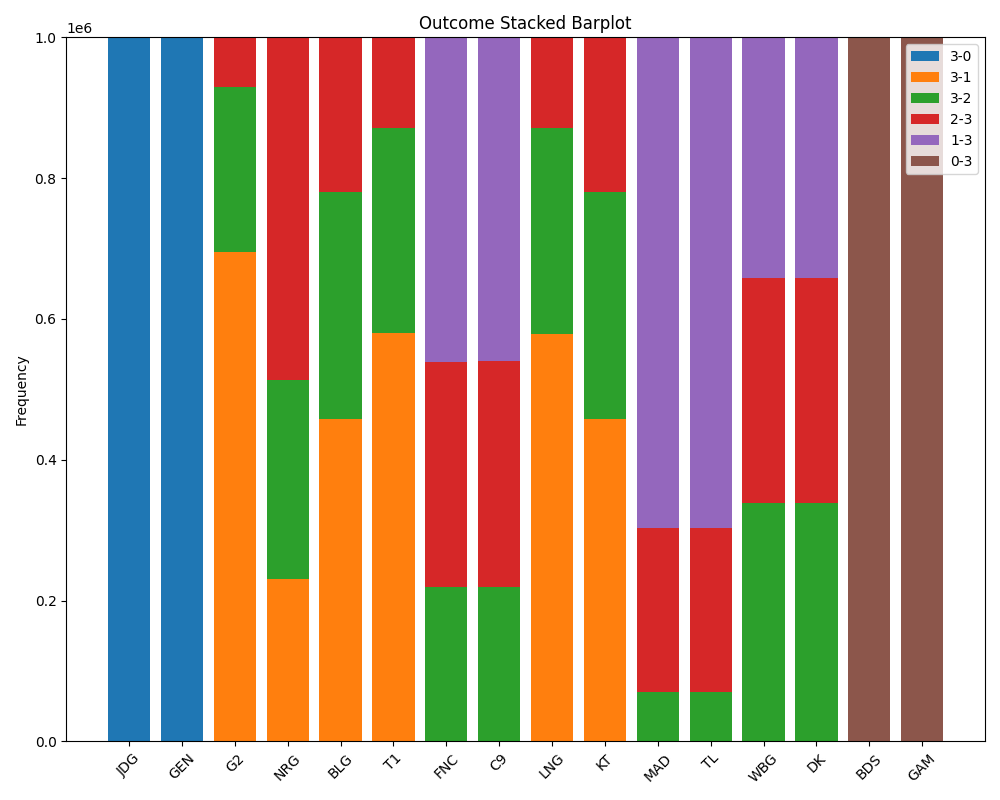
Stacked Barplot (
figs/stacked_barplot.png): Visualizes the win-loss ratio for each team in a barplot. -
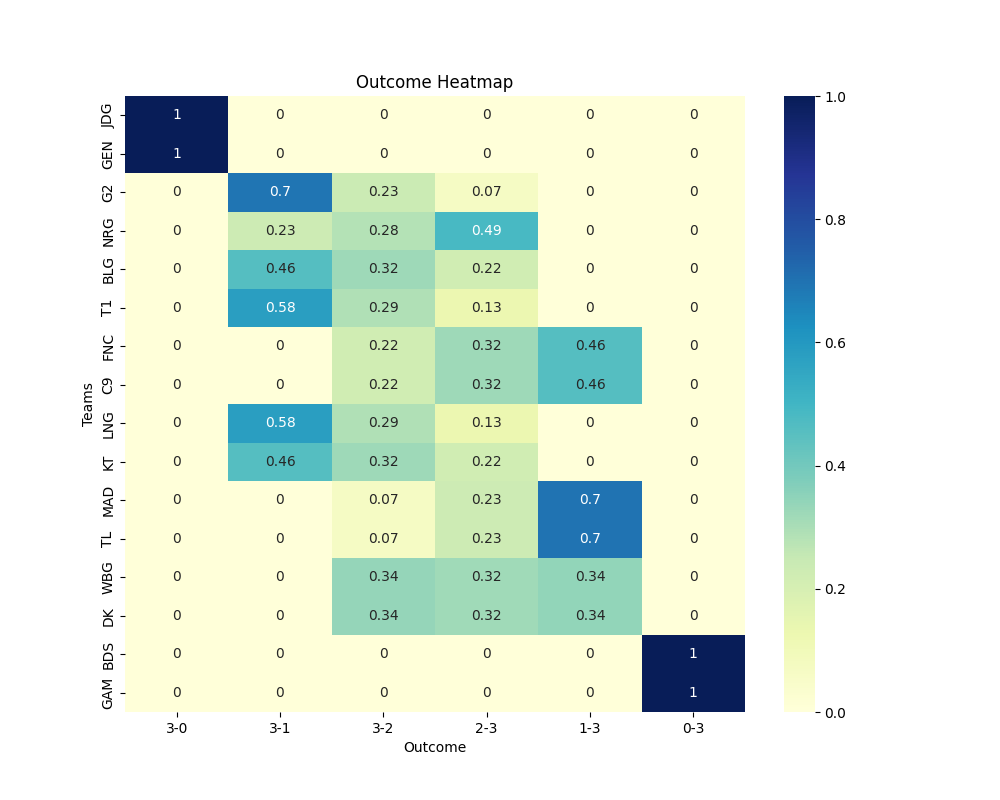
Win-Loss Heatmap (
figs/win_loss_heatmap.png): Visualizes the win-loss ratio for each team in a heatmap. -
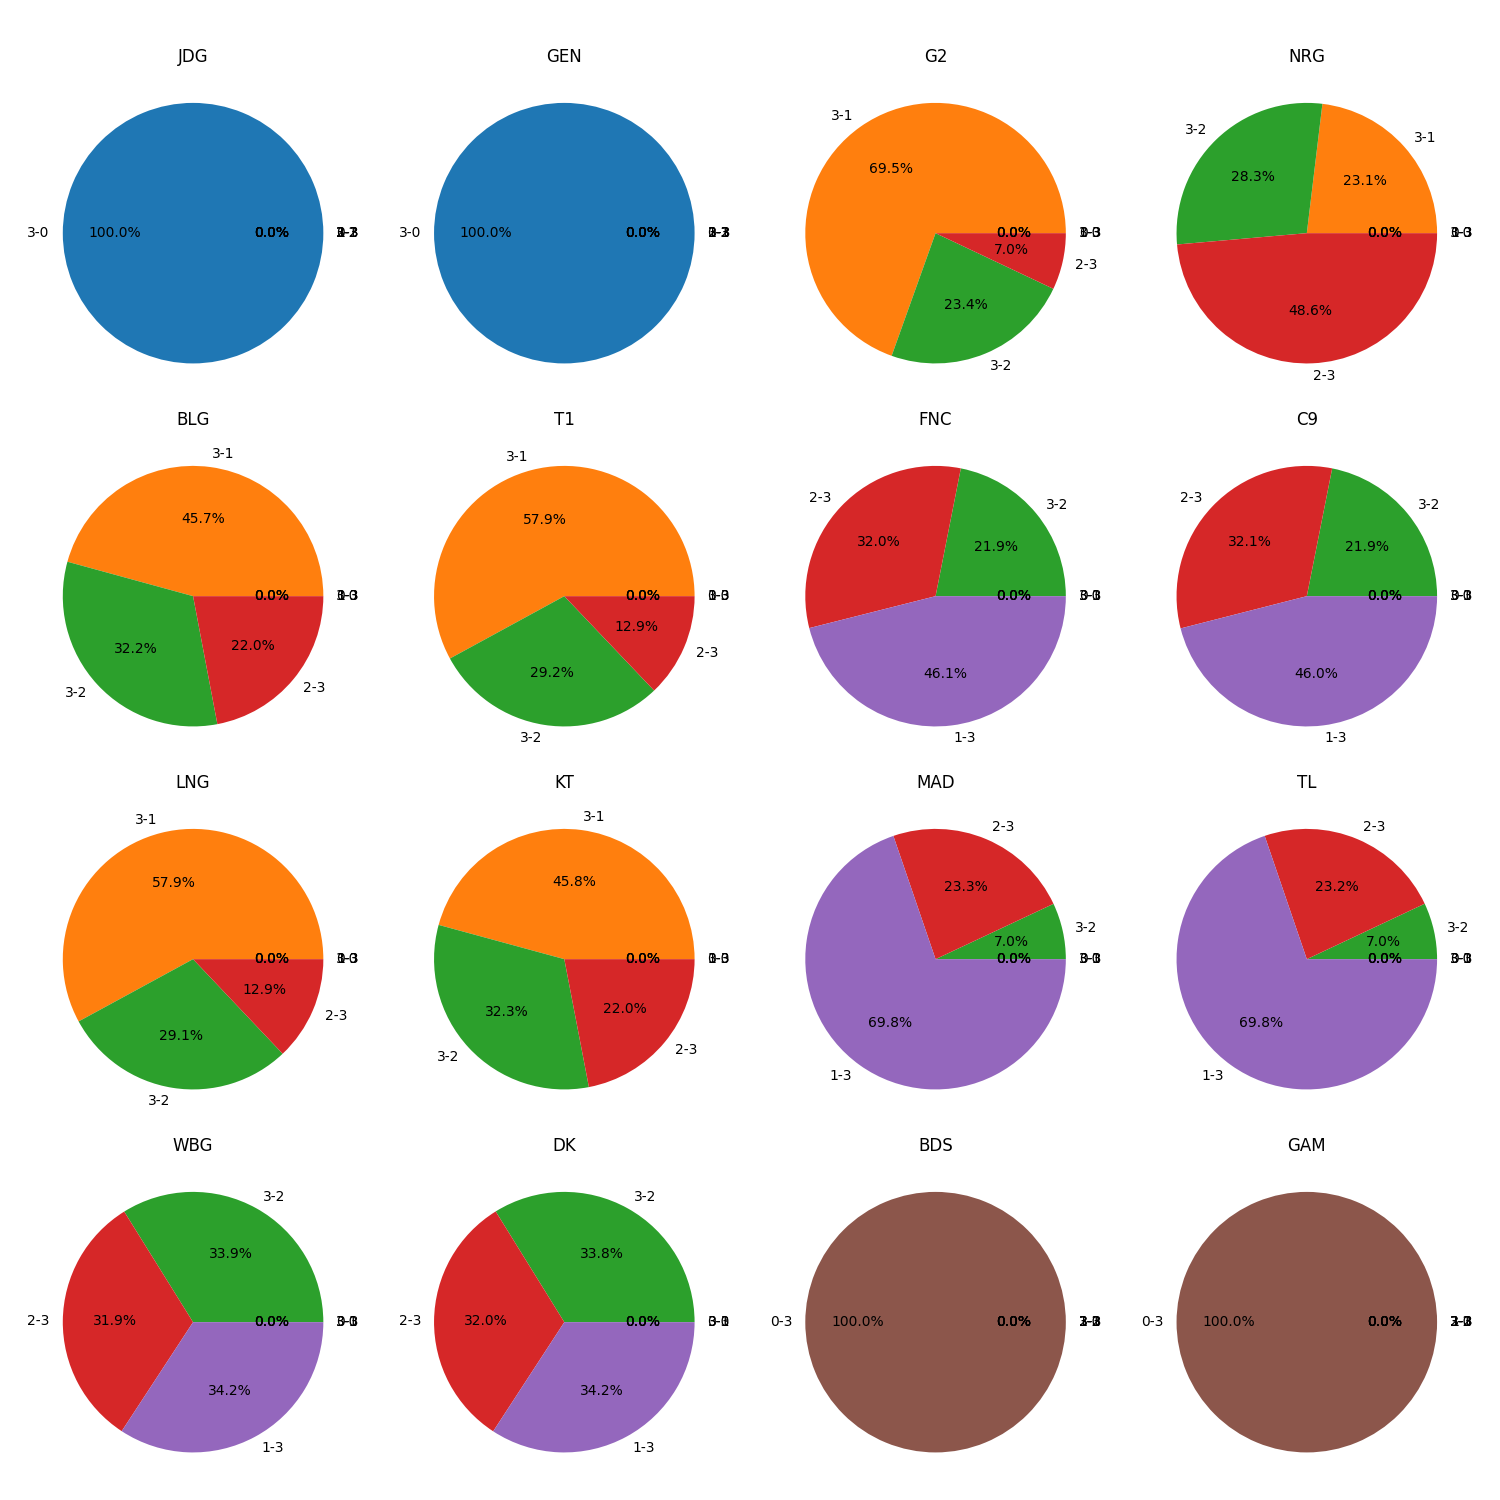
Win-Loss Pie Charts (
figs/win_loss_pie_charts.png): Visualizes the win-loss ratio for each team in a series of pie charts. -
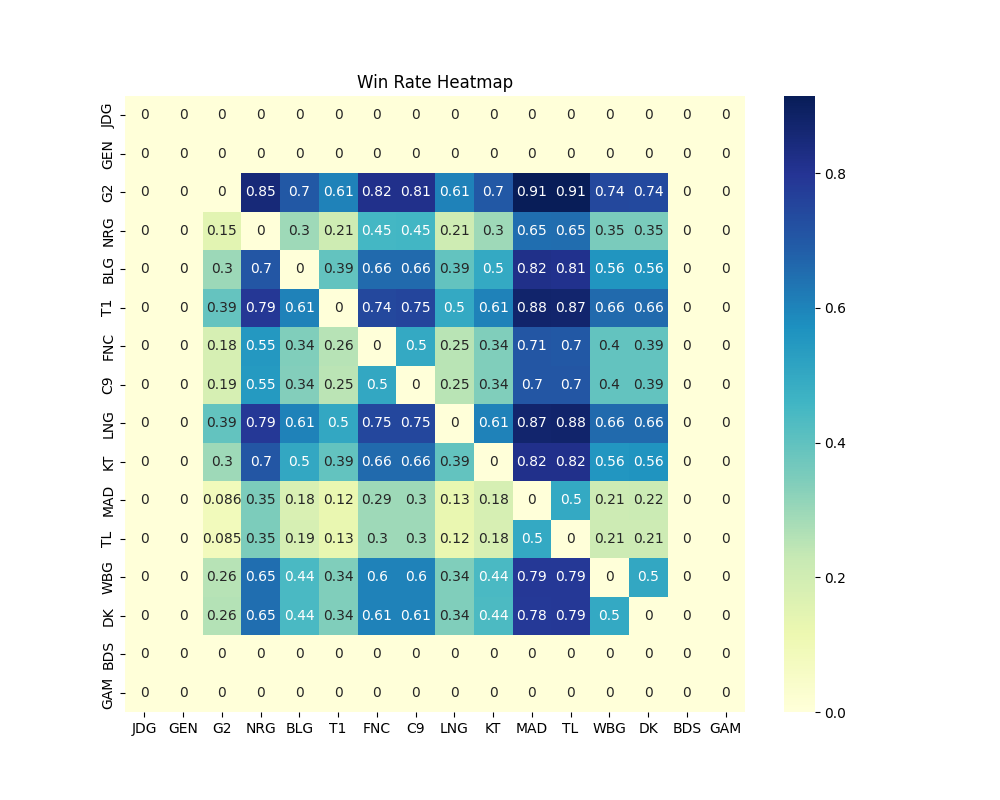
Win Rate Heatmap (
figs/win_rate_heatmap.png): Provides a heatmap representation of each team's win rate against every other team.
This simulation offers insights into how the Swiss System can unfold for LoL S13 based on the ELO rating mechanism. It provides a deeper understanding of the dynamics of matchups and helps to anticipate possible outcomes. Note that, while informative, these are simulated results, and real-world outcomes can vary based on a multitude of factors.
