| description |
|---|
Introduction to F2 |
F2 is a powerful mobile data visualization solution, pure in javascript. F2 is based on the grammar of graphics, and it is light-weighted, high-performance and easily expandable. Also, F2 charts are well designed for mobile.
TODO: website and demos' page
TODO: show some charts images here
Special thanks to Leland Wilkinson, the author of The Grammar Of Graphics, whose book served as the foundation for F2 and G2.
- Elegant user experience: Designed for mobile experience
- Flexible: Customizable shapes and animations, flexible charting components, infinite creativity
- High performance: F2 pursues the ultimate performance for drawing, lots of optimization have been done for mobile devices
- Light-weighed: F2 maintains a compact code size while supporting more than 45 kinds of charts
- F2 on Node.js :https://antv.alipay.com/zh-cn/f2/3.x/tutorial/node-env.html
- TODO: other runtime
$ npm install @antv/f2<canvas id="c1"></canvas>
import F2 from '@antv/f2';

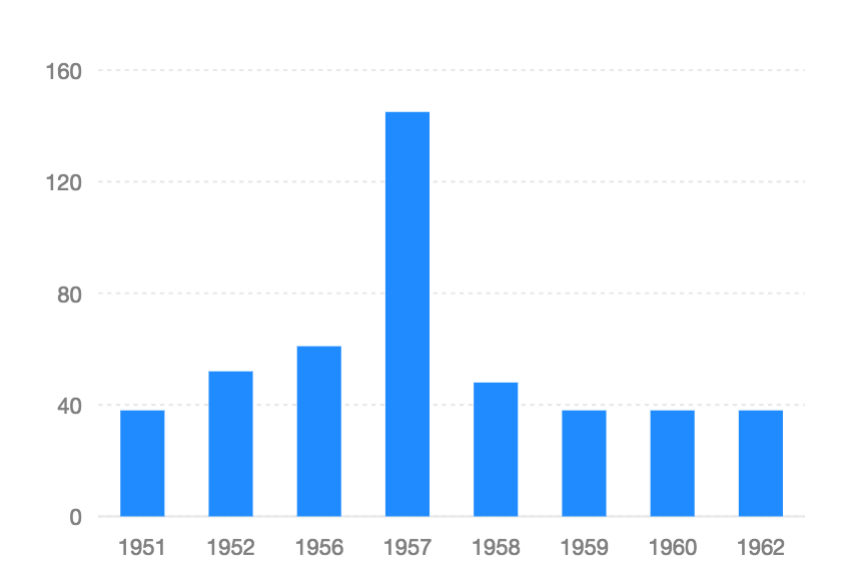
const data = [
  { year: '1951', sales: 38 },
  { year: '1952', sales: 52 },
  { year: '1956', sales: 61 },
  { year: '1957', sales: 145 },
  { year: '1958', sales: 48 },
  { year: '1959', sales: 38 },
  { year: '1960', sales: 38 },
  { year: '1962', sales: 38 },
];
const chart = new F2.Chart({
  id: 'mountNode',
  width: 375,
  height: 265,
  pixelRatio: window.devicePixelRatio
});
chart.source(data);
chart.interval().position('year*sales');
chart.render();$ npm install
# run test case
$ npm run test-live
# build watching file changes and run demos
$ npm run dev
# run demos
$ npm run demos
# run pack
$ npm run bundlerPlease let us know how can we help. Do check out issues for bug reports or suggestions first.
To become a contributor, please follow our contributing guide.


