A dedicated performance counter for Cortex-M Systick. It shares the SysTick with users' original SysTick function(s) without interfering with it. This library will bring new functionalities, such as performance counter, delay_us and clock() service defined in time.h.
- Measure CPU cycles for specified code segment
- Add Coremark 1.0
- Provide Timer Service for EventRecorder automatically.
- Enhanced measurement services for RTOS
- Measures RAW / True cycles used for specified code segment inside a thread, i.e. scheduling cost are removed.
- Measure RAW/True cycles used for a data-process-path across multiple threads.
- Easy to use
- Helper macros:
__cycleof__(),__super_loop_monitor__()etc. - Helper functions:
start_cycle_counter(),stop_cycle_counter()etc.
- Helper macros:
- Support ALL Cortex-M processors
- Including Cortex-M85 and Star-MC1
- Provide Free Services
- Do NOT interfering with existing SysTick based applications
- Support ALL arm compilers
- Arm Compiler 5 (armcc), Arm Compiler 6 (armclang)
- arm gcc
- LLVM
- IAR
- Simplified Deployment
- Drag-and-Drop deployment for Arm Compiler 5 and Arm Compiler 6.
- CMSIS-Pack is available
- RT-Thread package is avaialble
- Time based services
delay_us()anddelay_ms()- Provides Timestamp services via
get_system_ticks(),get_system_usandget_system_ms().
- Support both RTOS and bare-metal environments
- Utilities for C language enhancement
- Macros to detect compilers, e.g.
__IS_COMPILER_ARM_COMPILER_6__,__IS_COMPILER_LLVM__etc. - Macro to create atomicity for specified code block, i.e.
__IRQ_SAFE{...} - Helper macros for C language extension:
- VB like
with() foreach(), dimof(),CONNECT()- C# like
using() - simple overload feature of OOPC made out of ANSI-C99,
__PLOOC_VA_NUM_ARGS() - ...
- VB like
- Macros to detect compilers, e.g.
You can measure specified code segment with a macro helper __cycleof__(), it is a wrapper of get_system_ticks().
Syntax:
__cycleof__(<Description String for the target>, [User Code, see ref 1]) {
    //! target code segment of measurement
    ...
}
Here, [ref 1] is a small user code to read the measurement result via a local variable __cycle_count__ for perl lovers, you can also use "_" to read the result. This User Code is optional. If you don't put anything here, the measured result will be shown with a printf().
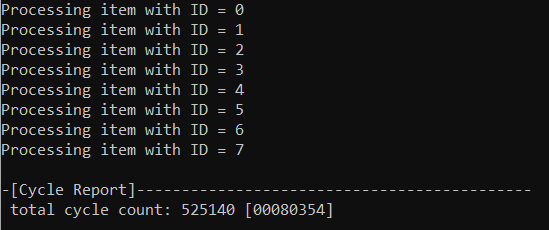
    __cycleof__() {
        foreach(example_lv0_t, s_tItem, ptItem) {
            printf("Processing item with ID = %d\r\n", _->chID);
        }
    }
You will see the measured result in console:
    int32_t iCycleResult = 0;

    /* measure cycles and store it in a dedicated variable without printf */
    __cycleof__("delay_us(1000ul)",
        /* insert code to __cycleof__ body, "{}" can be omitted  */
        {
            iCycleResult = __cycle_count__;   /*< "__cycle_count__" stores the result */
        }) {
        delay_us(1000ul);
    }

    printf("\r\n delay_us(1000ul) takes %d cycles\r\n", (int)iCycleResult);
The result is read out from __cycle_count__and used in other place:
You can get the system timestamp (since the initialization of perf_counter service) via function get_system_ticks() and get_system_ms().
NOTE: The get_system_ms() is NOT a wrapper of the function get_system_ticks().
There are various way to take advantage of those functions.
#include <stdio.h>
#include <stdlib.h>
#include "perf_counter.h"

int main (void)
{
   int i, n;

   n = 5;

   /* Intializes random number generator */
   srand((unsigned) get_system_ticks());

   /* Print 5 random numbers from 0 to 1024 */
   for( i = 0 ; i < n ; i++ ) {
      printf("%d\n", rand() & 0x3FF);
   }

   return(0);
} do {
int64_t tStart = get_system_ticks();
__IRQ_SAFE {
printf("no interrupt \r\n");
}
printf("used clock cycle: %d", (int32_t)(get_system_ticks() - tStart));
} while(0);This example shows how to use the delta value of get_system_ticks() to measure the CPU cycles used by specified code segment. In fact, the __cycleof__() is implemented in the same way:
#define __cycleof__(__STR, ...)                                                 \
            using(int64_t _ = get_system_ticks(), __cycle_count__ = _,          \
                _=_, {                                                          \
                _ = get_system_ticks() - _;                                     \
                __cycle_count__ = _;                                            \
                if (__PLOOC_VA_NUM_ARGS(__VA_ARGS__) == 0) {                    \
                    printf("\r\n");                                             \
                    printf("-[Cycle Report]");                                  \
                    printf("--------------------------------------------\r\n"); \
                    printf(__STR " total cycle count: %d [%08x]\r\n",           \
                            (int)_, (int)_);                                    \
                } else {                                                        \
                    __VA_ARGS__                                                 \
                };                                                              \
})perf_counter provides the basic timer services for delaying a given period of time and polling-for-timeout. For example:
delay_ms(1000);   /* block the program for 1000ms */
delay_us(50);	  /* block the program for 50us */

while(1) {
    /* return true every 1000 ms */
    if (perfc_is_time_out_ms(1000)) {
        /* print hello world every 1000 ms */
        printf("\r\nHello world\r\n");
    }
}If you are using EventRecorder in MDK, once you deployed the perf_counter, it will provide the timer service for EventRecorder by implenting the following functions: EventRecorderTimerSetup(), EventRecorderTimerGetFreq() and EventRecorderTimerGetCount().
If you have not modify anything in EventRecorderConf.h, you don't have to, and please keep the default configuration. If you see warnings like this:
Invalid Time Stamp Source selected in EventRecorderConf.h!
Please set the macro EVENT_TIMESTAMP_SOURCE to 3 to suppress it.
IMPORTANT: Please always make sure the macro EVENT_TIMESTAMP_FREQ is 0
By using perf_counter as the reference clock, EventRecorder can have the highest clock resolution on the target system without worring about the presence of DWT or any conflicting usage of SysTick.
- Clone the code to your local with following command lines:
git clone https://github.com/GorgonMeducer/perf_counter.git- Add including path for
perf_counterfolder - Add
perf_counter.cto your compilation - Include
perf_counter.hin corresponding c source file:
#include "perf_counter.h"- Make sure your system contains the CMSIS (with a version 5.7.0 or above) as
perf_counter.hincludescmsis_compiler.h. - Call the function
user_code_insert_to_systick_handler()in yourSysTick_Handler()
void SysTick_Handler(void)
{
    ...
    user_code_insert_to_systick_handler();
    ...
}- Make sure the
SystemCoreClockis updated with the same value as CPU frequency. - IMPORTANT: Make sure the
SysTick_CTRL_CLKSOURCE_Mskbit ( bit 2) ofSysTick->CTRLregister is1that means SysTick runs with the same clock source as the target Cortex-M processor. - Initialize the perf_counter with boolean value that indicates whether the user applications and/or RTOS have already occupied the SysTick.
void main(void)
{
    //! setup system clock

    /*! \brief Update SystemCoreClock with the latest CPU frequency
     *!        If the function doesn't exist or doesn't work correctly,
     *!        Please update SystemCoreClock directly with the correct
     *!        system frequency in Hz.
     *!
     *!        extern volatile uint32_t SystemCoreClock;
     */
    SystemCoreClockUpdate();

    /*! \brief initialize perf_counter() and pass true if SysTick is
     *!        occupied by user applications or RTOS, otherwise pass
     *!        false.
     */
    init_cycle_counter(true);

    ...
    while(1) {
        ...
    }
}- IMPORTANT: Please enable GNU extension in your compiler. For GCC and CLANG, it is
--std=gnu99or--std=gnu11, and for other compilers, please check the user manual first. Failed to do so, you will not only trigger the warning inperf_counter.h, but also lose the function correctness of__cycleof__()and__super_loop_monitor__(), because__PLOOC_VA_NUM_ARGS()isn't report0when passed with no argument.
#if __PLOOC_VA_NUM_ARGS() != 0
#warning Please enable GNC extensions, it is required by __cycleof__() and \
__super_loop_monitor__()
#endif- It is nice to add macro definition
__PERF_COUNTER__to your project GLOBALLY. It helps other module to detect the existence of perf_counter. For Example, LVGLlv_conf_cmsis.huse this macro to detect perf_counter and usesget_system_ms()to implementlv_tick_get().
Enjoy !
-
Download the cmsis-pack from the
cmsis-packfolder. It is a file with nameGorgonMeducer.perf_counter.<version>.pack, for exampleGorgonMeducer.perf_counter.2.2.0.pack -
Double click it to install this cmsis-pack. Once finished, you can find it in your Pack-Installer:
In the future, you can pull the latest version of perf_counter from the menu
Packs->Check For Updatesas shown below: -
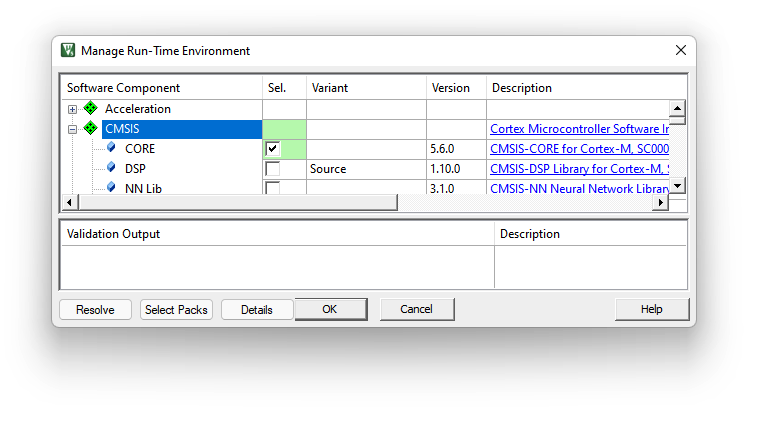
Open the RTE management window, find the Utilities and select the Core inside perf_counter as shown below:
- Include
perf_counter.hin corresponding c source file:
#include "perf_counter.h"- Make sure your system contains the CMSIS (with a version 5.7.0 or above) as
perf_counter.hincludescmsis_compiler.h. Usually, you should do this with RTE as shown below:
- Make sure the
SystemCoreClockis updated with the same value as CPU frequency. - IMPORTANT: Make sure the
SysTick_CTRL_CLKSOURCE_Mskbit ( bit 2) ofSysTick->CTRLregister is1that means SysTick runs with the same clock source as the target Cortex-M processor. - Initialize the perf_counter with boolean value that indicates whether the user applications and/or RTOS have already occupied the SysTick.
void main(void)
{
    //! setup system clock

    /*! \brief Update SystemCoreClock with the latest CPU frequency
     *!        If the function doesn't exist or doesn't work correctly,
     *!        Please update SystemCoreClock directly with the correct
     *!        system frequency in Hz.
     *!
     *!        extern volatile uint32_t SystemCoreClock;
     */
    SystemCoreClockUpdate();

    /*! \brief initialize perf_counter() and pass true if SysTick is
     *!        occupied by user applications or RTOS, otherwise pass
     *!        false.
     */
    init_cycle_counter(true);

    ...
    while(1) {
        ...
    }
}-
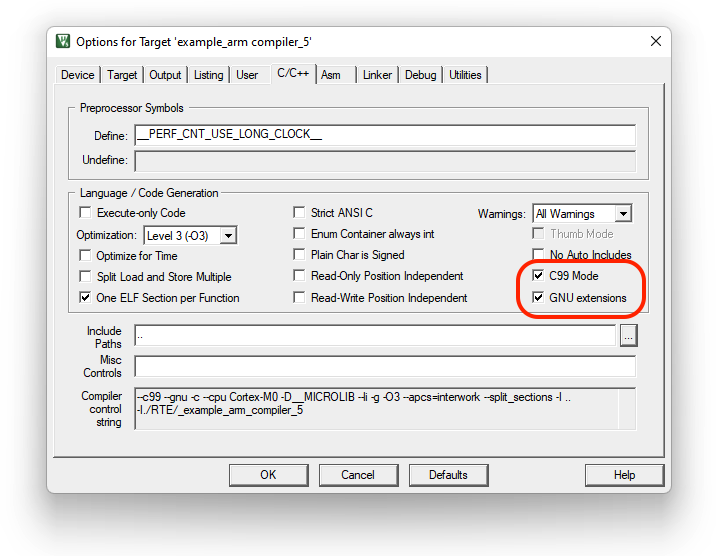
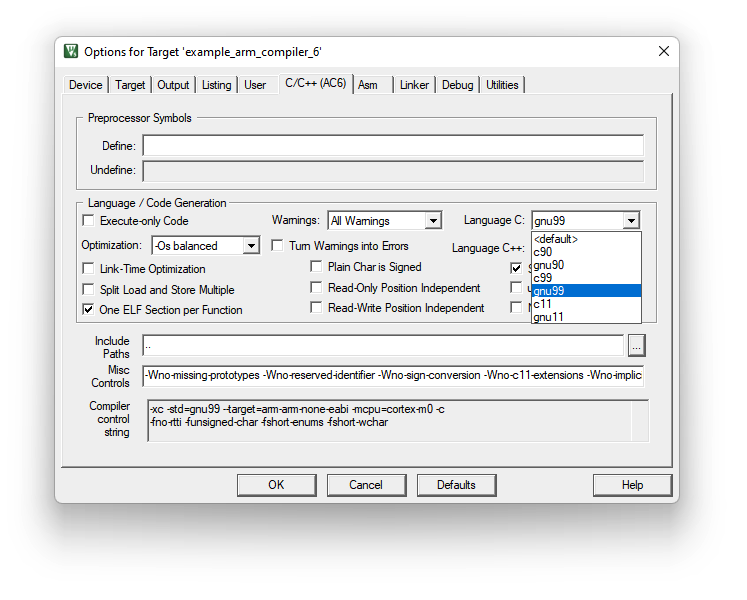
IMPORTANT: Please enable GNU extension in your compiler.
For Arm Compiler 5, please select both C99 mode and GNU extensions in the Option for target dialog as shown below:
For Arm Compiler 6, please select gnu99 or gnu11 in Language C drop-list as shown below:
Failed to do so, you will not only trigger the warning in perf_counter.h, but also lose the function correctness of __cycleof__() and __super_loop_monitor__(), because __PLOOC_VA_NUM_ARGS() isn't report 0 when passed with no argument.
#if __PLOOC_VA_NUM_ARGS() != 0
#warning Please enable GNC extensions, it is required by __cycleof__() and \
__super_loop_monitor__()
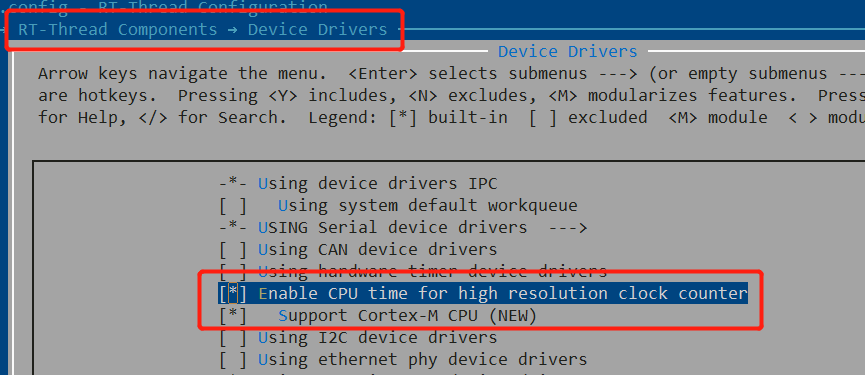
#endifperf_counter has registered as one of the RT-Thread software packages, which locats in system category. In ENV or RT-Thread Studio, you just need to simply enable cputime framework. RT-Thread will automatically enable perf_counter if you are using Cortex-M architecture.
Enjoy !
This error usually pops-up in Arm Compiler 5 and Arm Compiler 6, it is because you haven't implement any non-weak Systick_Handler(). Please provide an EMPTY one in any c source file to solve this problem:
void SysTick_Handler(void)
{
}NOTE: If you deploy perf_counter using cmsis-pack and encounter this issue, please DO NOT call function user_code_insert_to_systick_handler() in this should-be-empty SysTick_Handler().
Since version v2.1.0 I removed the unnecessary bundle feature from the cmsis-pack, hence causing this problem if you have used the older version.
To solve this problem:
- please unselect ALL the performance components in RTE, press OK and close the uVision.
- reopen the mdk project and select the perf_counter components in RTE
Sorry about this.
Performance Counter for Cortex-M, a.k.a. perf_counter is under Apache 2.0 license.
