Casualty_Challenge
Table of content
- Introduction
- Intallation of package
- Content folder github
- Result
Introduction
Judea Pearl and his research group have developed in the last decades a solid theoretical framework to deal with a common frustration in the industry in orders to be able to answer question such as “Which clients will pay their debts only if I call them?” , but the first steps toward merging it with mainstream machine learning are just beginning. The causal graph is a central object in the framework mentioned above, but it is often unknown, subject to personal knowledge and bias, or loosely connected to the available data.
The main objectif is to conduct an exploratory data analysis on the data and perform Casualty Inference on Brest cancer data set with useful insights using causal graph.
Intallation of package
$ git clone
$cd Causality-Challange
$ pip install -r requriements.txt
Content folder github
data :
This folder contains all the dataset used and obtainined using the process of data preprocessing and feacture extraction.
DVC: was perform for remote storage and data versioning. \
You can extract the data from kaggle. Features in the data are computed from a digitized image of a fine needle aspirate (FNA) of a breast mass. Attribute Information:
- ID number
- Diagnosis (M = malignant, B = benign)
The remaining (3-32) . Ten real-valued features are computed for each cell nucleus: radius (mean of distances from center to points on the perimeter) - texture (standard deviation of gray-scale values)
- Perimeter
- Area
- smoothness (local variation in radius lengths)
- compactness (perimeter^2 / area - 1.0)
- concavity (severity of concave portions of the contour)
- concave points (number of concave portions of the contour)
- Symmetry
- fractal dimension ("coastline approximation" - 1)
notebooks:
- data exploration
- data extraction
- Causal model
pictures
Contain some usefull insight of graph for causal graph and data exploration.
script:
script_preprocessing: concerned data missing, data cleaninggraph_bi_univariate: concerned some graphs for data exploration , bivariate graph(boxplot) , pairplot, univariate plot which displair distribution (histogrammee).script_exploration: used to get an heatmap and some descriptives statisticscausal_graph: used to obtains some great causal graph with specification
test :
- unitest
Result
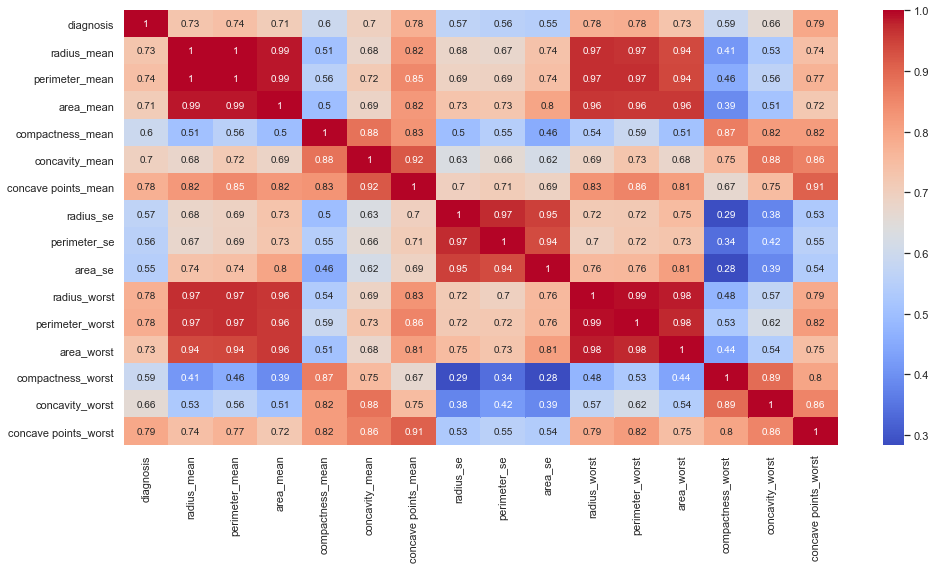
Heatmap for High correlation between variables.
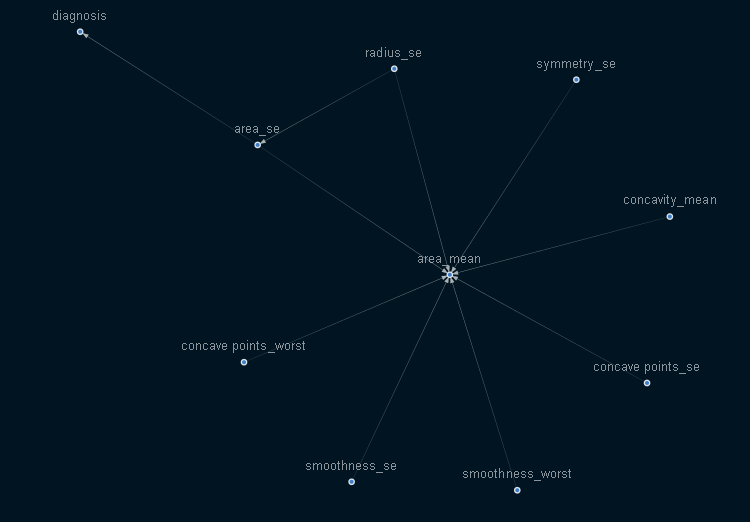
That is the causal graph used in the analysis .


