You've successfully deployed AMP for Endpoints and it is now running on your system. Great! But, what is it actually doing? Most of the time it doesn't look like it is doing anything, but AMP is actually performing file checks constantly on the endpoint. The goal of this tool is to provide additional insight into AMP operations and allow customers to perform troubleshooting on their own. This should empower customers to self-resolve performance issues that would otherwise involve TAC engagement, and also provide visibility into AMP’s various activities.
This tool was developed by Matthew Franks (AMP Tier3) and Brandon Macer (Security CX). With enough support and adoption, the long-term hope is to integrate this tool’s functionality into the AMP GUI.
This is not an officially supported tool and was developed as a side project, not as an official release by Cisco. Any support received will be on an as-available timeframe and feature requests may not be fulfilled.
No installation is required. The tool can be downloaded or cloned from GitHub. If you'd like to make an EXE, you can do so with PyInstaller:
pyinstaller --onefile --noconsole --icon amp-icon.ico .\main_page.py
Current executable has been included in the files above for ease of use.
To start the tool, ensure that you have an instance of AMP running and run the main_page.py script. If you have an executable from PyInstaller, right click the executable and Run as Administrator. You'll be presented with the GUI interface.
This displays the AMP version that is installed on your system.
This displays the CPU resources being consumed by the AMP process.
This displays the length of time since the AMP process was started/restarted.
This displays either Not Isolated or Isolated depending on the current isolation status.
If isolated, the Isolation Code to unlock the connector will be displayed.
NOTE: Valid API Credentials are required for this functionality to work.
For additional information on Endpoint Isolation, please refer to the AMP User Guide.
This displays the current TETRA definition version downloaded by the AMP connector. Click the Check TETRA Version button to check that against the version available in the cloud. If you have the latest version, it will be highlighted Green. If you have a version within the last five updates, it will be highlighted Yellow. If your version is more than five updates behind, it will be highlighted Red. Also, the current version will be displayed on the right.
NOTE: This functionality does not require API Credentials.
This displays the current Policy Serial number in place on the local connector. Click the Check Policy Version button to check that against the version available in the cloud. If you have the latest version, it will be highlighted Green. If your version is not the latest, it will be highlighted Red. Also, the latest version available will be displayed on the right.
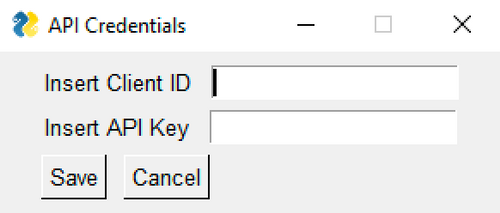
This display will show if you have provided valid API Credentials. It will show either Valid or Invalid. There are two ways to provide credentials.
- Click the Get API Credentials button. This will show a popup and allow you to supply the Client ID and API Key for authentication.
- If you place a file in the same directory as the main_page.py script or AMP Health Checker executable, the program can read the credentials from there to avoid manually supplying them each time. The file must be called apiCreds.txt and be formatted like this:
client_id="abcdabcdabcdabcdabcd"
api_key="abcd1234-abcd-1234-abcd-1234abcd1234"
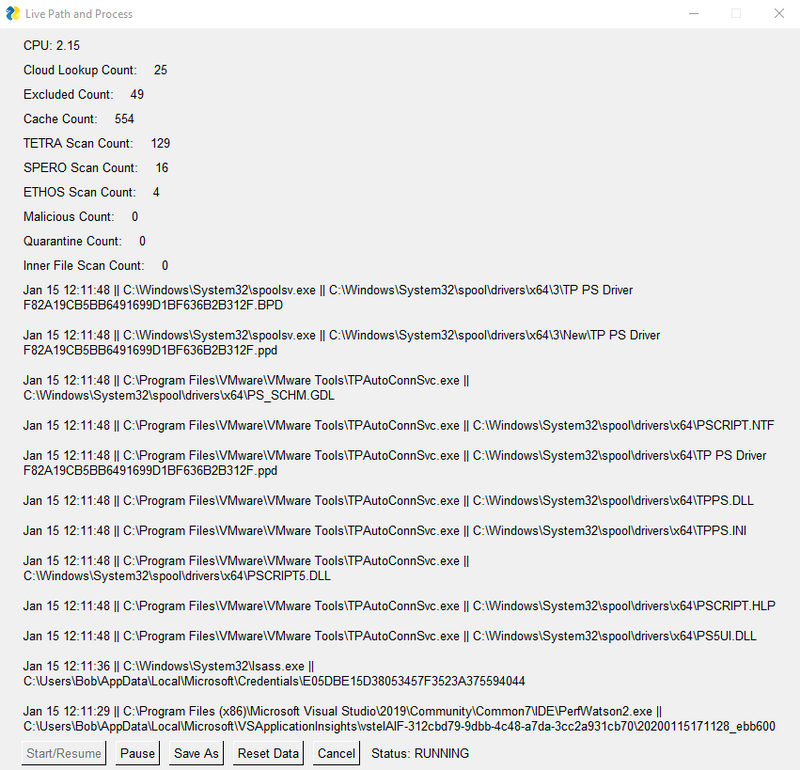
The Live Debugging button will bring you to a new popup. Within this popup, you can conduct performance troubleshooting. The statistics provided should give you an indication of the engine or action that is causing high system resource utilization.
To start, press the Start/Resume button. To pause, press Pause. To resume again, press Start/Resume. If you would like to save the scanned files to a text file, click Save As to save it locally on your system. Click Reset Data to reset the counters. Click Cancel to exit.
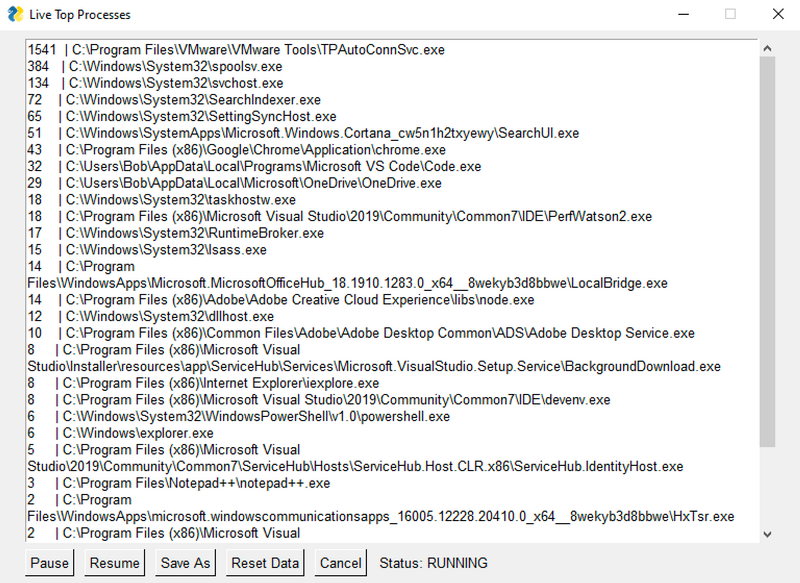
Live top processes gives a quick view into the top processes being scanned by the AMP Connector. The controls are similar to the Live Debugging controls.
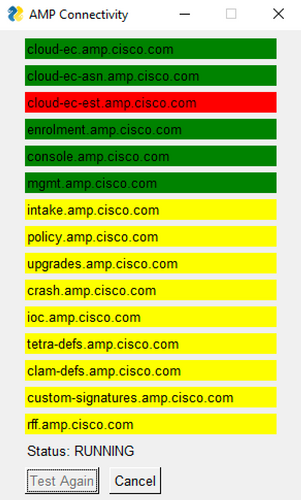
The Connectivity Test button will allow you to run a connectivity test to the AMP servers. They will all show as yellow while the test is running. If they turn green, the connection was successful. If they turn red, the connection was unsuccessful.
NOTE: This does not validate whether or not traffic was altered on the way to the servers, so please be sure to bypass these addresses through your proxies.
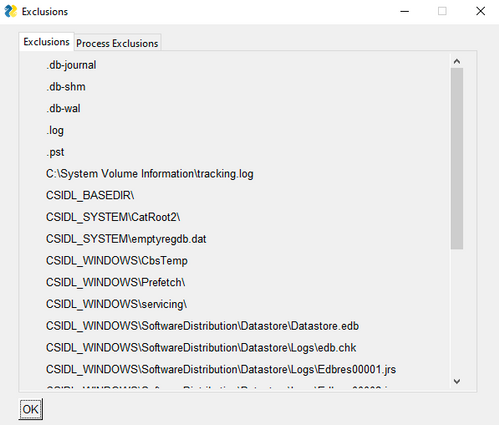
The View Exclusions button allows you to view the path and process exclusions from the current policy on the endpoint.
The Generate Diagnostic button allows you to generate an AMP Diagnostic bundle. This will place the zipped file on your desktop. It will also create an amp_health_checker_log.log file in the directory with the Health Checker scripts or executable. If you have an issue with the tool itself, please click the DEBUG button on the main page, recreate the issue, and provide the AMP diagnostic and the Health Checker log for analysis.
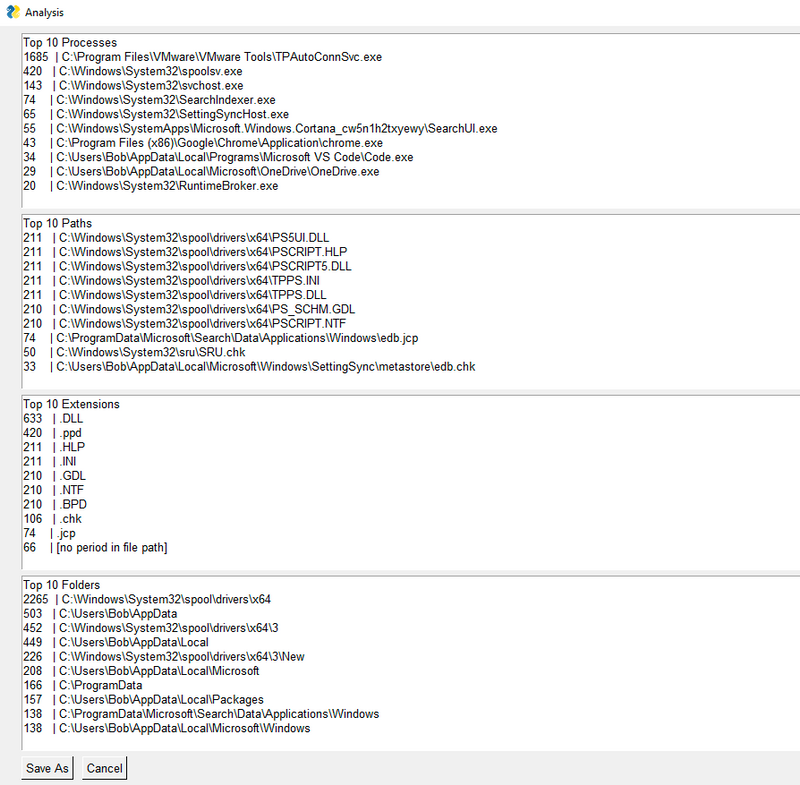
The Run Analysis button will give you a quick snapshot of the system based on the AMP sfc.exe.log files. The top 10 processes, files, extensions and folders scanned will be displayed.
NOTE: The logs need to be in debug to show the appropriate data.
The Top IPs will show a list of the top ten IP addresses reached out to from files scanned by the AMP Connector.
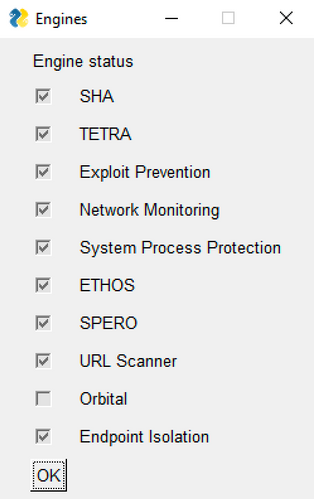
The Check Engines button will show each engine and whether or not it is enabled in the local policy. In the example below, Orbital is the only engine not enabled.
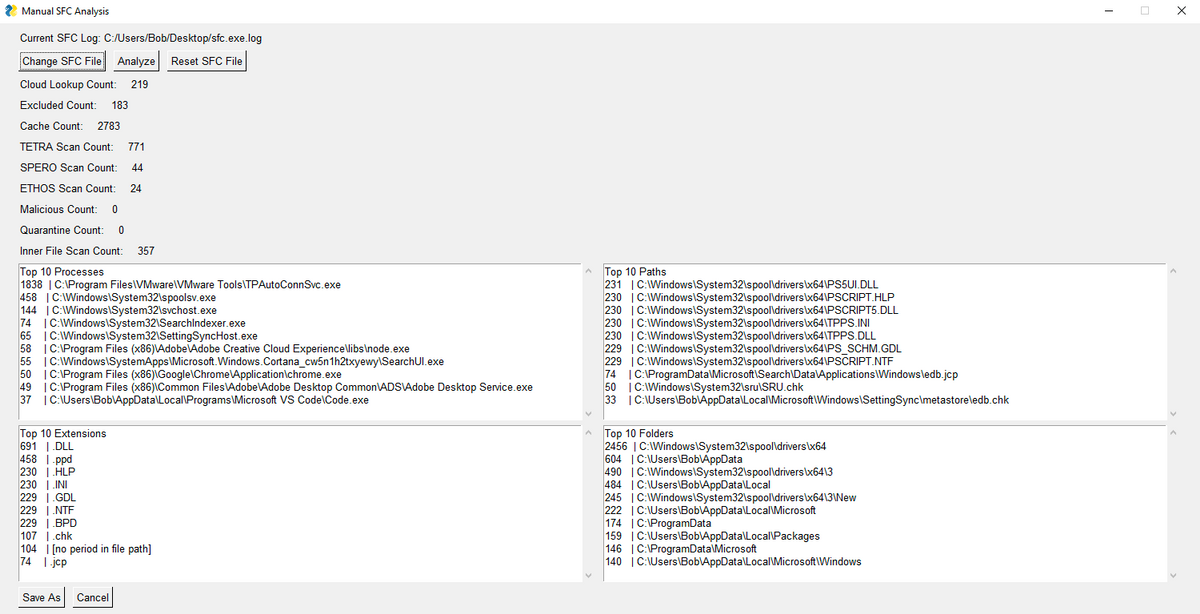
Manual SFC Analysis allows you to run analysis on a file from another machine or an old file from the same machine. The sfc.exe.log file from the local machine is selected by default but you can change this with the Change SFC File button. Click Analyze to run the analysis. Click Reset SFC File to reset the file back to the local sfc.exe.log file.
The log level buttons allow you to select the logging level for the AMP Health Checker tool. It does not change the log level on the AMP Connector! If you run into an issue with the Health Checker tool, please put the tool in DEBUG, reproduce the issue, and provide the AMP diagnostic file and Health Checker logs for analysis.
The region buttons allow you to switch between NAM, EU and APJC depending on which cloud your connector belongs to.
Refresh will refresh the data on the main page. This may be necessary if the Isolation Status changes while running the Health Checker or if you change Regions. This feature was introduced to prevent excessive resource utilization by the tool.
Cancel will exit the program.


