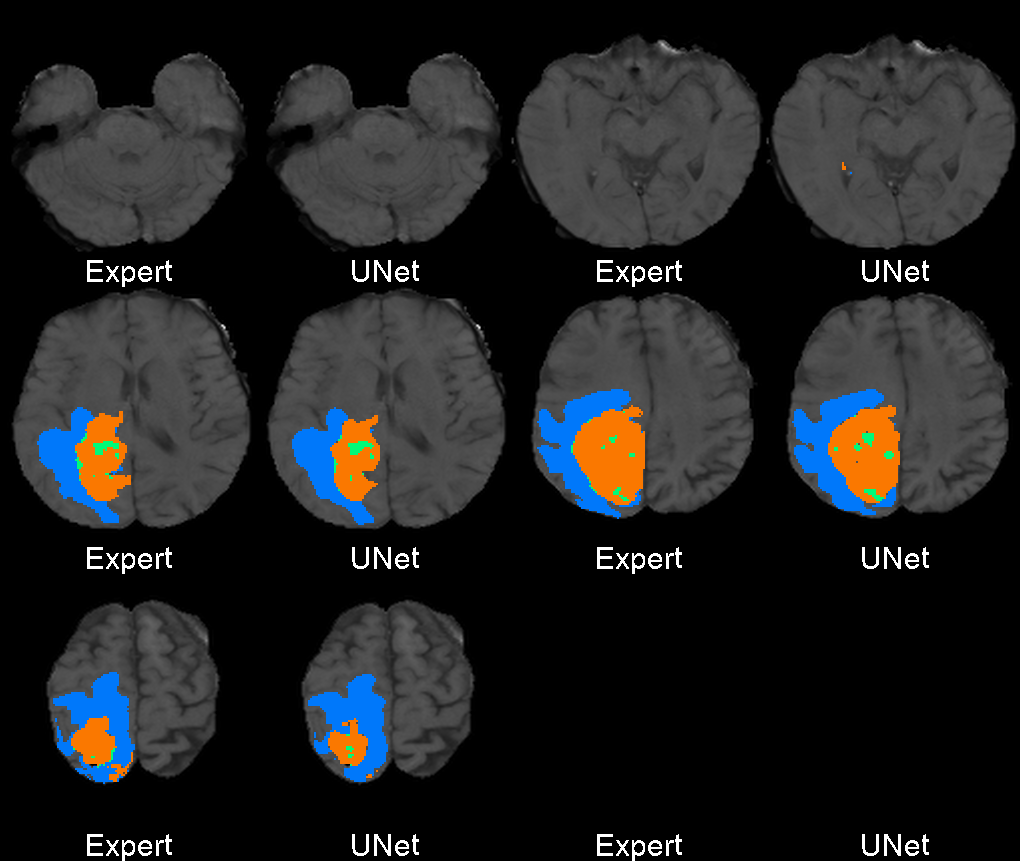
Originally designed after this paper on volumetric segmentation with a 3D U-Net. The code was written to be trained using the BRATS data set for brain tumors, but it can be easily modified to be used in other 3D applications.
- Download the BRATS 2017 GBM and
LGG data. Place the unzipped folders in the
brats/data/originalfolder. - Install dependencies:
nibabel,
keras,
pytables,
nilearn,
SimpleITK,
nipype
(nipype is required for preprocessing only)
-
Install ANTs N4BiasFieldCorrection and add the location of the ANTs binaries to the PATH environmental variable.
-
Add the repository directory to the
PYTONPATHsystem variable:
$ export PYTHONPATH=${PWD}:$PYTHONPATH
- Convert the data to nifti format and perform image wise normalization and correction:
cd into the brats subdirectory:
$ cd brats
Import the conversion function and run the preprocessing:
$ python
>>> from preprocess import convert_brats_data
>>> convert_brats_data("data/original", "data/preprocessed")
- Run the training:
To run training using the original UNet model:
$ python train.py
To run training using an improved UNet model (recommended):
$ python train_isensee2017.py
If you run out of memory during training: try setting
config['patch_shape`] = (64, 64, 64) for starters.
Also, read the "Configuration" notes at the bottom of this page.
In the training above, part of the data was held out for validation purposes. To write the predicted label maps to file:
$ python predict.py
The predictions will be written in the prediction folder along with the input data and ground truth labels for
comparison.
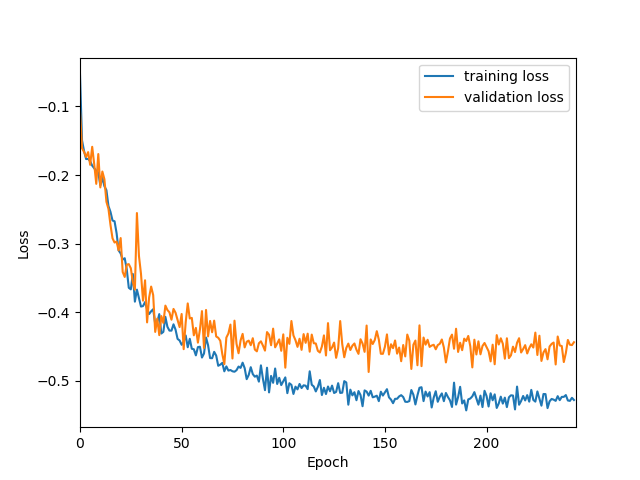
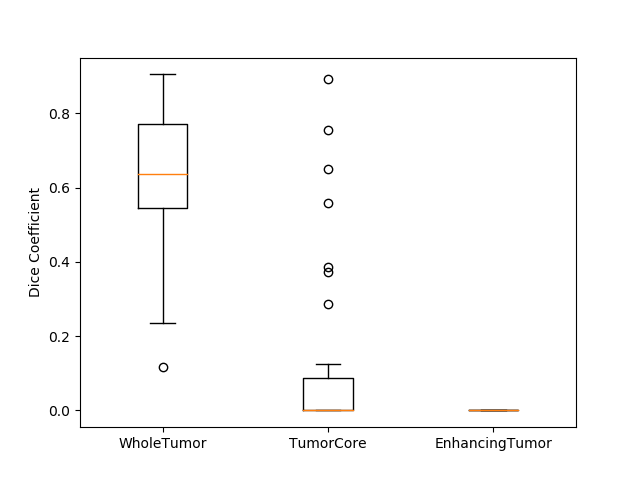
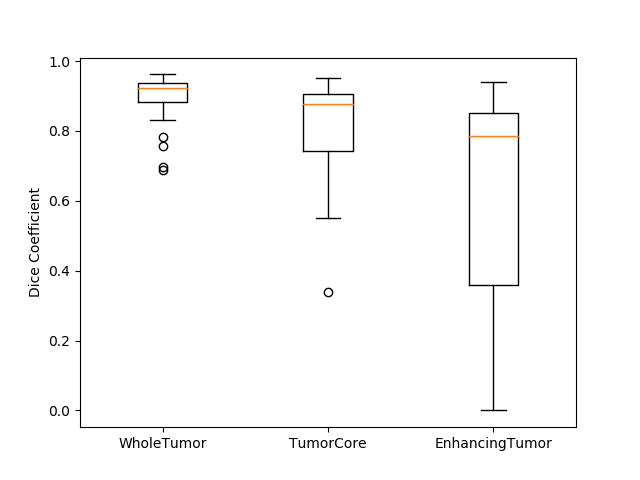
In the box plot above, the 'whole tumor' area is any labeled area. The 'tumor core' area corresponds to the combination of labels 1 and 4. The 'enhancing tumor' area corresponds to the 4 label. This is how the BRATS competition is scored. The both the loss graph and the box plot were created by running the evaluate.py script in the 'brats' folder after training has been completed.
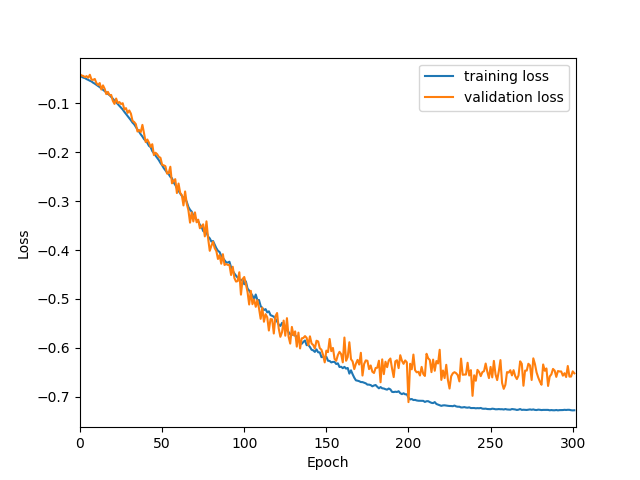
I also trained a model with the architecture as described in the 2017 BRATS proceedings on page 100. This architecture employs a number of changes to the basic UNet including an equally weighted dice coefficient, residual weights, and deep supervision. This network was trained using the whole images rather than patches. As the results below show, this network performed much better than the original UNet.
Changing the configuration dictionary in the train.py or the
train_isensee2017.py scripts, makes it easy to test out different model and
training configurations.
I would recommend trying out the Isensee et al. model first and then modifying the parameters until you have satisfactory
results.
If you are running out of memory, try training using (64, 64, 64) shaped patches.
Reducing the "batch_size" and "validation_batch_size" parameters will also reduce the amount of memory required for
training as smaller batch sizes feed smaller chunks of data to the CNN.
If the batch size is reduced down to 1 and it still you are still running
out of memory, you could also try changing the patch size to (32, 32, 32).
Keep in mind, though, that a smaller patch sizes may not perform as well as larger patch sizes.
If you want to train a 3D UNet on a different set of data, you can copy either the train.py or the train_isensee2017.py scripts and modify them to read in your data rather than the preprocessed BRATS data that they are currently setup to train on.
The following Keras models were trained on the BRATS 2017 data:
- Isensee et al. 2017: model (weights only)
- Original U-Net: model (weights only)
GBM Data Citation:
- Spyridon Bakas, Hamed Akbari, Aristeidis Sotiras, Michel Bilello, Martin Rozycki, Justin Kirby, John Freymann, Keyvan Farahani, and Christos Davatzikos. (2017) Segmentation Labels and Radiomic Features for the Pre-operative Scans of the TCGA-GBM collection. The Cancer Imaging Archive. https://doi.org/10.7937/K9/TCIA.2017.KLXWJJ1Q
LGG Data Citation:
- Spyridon Bakas, Hamed Akbari, Aristeidis Sotiras, Michel Bilello, Martin Rozycki, Justin Kirby, John Freymann, Keyvan Farahani, and Christos Davatzikos. (2017) Segmentation Labels and Radiomic Features for the Pre-operative Scans of the TCGA-LGG collection. The Cancer Imaging Archive. https://doi.org/10.7937/K9/TCIA.2017.GJQ7R0EF
