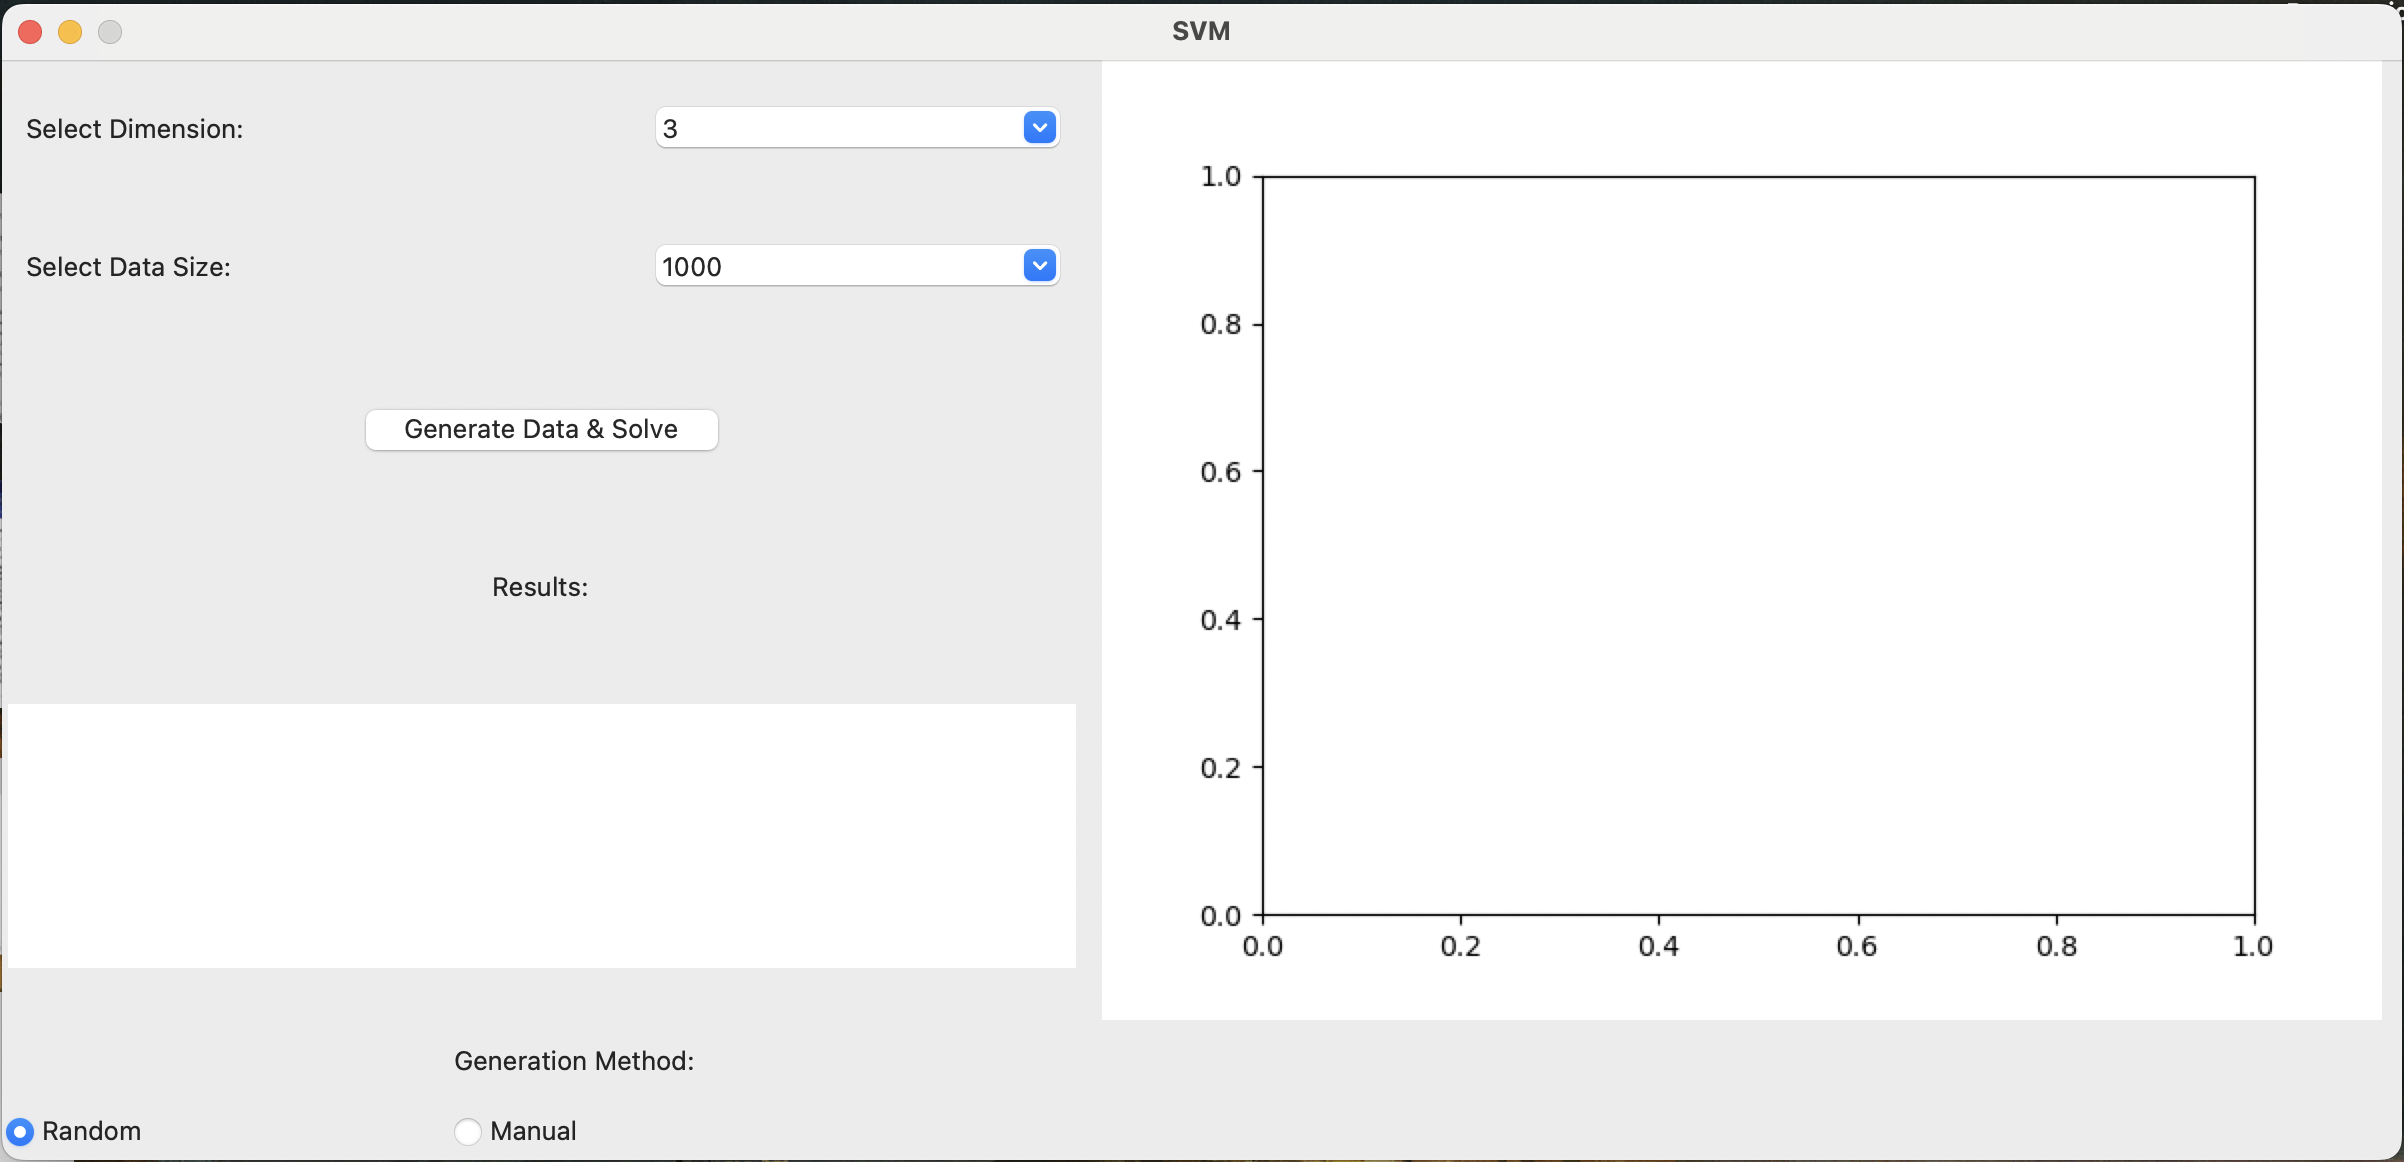
This project provides a comprehensive toolkit for solving Support Vector Machine (SVM) problems using both the Sequential Minimal Optimization (SMO) algorithm and the quadratic programming solver from the cvxopt library. It includes a command-line interface for executing SVM solutions and a graphical user interface (GUI) built with Tkinter for interactive problem-solving and visualization. The toolkit is designed to be flexible, allowing users to customize feature dimensions and data size, and to choose between random or manual data generation methods. The primary components of the project are described below.
-
cvxopt_solver.py: Invokes the quadratic programming solver from cvxopt for efficient problem-solving, primarily used as a benchmark for solving efficiency. -
smo_solver.py: The main solving classSVMbased on SMO algorithm. -
solve_with_smo.py: Executes the solving class for SVM problem-solving and result visualization via a Python file in the command line. -
SVM_GUI.py: A SVM problem-solving GUI program created using the Tkinter library, based on the authored solving algorithm.
Adjust the feature dimensions (n) and quantity (N) around lines 74-75 to customize the problem. Save and run the file for solving; utilizes cvxopt's quadratic programming solver.
Similarly, customize feature dimensions (n) and quantity (N) around lines 36-37. Save and run the file to solve the problem; employs the solving class SVM authored by me.
(Running with the authored solving class) Launch the application:
- Select Dimension: Dropdown to choose data dimension (integer between 3 and 6).
- Select Data Size: Dropdown to select dataset size (1e3, 1e4, 1e5, 1e6).
- Generation Method: Choose data generation method, either "Random" or "Manual". Clicking "Manual" reveals two input boxes on the right.
- Enter w (eg: 1,2,3): Appears only in manual mode, for entering the w vector.
- Enter b: Appears only in manual mode, for entering the scalar b.
- Generate Data & Solve: Button to generate data (in Random mode) and solve the SVM problem.
- Results: Text box displaying the real hyperplane's
wb, SVM-calculated optimal hyperplane'swb, and the elapsed time (in seconds). - Matplotlib_Frame: (on the right) Displays the drawn dataset and the solved hyperplane after solving.
Note:
- In manual input mode, ensure the entered w vector length matches the selected dimension, and use commas for separation; otherwise, an error message will be displayed.
- If the input is invalid or erroneous, the application will show an appropriate error message dialog.

