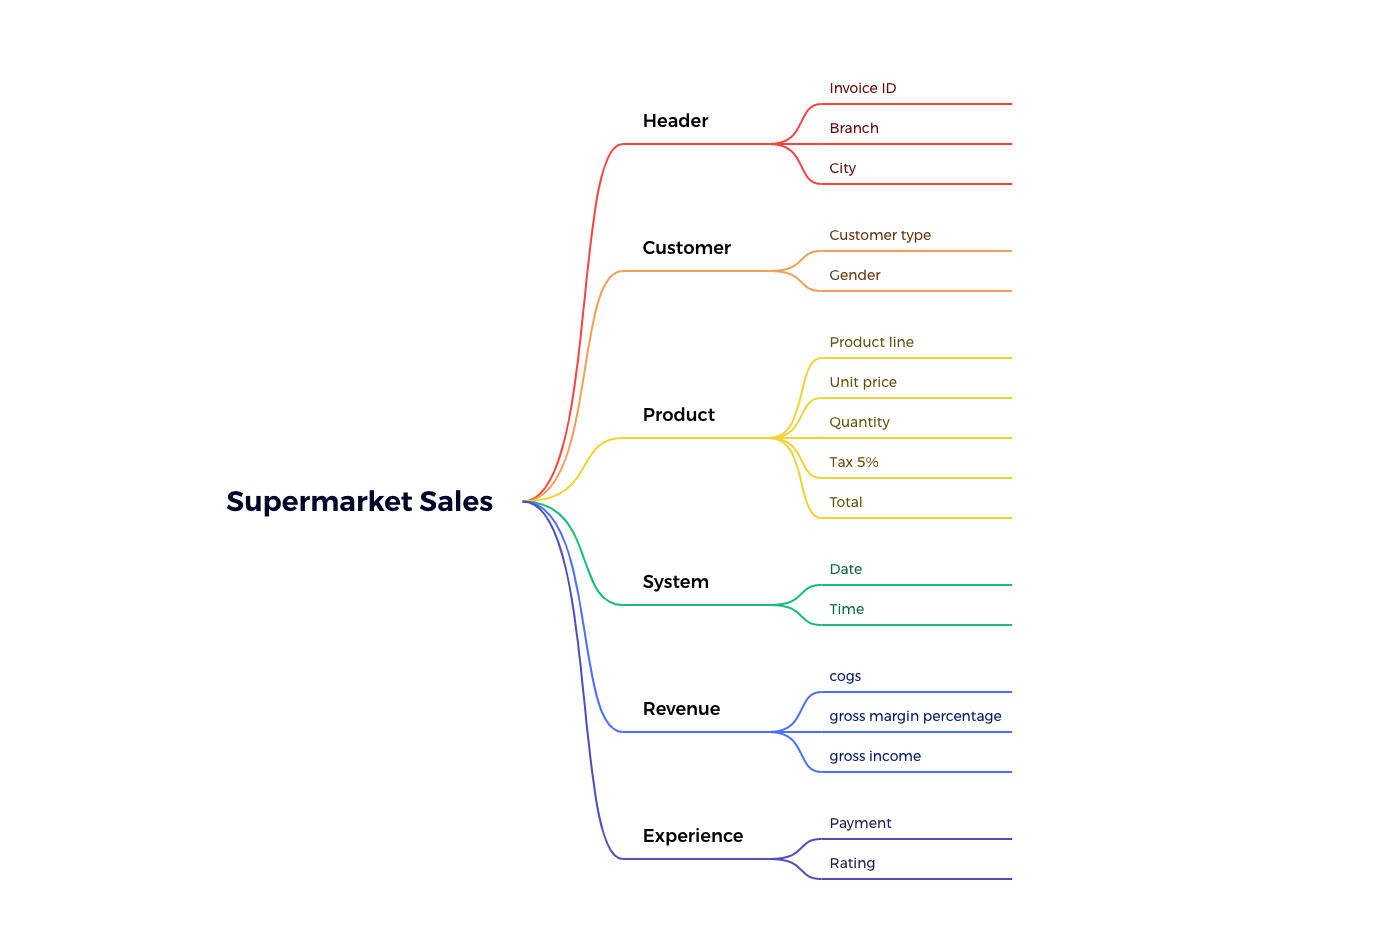
Explorative analysis of a supermarket sales data set from Kaggel
https://www.kaggle.com/datasets/aungpyaeap/supermarket-sales
-
Jupyter Lab
-
Python ( Pandas, Numpy, Seaborn, Matplotlib )
-
Xmind
cogs = Unit price * Quantity
Tax 5% = cogs * 5/ 100
Total = cogs + Tax 5%
gross income = Total * gross margin percentage/ 100
All products have the same gross margin percentage
Creater of this dataset has balanced it for multiple fields.
- Python 3.8.9
- pip 22.3.1
- Jupyter-Lab 3.5.2
- If you are setting up manually might need to update SciPy
- Numpy 1.24.1
- Pandas 1.5.2
- Matplotlib 3.6.3
- Seaborn 0.12.2
- Download the CSV from https://www.kaggle.com/datasets/aungpyaeap/supermarket-sales and move to the same folder as the .ipynb file
- Launch Jupyterlab and select Run All
or
- Follow step 9 and 10 on your Google drive and open the .ipynb file in Google Colab *Google Colab might not support newer version of Matplotlib/Seaborn, the plots might need small changes to display properly.
