This package produces graphs of temperatures in summer and winter for Australian locations using data downloaded from the Australian Bureau of Meteorology (BoM).
Daily maximum and minimum temperature measurements can be downloaded for weather stations in Australia from the Climate Data Online section of the BoM website.
The package includes pre-downloaded datasets for the main airport location in the capital city of each Australian state and territory:
-
Adelaide
-
Brisbane
-
Canberra
-
Darwin
-
Hobart
-
Melbourne
-
Perth
-
Sydney
These can be loaded via data('Adelaide'), for example. Otherwise, use
download_temperatures() to download the most recent temperatures for
these cities or for other locations.
You can install the development version of austemp from
GitHub with:
# install.packages("devtools")
devtools::install_github("a-s-russo/austemp")Download summer and winter data for Adelaide:
(The approximate download date & time of this example is 01 Apr 2024 @ 12PM ACDT.)
# Load the package
library(austemp)

# Download temperature data
station <- '023034' # Station number for Adelaide Airport
product_max <- '122' # Product number for maximum temperatures
product_min <- '123' # Product number for minimum temperatures
URLpart1 <-
  'http://www.bom.gov.au/jsp/ncc/cdio/weatherData/av?p_nccObsCode='
URLpart2 <-
  '&p_display_type=dailyDataFile&p_startYear=&p_c=&p_stn_num='
max_temp_URL <- paste0(URLpart1, product_max, URLpart2, station)
min_temp_URL <- paste0(URLpart1, product_min, URLpart2, station)
Adelaide <-
  download_temperatures(URLs = c(max_temp_URL, min_temp_URL))
(Alternatively, use the pre-downloaded dataset for Adelaide via
data('Adelaide') as mentioned above.)
The downloaded data can then be graphed:
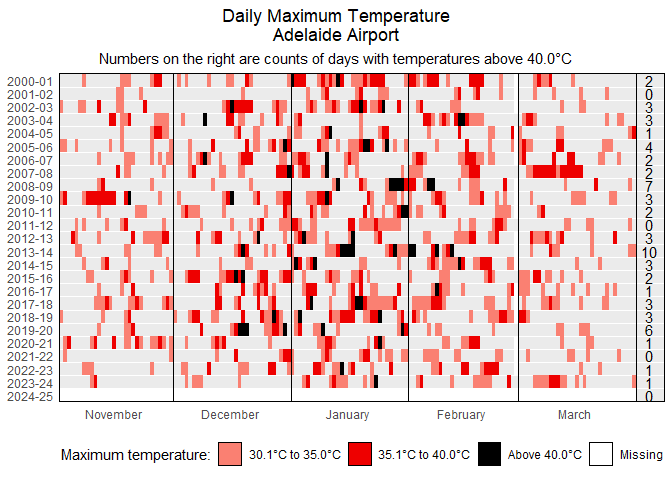
# Graph summer temperatures
plot_temperatures(
  data = Adelaide,
  season = 'summer',
  location = 'Adelaide Airport',
  thresholds = c(30, 35, 40),
  start_year = 2001,
  end_year = 2024
)
(Although the requested ending year is 2024, temperatures for 2025 appear since the summer months span consecutive years, and likewise for the requested starting year. There are some missing temperatures in 2024 given the download date above. There are also no temperatures for 29 February in non-leap years obviously.)
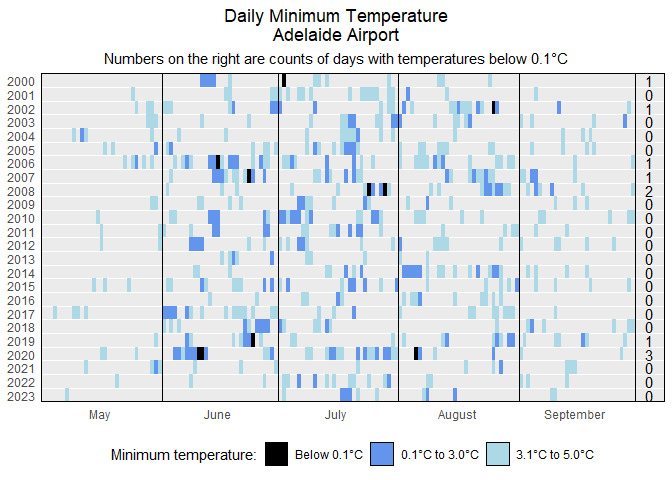
# Graph winter temperatures
plot_temperatures(
  data = Adelaide,
  season = 'winter',
  location = 'Adelaide Airport',
  thresholds = c(0, 3, 5),
  start_year = 2000,
  end_year = 2024
)
(Temperatures for 2024 do not appear despite being requested since there are no temperatures at all for 2024 yet given the download date above. That is, the winter months do not span consecutive years, and so a winter season is contained entirely within a single year.)

