from time import time
import pandas as pd
import numpy as np
import seaborn as sns
from matplotlib import pyplot as plt

from sortFunc import mergeSort,bubbleSort,selectionSort,insertionSort,quickSort,radixSort

import sys
sys.setrecursionlimit(5000)
#wrapper to count function execution time
from functools import wraps
import time
def timeit(func):
@wraps(func)
def timeit_wrapper(*args):
start_time = time.perf_counter()
result = func(*args)
end_time = time.perf_counter()
total_time = end_time - start_time
return total_time
return timeit_wrapper#initialize the sorting functions, data array and the array sizes
sortFuncs = [mergeSort, bubbleSort, selectionSort, insertionSort, quickSort]
funcExecTimeData = {"mergeSort":[], "bubbleSort":[], "selectionSort":[], "insertionSort":[], "quickSort":[], "radixSort":[]}
array_sizes = [10, 100, 500, 1000, 2000, 2500,3000,4000]#loop, execute and store time result
for size in array_sizes:
random_array = np.random.randint(1,999,(1,size))[0]
funcExecTimeData["mergeSort"].append(timeit(mergeSort)(random_array,0,size-1))
funcExecTimeData["bubbleSort"].append(timeit(bubbleSort)(random_array))
funcExecTimeData["selectionSort"].append(timeit(selectionSort)(random_array))
funcExecTimeData["insertionSort"].append(timeit(insertionSort)(random_array))
funcExecTimeData["quickSort"].append(timeit(quickSort)(random_array,0, size-1))
funcExecTimeData["radixSort"].append(timeit(radixSort)(random_array))funcExtimedf = pd.DataFrame(funcExecTimeData, index=array_sizes)
funcExtimedf| mergeSort | bubbleSort | selectionSort | insertionSort | quickSort | radixSort | |
|---|---|---|---|---|---|---|
| 10 | 0.000033 | 0.000013 | 0.000016 | 0.000004 | 0.000036 | 0.000046 |
| 100 | 0.000349 | 0.001062 | 0.001018 | 0.000033 | 0.002253 | 0.000653 |
| 500 | 0.002193 | 0.024256 | 0.023521 | 0.000151 | 0.049557 | 0.001255 |
| 1000 | 0.004158 | 0.090960 | 0.089633 | 0.000306 | 0.197953 | 0.002512 |
| 2000 | 0.009034 | 0.370422 | 0.358095 | 0.000627 | 0.800171 | 0.005073 |
| 2500 | 0.011644 | 0.572640 | 0.559005 | 0.000780 | 1.252967 | 0.006367 |
| 3000 | 0.014188 | 0.825370 | 0.804125 | 0.000937 | 1.805299 | 0.007527 |
| 4000 | 0.019523 | 1.473479 | 1.429348 | 0.001253 | 3.237911 | 0.010086 |
Merge Sort: O(n log(n))
Bubble Sort: O(n^2)
Selection Sort: O(n^2)
Insertion Sort: O(n^2)
Quick Sort: O(n^2)
Radix Sort: O(nk)
Bubble Sort: O(n^2)
Selection Sort: O(n^2)
Insertion Sort: O(n^2)
Quick Sort: O(n^2)
Radix Sort: O(nk)
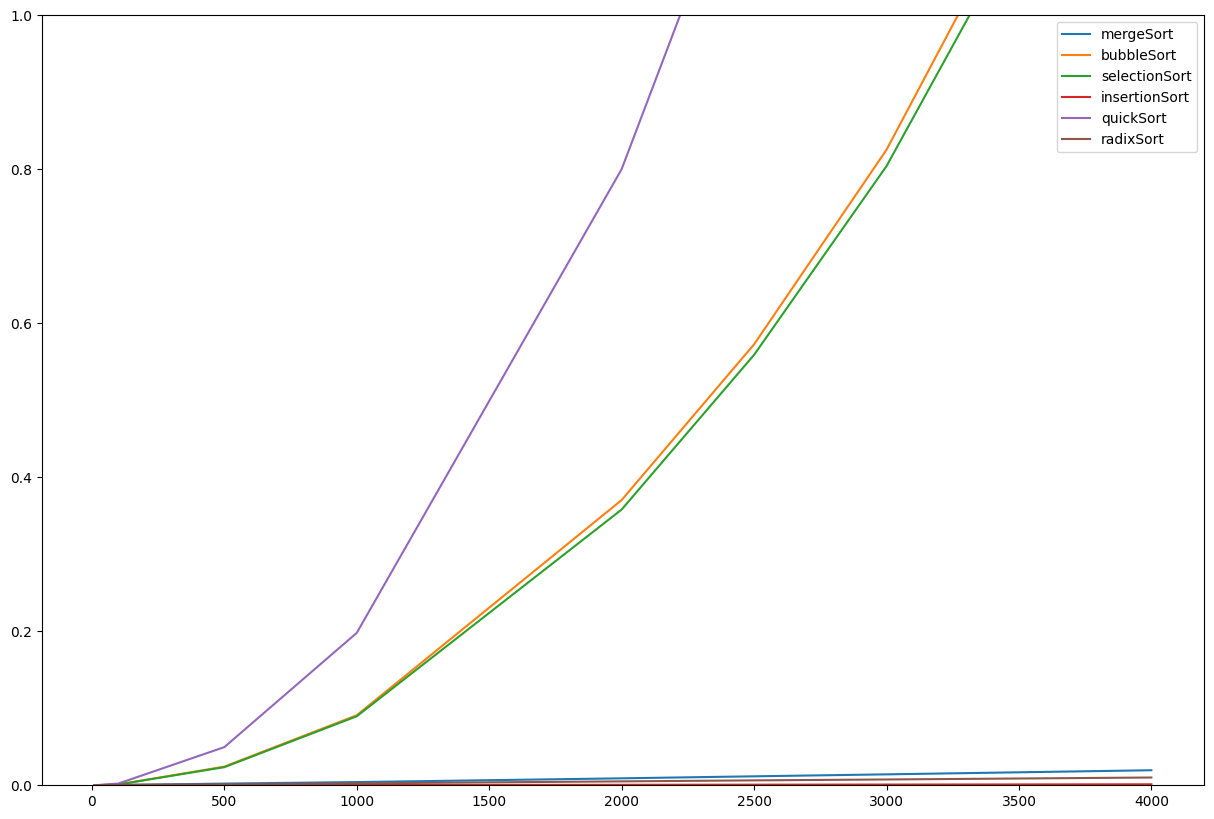
plt.figure(figsize=(15,10))
frame = sns.lineplot(data=funcExtimedf, dashes=False,)
frame.set_ylim(0,1)