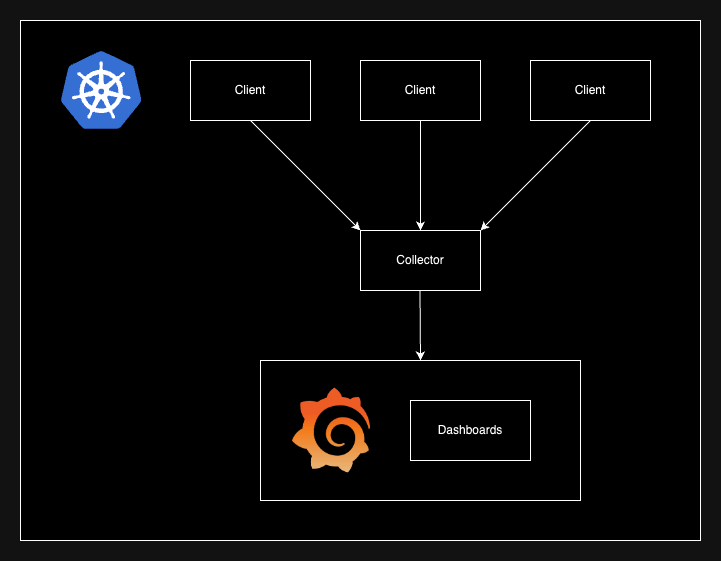
Lightweight and minimalist observability for distributed systems.
APIs that cover the three pillars of observability!
- Found in
logs.go - Outputs to collector via HTTP
- Found in
metrics.go - Outputs to collector via HTTP
- Supports counters, gauges, and histograms
- Found in
traces.go - Outputs to collector via HTTP
- Supports spans and traces
HTTP server for data ingestion from clients.
-
Build container:
docker build -f collector/Dockerfile -t gobs-collector . -
Run container:
docker run -d -p 8080:8080 gobs-collector
/logs- update Logs from given JSON/counters- update Counters from given JSON/gauges- update Gauges from given JSON/histograms- update Histograms from given JSON/traces- update Traces from given JSON
Manual tests done inside simulated environment (K8s) and using Postman.
-
Install minikube and Docker
-
Load containers into minikube
- Start minikube:
minikube start
- Load images:
eval $(minikube docker-env)
- Start minikube:
-
Build containers for collector and main
- Build collector's container:
docker build -f collector/Dockerfile -t gobs-collector . - Build main's container:
docker build -f main/Dockerfile -t gobs-main . - Verify using:
minikube ssh
docker images
- Build collector's container:
-
Apply deployment and service files
- Apply collector deployment:
kubectl apply -f k8s/collector-deployment.yaml
- Apply collector service:
kubectl apply -f k8s/collector-service.yaml
- Apply main deployment:
kubectl apply -f k8s/main-deployment.yaml
- Apply main service:
kubectl apply -f k8s/main-service.yaml
- Apply Grafana deployment:
kubectl apply -f k8s/grafana-deployment.yaml
- Apply Grafana service:
kubectl apply -f k8s/grafana-service.yaml
- Apply collector deployment:
-
View Grafana dashboards
- Port-forward dashboards:
kubectl port-forward deployment/grafana 3000:3000
- Port-forward dashboards:
-
View dashboards on
http://localhost:3000 -
Create data source using JSON API
-
Choose URL:
- Using Docker:
http://host.docker.internal:8080/export
- Using Kubernetes:
http://collector-service.default.svc.cluster.local:8080/export
- Using Docker:
-
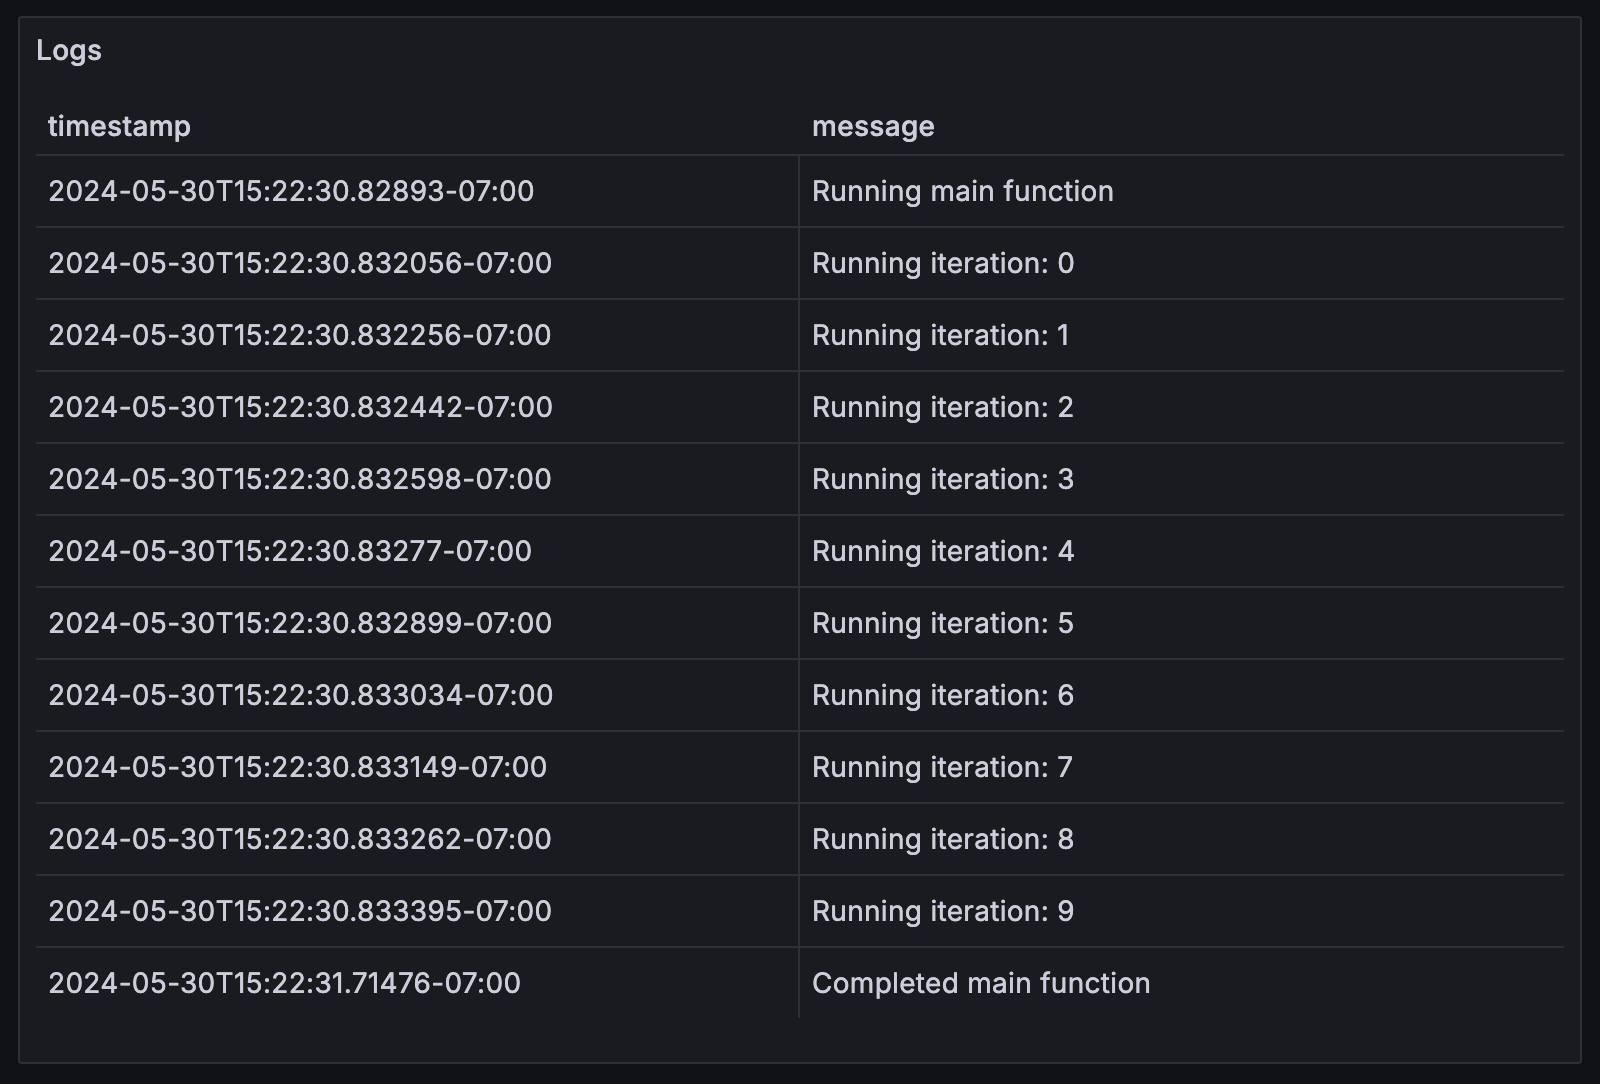
Create dashboards!

