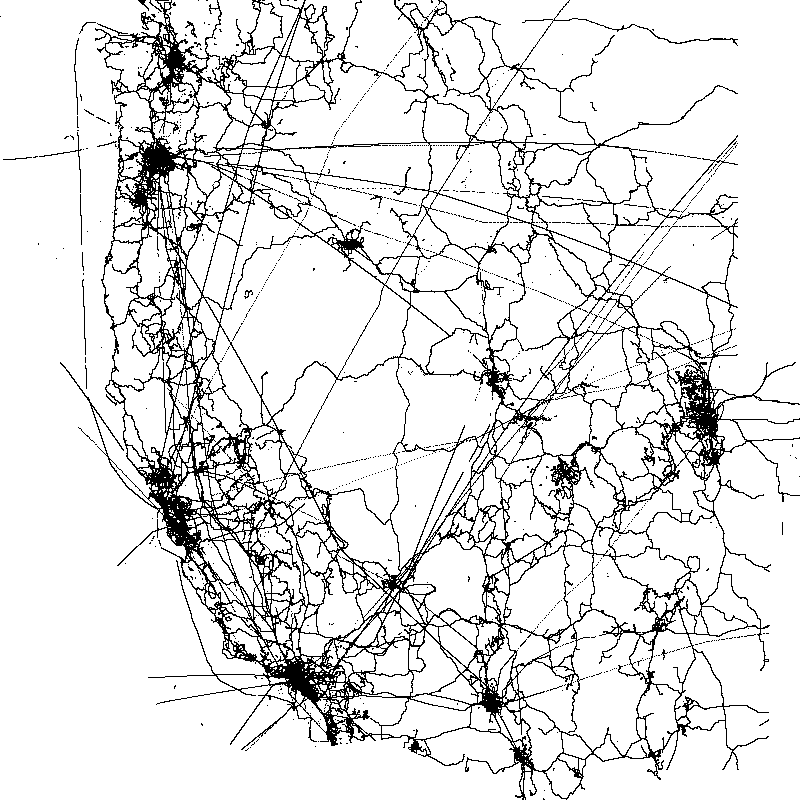
Rendering lots of dots on a map with mapserver and gdal... inspired by https://github.com/springmeyer/dot-render
@springmeyer gave a great talk last night at the monthly CUOGS meeting (http://cugos.org/meetings/2013/03/20/cugos_monthly/) where he talked about benchmarking rendering by trying to LOTS of dots. He waved the magic Mapnik wand and wrote a cool little c++ app to read in a CSV with 40690231 points (GPS locations from OSM downloaded from http://zverik.osm.rambler.ru/gps/files/extracts/usa/index.html). I dont have the exact times, but he was rendering an 800x800px png as output on his laptop in under a minute. Pretty cool and he showed some cool profiling.
Well, I got home and thought about two other ways to render this monster CSV to test some timing.
-
Wrap the CSV in an OGR VRT and crank that data through Mapserver to render the map
-
Wrap the CSV in an OGR VRT and then run gdal_rasterize on it and let GDAL create an image
-
These tests where done on a Linux desktop with a 10k rpm drive, 8-core i7, and 24 gigs of RAM
-
Both of these cases (which use OGR and GDAL at the core) just pegged 1 CPU the whole time when rendering.
-
I have not had time to do any real benckmarking other than what is here.
-
I was not able to get Mapnik installed on this machine so I was not able to run Danes tests... yet.
One issue is that I am trying to do all this without actually writing code... instead using existing tools. To get OGR to be able to read the data I needed to pre-process the CSV file to convert the encoded Lat and Lon into normal values that OGR would be happy with.
These are comma separated, raw lat / lon coordinates in a simple text format.
To get the coordinates divide each number by 10**7.
OK... to do this I just ran some quick command line foo on it:
-
Download the data
wget http://zverik.osm.rambler.ru/gps/files/extracts/usa/us-west.csv.xz -
Unpack the data
xz -k -d us-west.csv.xz -
Divide the Lat and Lon values in the file and create a new CSV with the modified values
aaronr@aaron-zlinux-office1:~/github/dot-render-ms-gdal$ time awk -F, '{ $1 = ($1 / 10000000); $2 = ($2 / 10000000); print $1","$2","$3}' us-west.csv > us-west_processed.csv 3m5.568s 3m2.407s 0m1.684s -
We need to add a header to the file so OGR knows which columns are Lat and Lon
aaronr@aaron-zlinux-office1:~/github/dot-render-ms-gdal$ time sed -i '1i Lat,Lon,Foo' us-west_processed.csv 0m58.988s 0m13.917s 0m41.427s -
We write a VRT (us-west_processed.vrt) in this repo that references the CSV
<OGRVRTDataSource> <OGRVRTLayer name="us-west_processed"> <SrcDataSource>us-west_processed.csv</SrcDataSource> <GeometryType>wkbPoint</GeometryType> <LayerSRS>WGS84</LayerSRS> <GeometryField encoding="PointFromColumns" x="Lon" y="Lat"/> </OGRVRTLayer> </OGRVRTDataSource> -
Finally we make sure OGR can read it
  aaronr@aaron-zlinux-office1:~/github/dot-render-ms-gdal$ ogrinfo us-west_processed.vrt
  INFO: Open of `us-west_processed.vrt'
        using driver `VRT' successful.
  1: us-west_processed (Point)
-
Next we write a mapfile (dots.map) in this repo that references this VRT and will render the dots. Here is the LAYER definition:
LAYER NAME "points" CONNECTIONTYPE OGR CONNECTION "us-west_processed.vrt" PROJECTION "init=epsg:4326" END TYPE point STATUS ON CLASS NAME "default" STYLE SYMBOL "circle" SIZE 1 COLOR 0 0 0 END # END STYLE END # END CLASS END # END LAYER -
Fire it off (using the same extent, data, and output image size as Danes example)
  aaronr@aaron-zlinux-office1:~/github/dot-render-ms-gdal$ time shp2img -m dots.map -o dots.png -s 800 800 -l points -e -127.7923332999999957 31.3267771000000010 -102.0448844000000008 49.0113344000000026

  3m18.973s
  3m18.192s
  0m0.364s
3 minutes and 20 seconds.
-
Run gdal_rasterize on our image, creating a 1 band geotiff
aaronr@aaron-zlinux-office1:~/github/dot-render-ms-gdal$ time gdal_rasterize -l us-west_processed -te -127.7923332999999957 31.3267771000000010 -102.0448844000000008 49.0113344000000026 -ts 800 800 -burn 0 -a_nodata 255 us-west_processed.vrt dots_gdal.tiff 0...10...20...30...40...50...60...70...80...90...100 - done. 1m34.454s 1m32.502s 0m1.752s -
Run gdal_translate to convert the tiff to PNG
  aaronr@aaron-zlinux-office1:~/github/dot-render-ms-gdal$ time gdal_translate -of "PNG" dots_gdal.tiff dots_gdal.png
  Input file size is 800, 800
  Warning 6: PNG driver doesn't support data type Float64. Only eight bit (Byte) and sixteen bit (UInt16) bands supported. Defaulting to Byte

  0...10...20...30...40...50...60...70...80...90...100 - done.

  0m0.063s
  0m0.052s
  0m0.008s
1 minute 35 seconds

