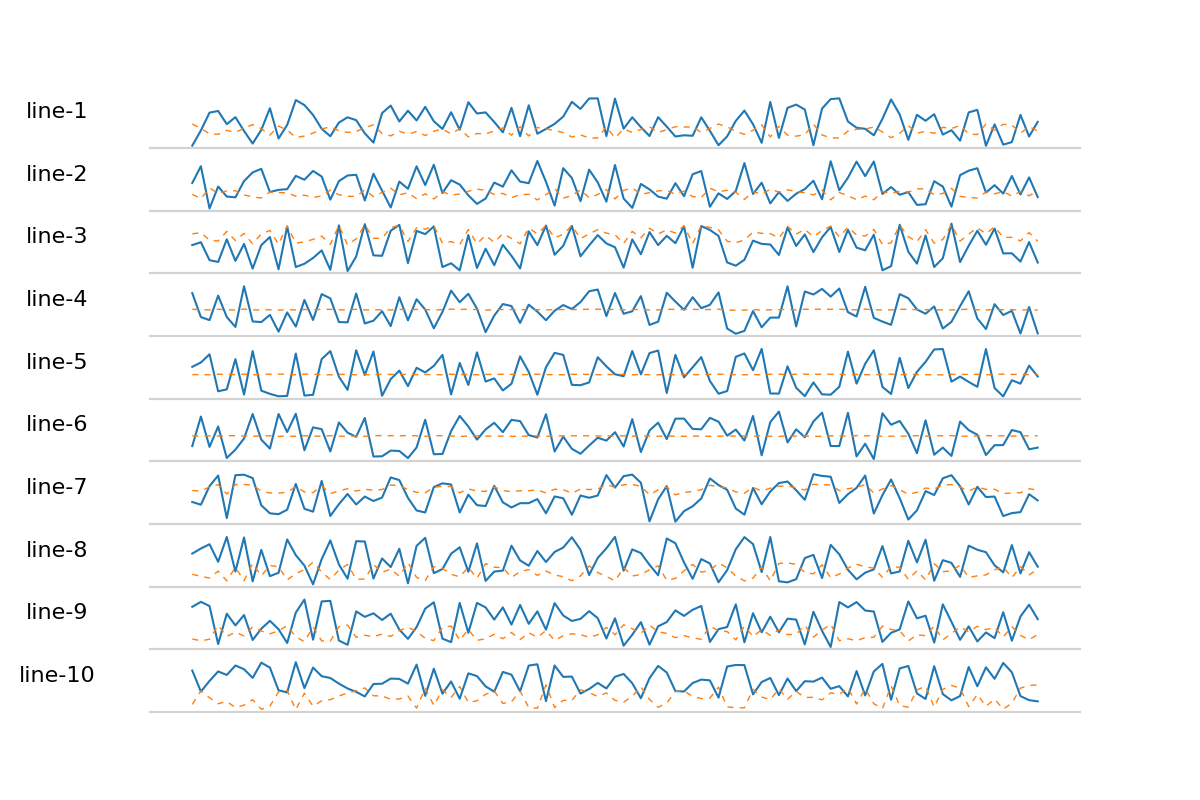
Here's a small package to create neat sparklines with matplotlib with minimal customization effort:
>>> import matplotlib.pyplot as plt
>>> import numpy as np
>>> from spyklines import SparkLine
>>>
>>> ax = plt.subplot(111)
>>> sparkline = SparkLine('my line', np.random.randint(100, 500, size=100))
>>> sparkline.plot(ax)
>>> plt.show()
The following code sample will create 10 sparklines each with its own trendline:
number_of_plots = 10
plt.figure(figsize=(6, 4))
for i in range(1, number_of_plots + 1):
	ax = plt.subplot(number_of_plots, 1, i)
	values = np.random.randint(100, 500, size=100)
	sparkline = SparkLine('line-{}'.format(i), values)
	sparkline.plot(ax)
	trendline = TrendLine('line-{}'.format(i), values)
	trendline.plot(ax)
plt.show()
- It requires that you create and manage your matplotlib figure and axes
- It is compatible with both python 2 and 3
