This project was created for the convenience of RGBT Tracking researchers. By utilizing this tool, you will be able to easily implement the following features:
- Use the same tool to evaluate your tracking results on different RGBT datasets.
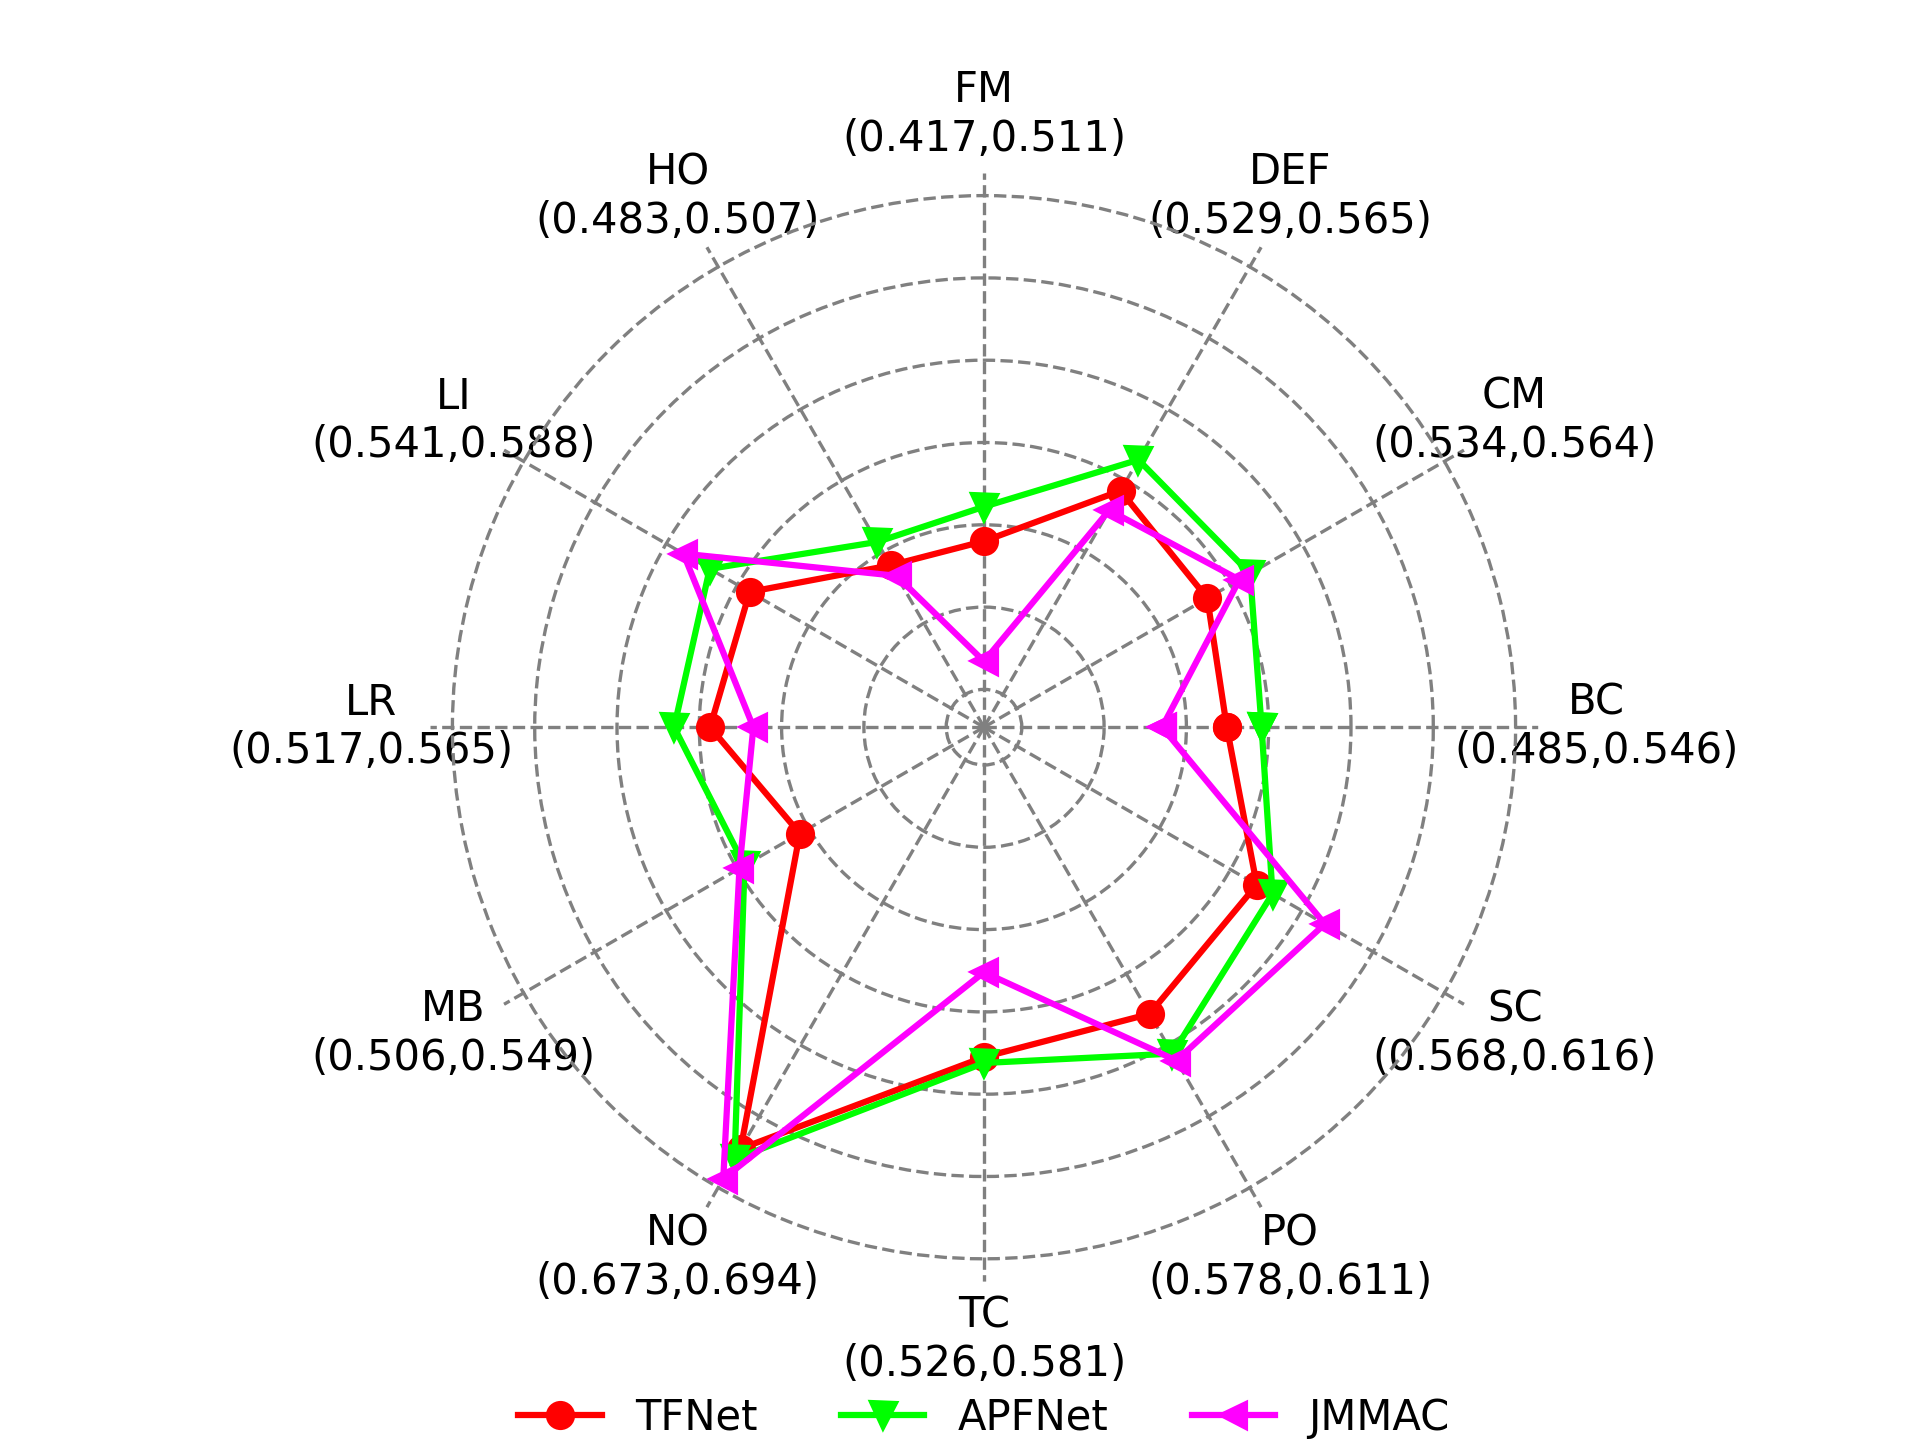
- The test results of each attribute are available and a radar chart is obtained. You can also test an attribute individually.
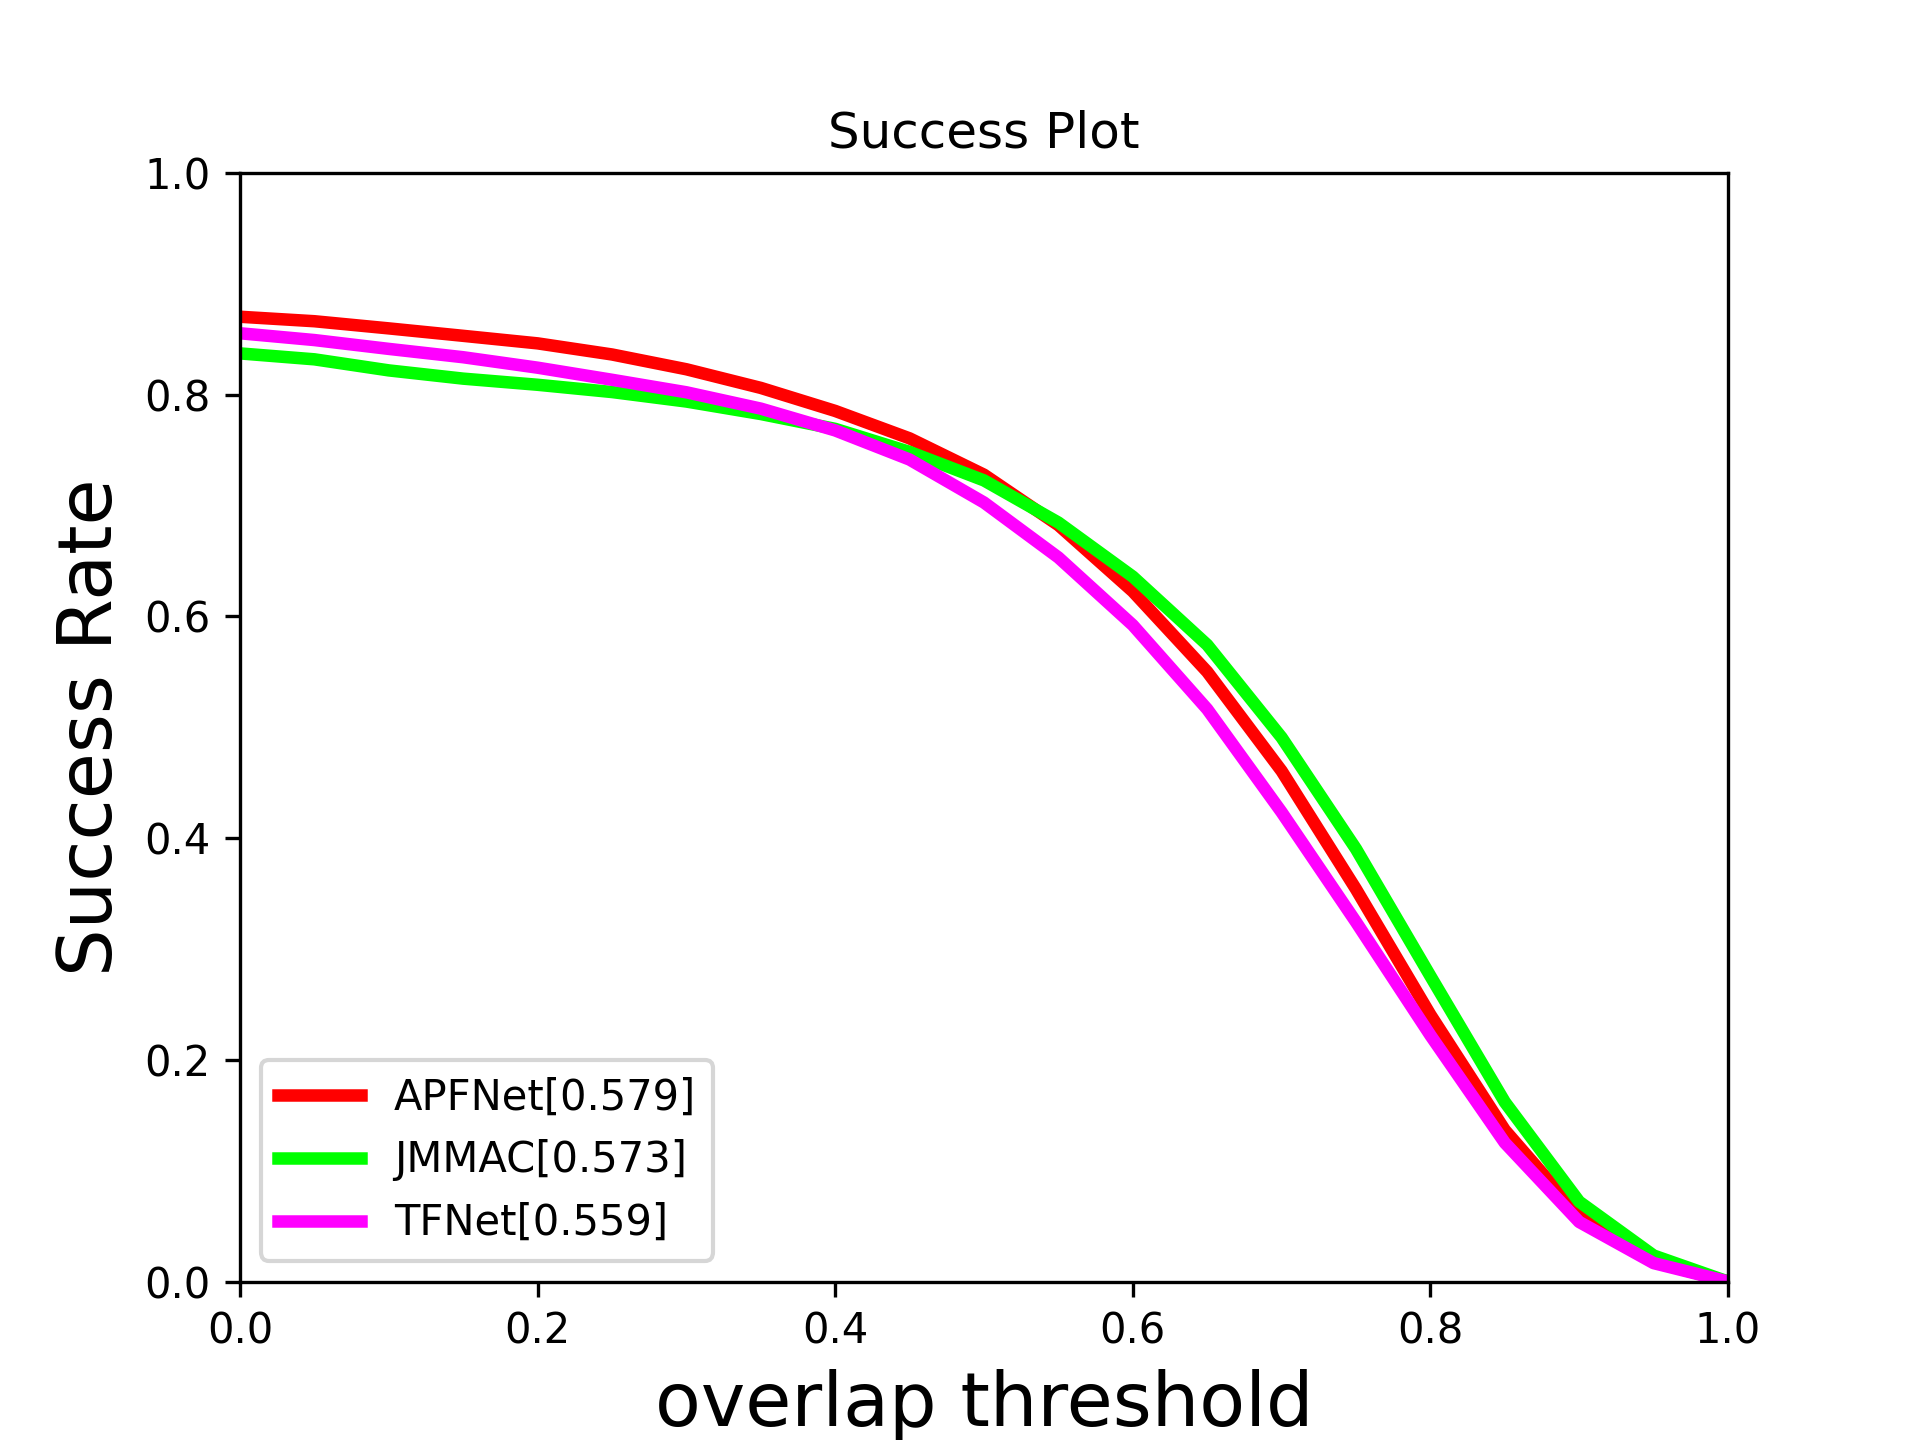
- Precision plot and other plot are available.
- Supports GTOT, RGBT210, RGBT234, LasHeR datasets.
经测试,由于计算精度的差异,部分情况下会与原始工具箱产生
0.1%的误差。所有数据集都经过论文中给定结果的校准。
It was tested to produce0.1%error from the original toolbox in some cases due to differences in computational accuracy. All datasets are calibrated for the given results in the paper.
pip install rgbt
We provide the ground truth file, so you can directly call it.
from rgbt import RGBT234

rgbt234 = RGBT234()

# Register your tracker
rgbt234(
    tracker_name="APFNet",
    result_path="./result/RGBT234/APFNet",
    bbox_type="corner")

rgbt234(
    tracker_name="TFNet",
    result_path="./result/RGBT234/TFNet",
    bbox_type="corner",
    prefix="TFNet_")

# Evaluate multiple trackers
pr_dict = rgbt234.MPR()
print(pr_dict["APFNet"][0])

# Evaluate single tracker
apf_pr,_ = rgbt234.MPR("APFNet")
print(apf_pr)

# Evaluate single challenge
pr_tc_dict = rgbt234.MPR(seqs=rgbt234.TC)
sr_tc_dict = rgbt234.MSR(seqs=rgbt234.TC)

# Draw a radar chart of all challenge attributes
rgbt234.draw_attributeRadar(metric_fun=rgbt234.MPR, filename="RGBT234_MPR_radar.png")
rgbt234.draw_attributeRadar(metric_fun=rgbt234.MSR)     # this is ok

# Draw a curve plot.
rgbt234.draw_plot(metric_fun=rgbt234.MPR)
rgbt234.draw_plot(metric_fun=rgbt234.MSR)
Any operation requires only one line of code.
对于最早的GTOT,后来的RGBT210,234,以及最新的LasHeR,在各种指标上计算方式有比较多的不同,导致大概2个点的误差。 经过仔细比对,发现这些差异并不会导致相对性能的变化。为了与历史跟踪器进行公平比较,我们对于这些差异做了兼容。
这使得在测试GTOT时,需要在测试前额外调用RGBT_start()。
from rgbt import GTOT
from rgbt.utils import RGBT_start,RGBT_end

RGBT_start()
gtot = GTOT()

# Register your tracker
gtot(
    tracker_name="APFNet",
    result_path="./result/GTOT/APFNet",
    bbox_type="corner",
    prefix="")

pr_dict = gtot.MPR()

gtot.draw_plot(metric_fun=gtot.MPR)
gtot.draw_plot(metric_fun=gtot.MSR)

RGBT_end()
