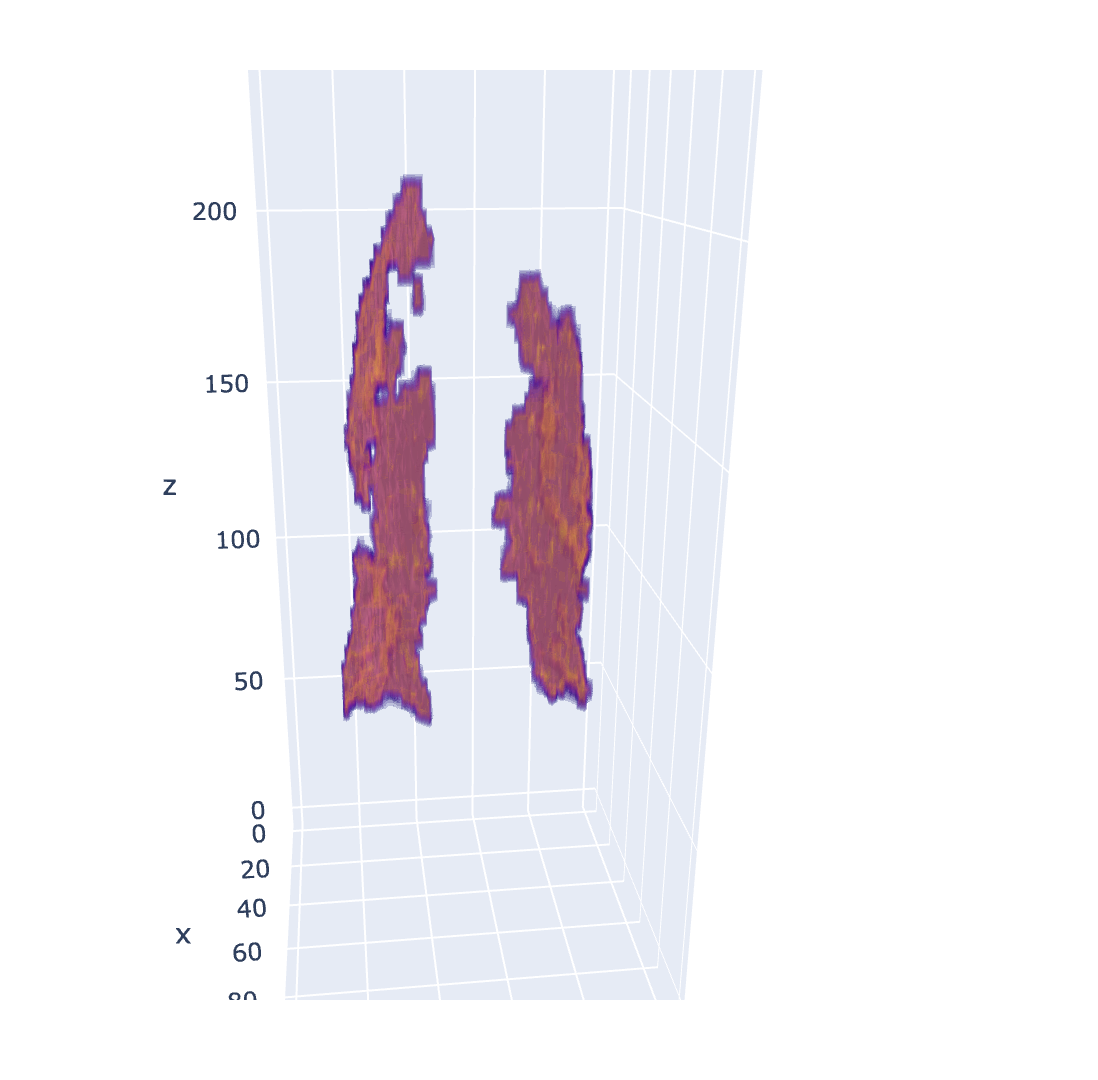
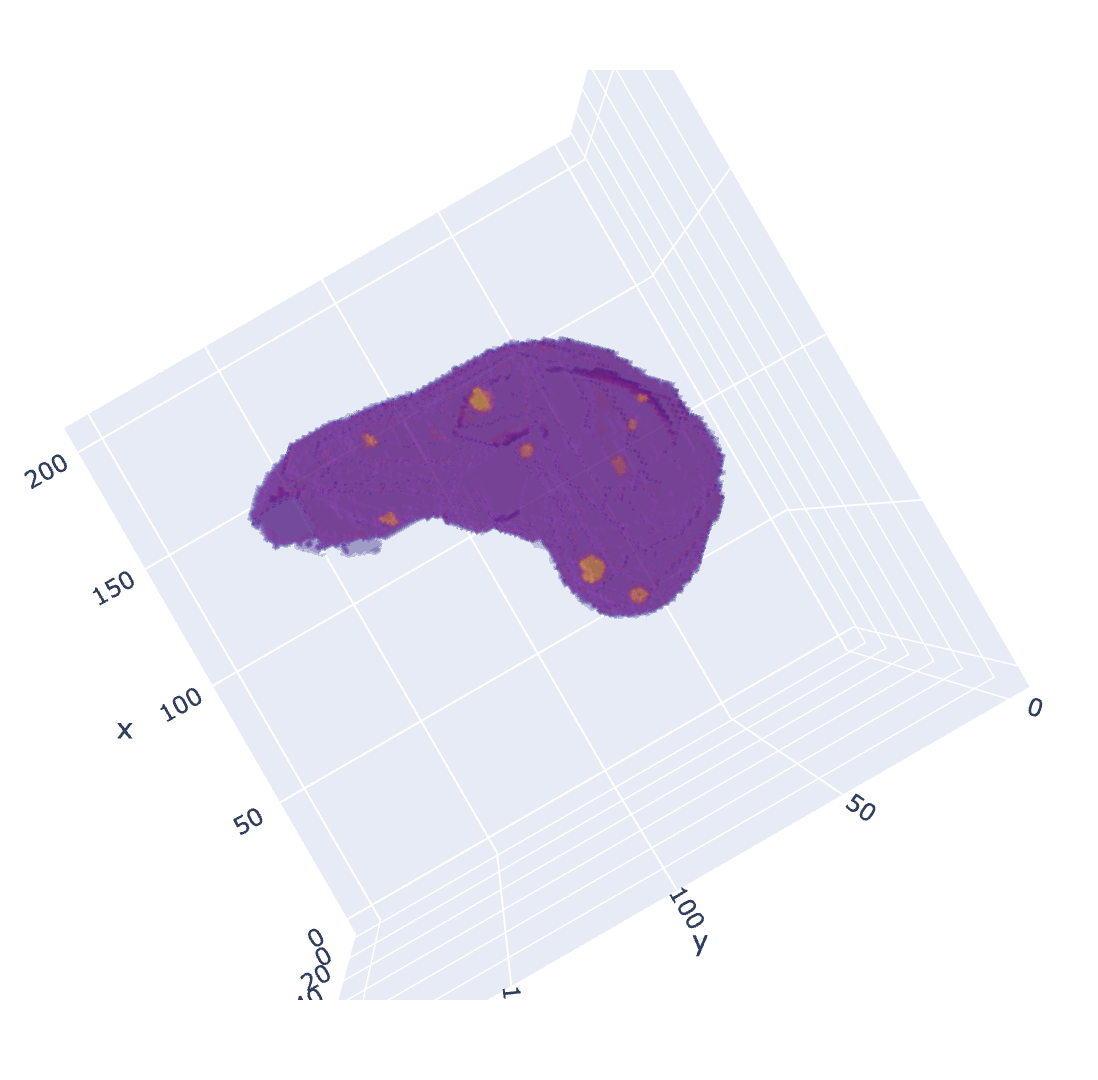
This function creates a 3D plot of the segmentation mask using plotly.
The plot can be extracted to a html file and can be viewed with your browser. Here are some fo the plots generated.
| Covid Infection mask | Liver Tumor mask (with organ) |
|---|---|
 |
 |
mask_visualize.py is the source file for the function plotmask(). The function takes mask as the input. The mask should be a numpy array with categorical values for the mask.
You can also change the zoom_ratio to make the plot look bigger or smaller than the original dimensions of the mask. Plotly takes time to render the plots and consumes a lot of memory. So, it is safe to reduce the dimensions significantly to 40% or 10% of original for a faster rendering and safe display without crashes.
enlarge_by enables you to enlarge the pixels and gives you bigger view of the organs or segmentations.
img_type gives you an option to choose the type of image as either html or png. Html format is interactive while png is static. Default is 'html'.
show_img to display image from console. Default is False.
renderer is an option given to plotly to render the plot on a given platform you are using. You can refer to Plotly for more information on renderers.
Data for liver lesions: Kaggle - Liver Tumor Segmentation
Data for Covid infection masks: Kaggle - COVID-19 CT scans
Thanks to this amazing tutorial by MrPSolver