JavaScript Awesome Development Environment (in Emacs)
Jade connects to a browser tab or nodejs process and provides many features for JavaScript development, including:
- a REPL (with auto completion) & object inspection;
- an inspector, with history and navigation;
- a scratch buffer (
M-x jade-scratch); - JavaScript evaluation in JS buffers with
jade-interaction-mode; - a stepping Debugger, similar to
edebug, orcider.
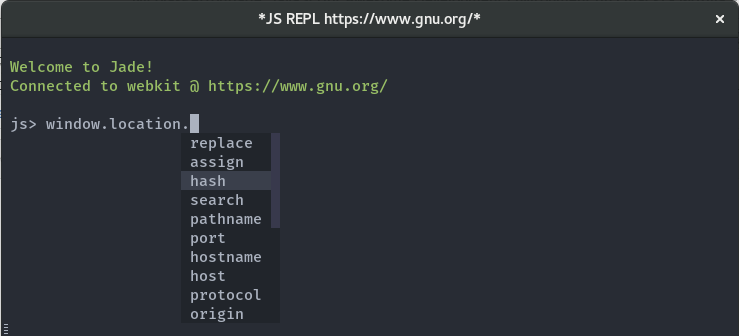
The REPL with company-mode
The REPL showing clickable output
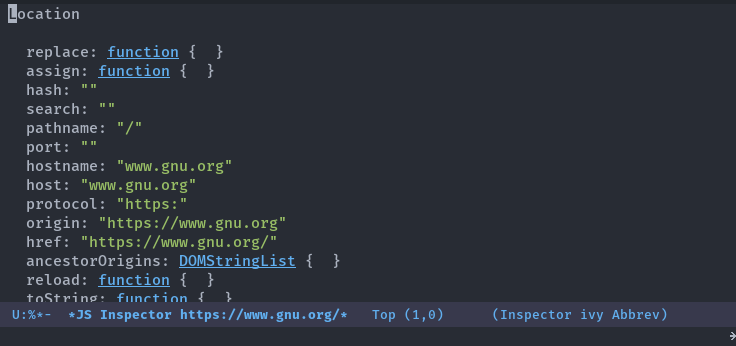
The inspector
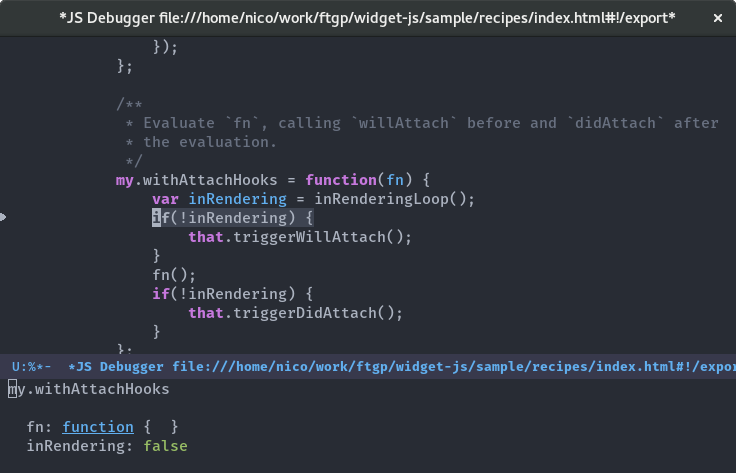
The stepping debugger, and an inspector on locals
(Emacs 25 is required)
It's available on melpa:
M-x package-install jade
Chrom[e|ium] >= 54.0 is required for Jade to properly work (debugging protocol v1.2).
Start chrom[e|ium] with the --remote-debugging-port flag:
chromium --remote-debugging-port=9222 https://gnu.org
Evaluate M-x jade-connect-to-chrome.
Nodejs >= 6.9.1 is required for Jade to work.
Start a node process with the --inspect flag:
node --inspect myfile.js
Evaluate M-x jade-connect-to-nodejs.
If you wish to break on the first line of the application code, start node using:
node --inspect --debug-brk myfile.js
Connecting Jade to the node process will open a debugger on the first line of the application code.
Add the following to enable evaluation in all JS buffers:
(add-hook 'js2-mode-hook #'jade-interaction-mode)
Then C-x C-e will evaluate the node before the point, and C-c M-i will
inspect the result.
The entire buffer can also be executed with jade-eval-buffer.
Jade is young, here's a list of missing/wanted features
Code evaluation usingC-x C-efrom project JS buffers- Adding breakpoints (to remove the need for
debuggerstatements) - Network inspector (could get inspiration from restclient.el)
- DOM inspector
- Start processes (
chromium, node, grunt, gulp, etc.) from Emacs and attach a jade connection to it.
There is currently support for Chrom[e|ium], & nodejs. The firefox backend is currently missing.


