npm install --save @last9/openapm@latest
In the example below, the metrics will be served on localhost:9097/metrics. To
change the port, you can update it through the options
(See the options documentation).
const express = require('express)
const { OpenAPM } = require('@last9/openapm')

const app = express();
const openapm = new OpenAPM();

app.use(openapm.REDMiddleware);

// ...

app.listen(3000)This currently supports instrumentation for all Node.js ORMs, which are mysql2 compatible.
Ensure to add this line of code before you initialize db connection/pool/poolCluster.
openapm.instrument('mysql');OpenAPM currently supports RED Metrics for NestJS v4 and above.
openapm.instrument('nestjs');const openapm = new OpenAPM({
// Options go here
});-
path: The path at which the metrics will be served. For eg./metrics -
metricsServerPort: (Optional) The port at which the metricsServer will run. -
environment: (Optional) The application environment. Defaults toproduction. -
defaultLabels: (Optional) Any default labels to be included. -
requestsCounterConfig: (Optional) Requests counter configuration, same as Counter inprom-client. Defaults to{ name: 'http_requests_total', help: 'Total number of requests', labelNames: ['path', 'method', 'status'], }
-
requestDurationHistogramConfig: (Optional) Requests Duration histogram configuration, the same as Histogram inprom-client. Defaults to{ name: 'http_requests_duration_milliseconds', help: 'Duration of HTTP requests in milliseconds', labelNames: ['path', 'method', 'status'], buckets: promClient.exponentialBuckets(0.25, 1.5, 31), }
-
extractLabels: (Optional) Extract labels from URL params (WIP: Headers, Subdomain)// To extract from the URL params { ... extractLabels: { tenant: { // Here 'tenant' is the label name from : 'params', key: 'org' // Which key to extract from the params mask: ':org' // Replacement string } } }
-
excludeDefaultLabels: (Optional) Provide labels to exclude from the default labels
{
  ...
  excludeDefaultLabels: ['environment', 'version']
}levitateConfig: (Optional) Configuration for Levitate TSDB. Adding this configuration will enable the Change Events.
{
   ...
   levitateConfig: {
      host: 'https://app.last9.io',
      orgSlug: 'last9', /** The slug can be obtained from the Last9 dashboard.*/
      dataSourceName: 'data-source', /** The data source can be obtained from the data source pages in the Last9 dashboard*/
      refreshTokens: {
         write: '0d2a1a9a45XXXXXXXXXXXXXX3f1342790d2a1a9a45XXXXXXXXXXXXXX3f1342790d2a1a9a45XXXXXXXXXXXXXX3f134279' /** You can get this from the API access page on Last9 dashboard*/
      }
   }
}Make sure you are in the express directory.
- Install packages
npm install
-
Build package
- This will build the package and store the JS and type declaration files in
the
distfolder.
- This will build the package and store the JS and type declaration files in
the
npm run build
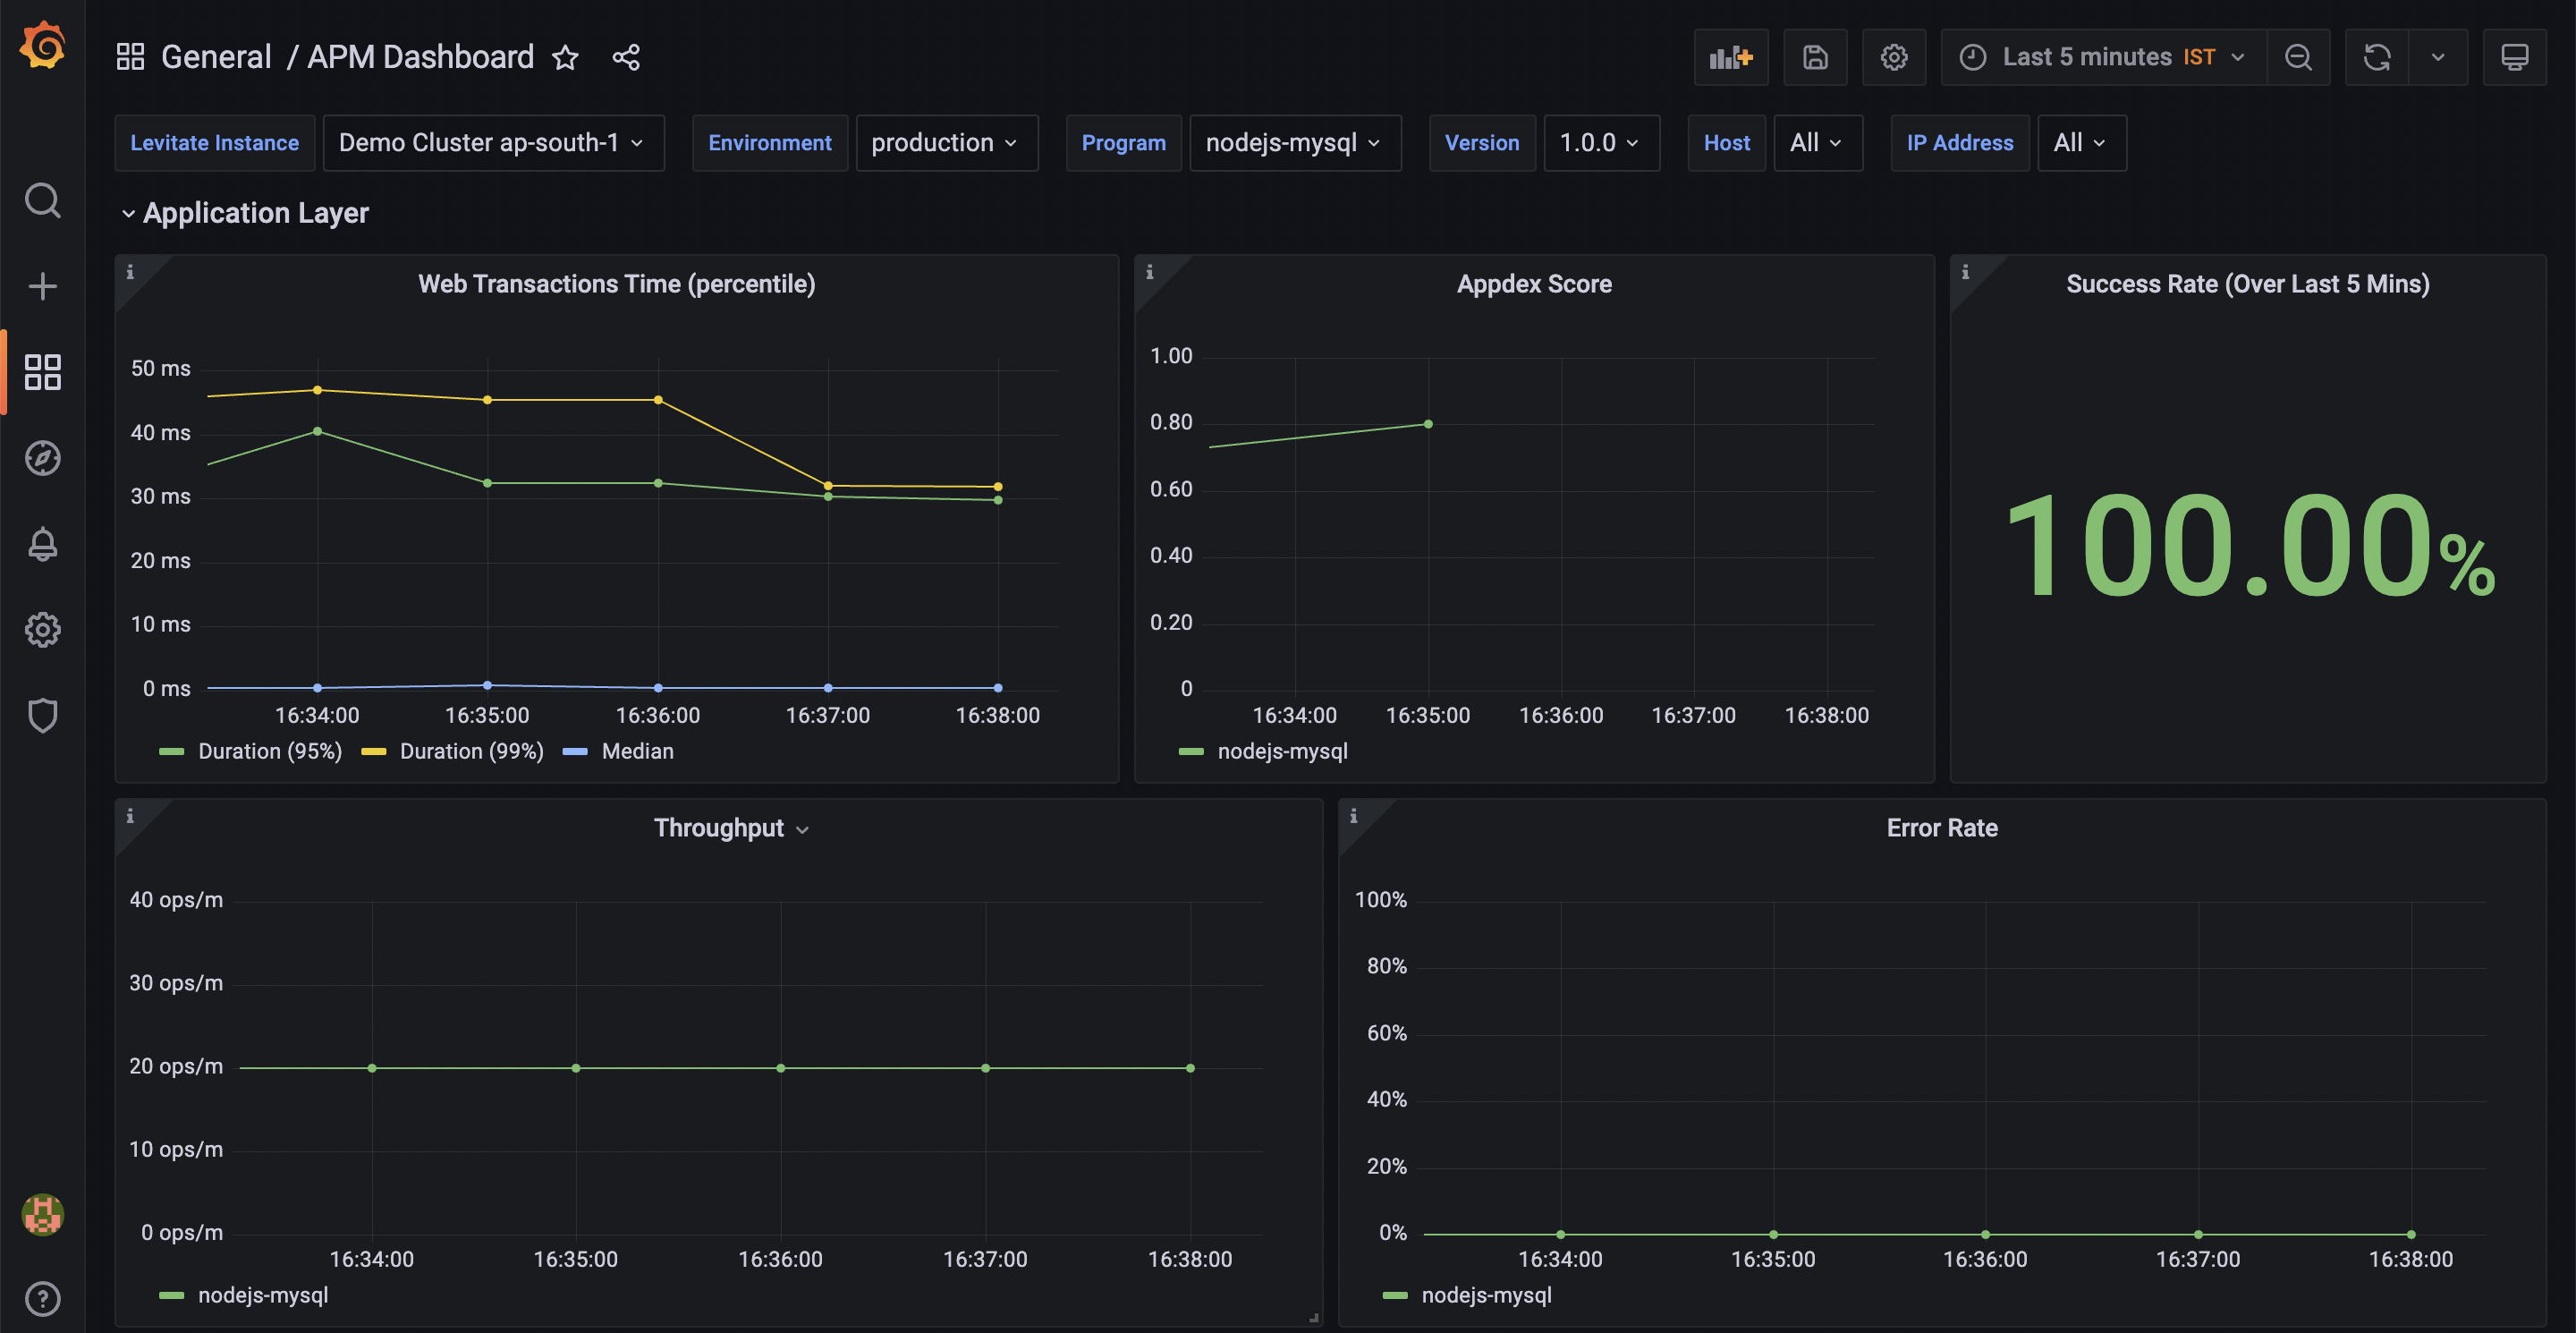
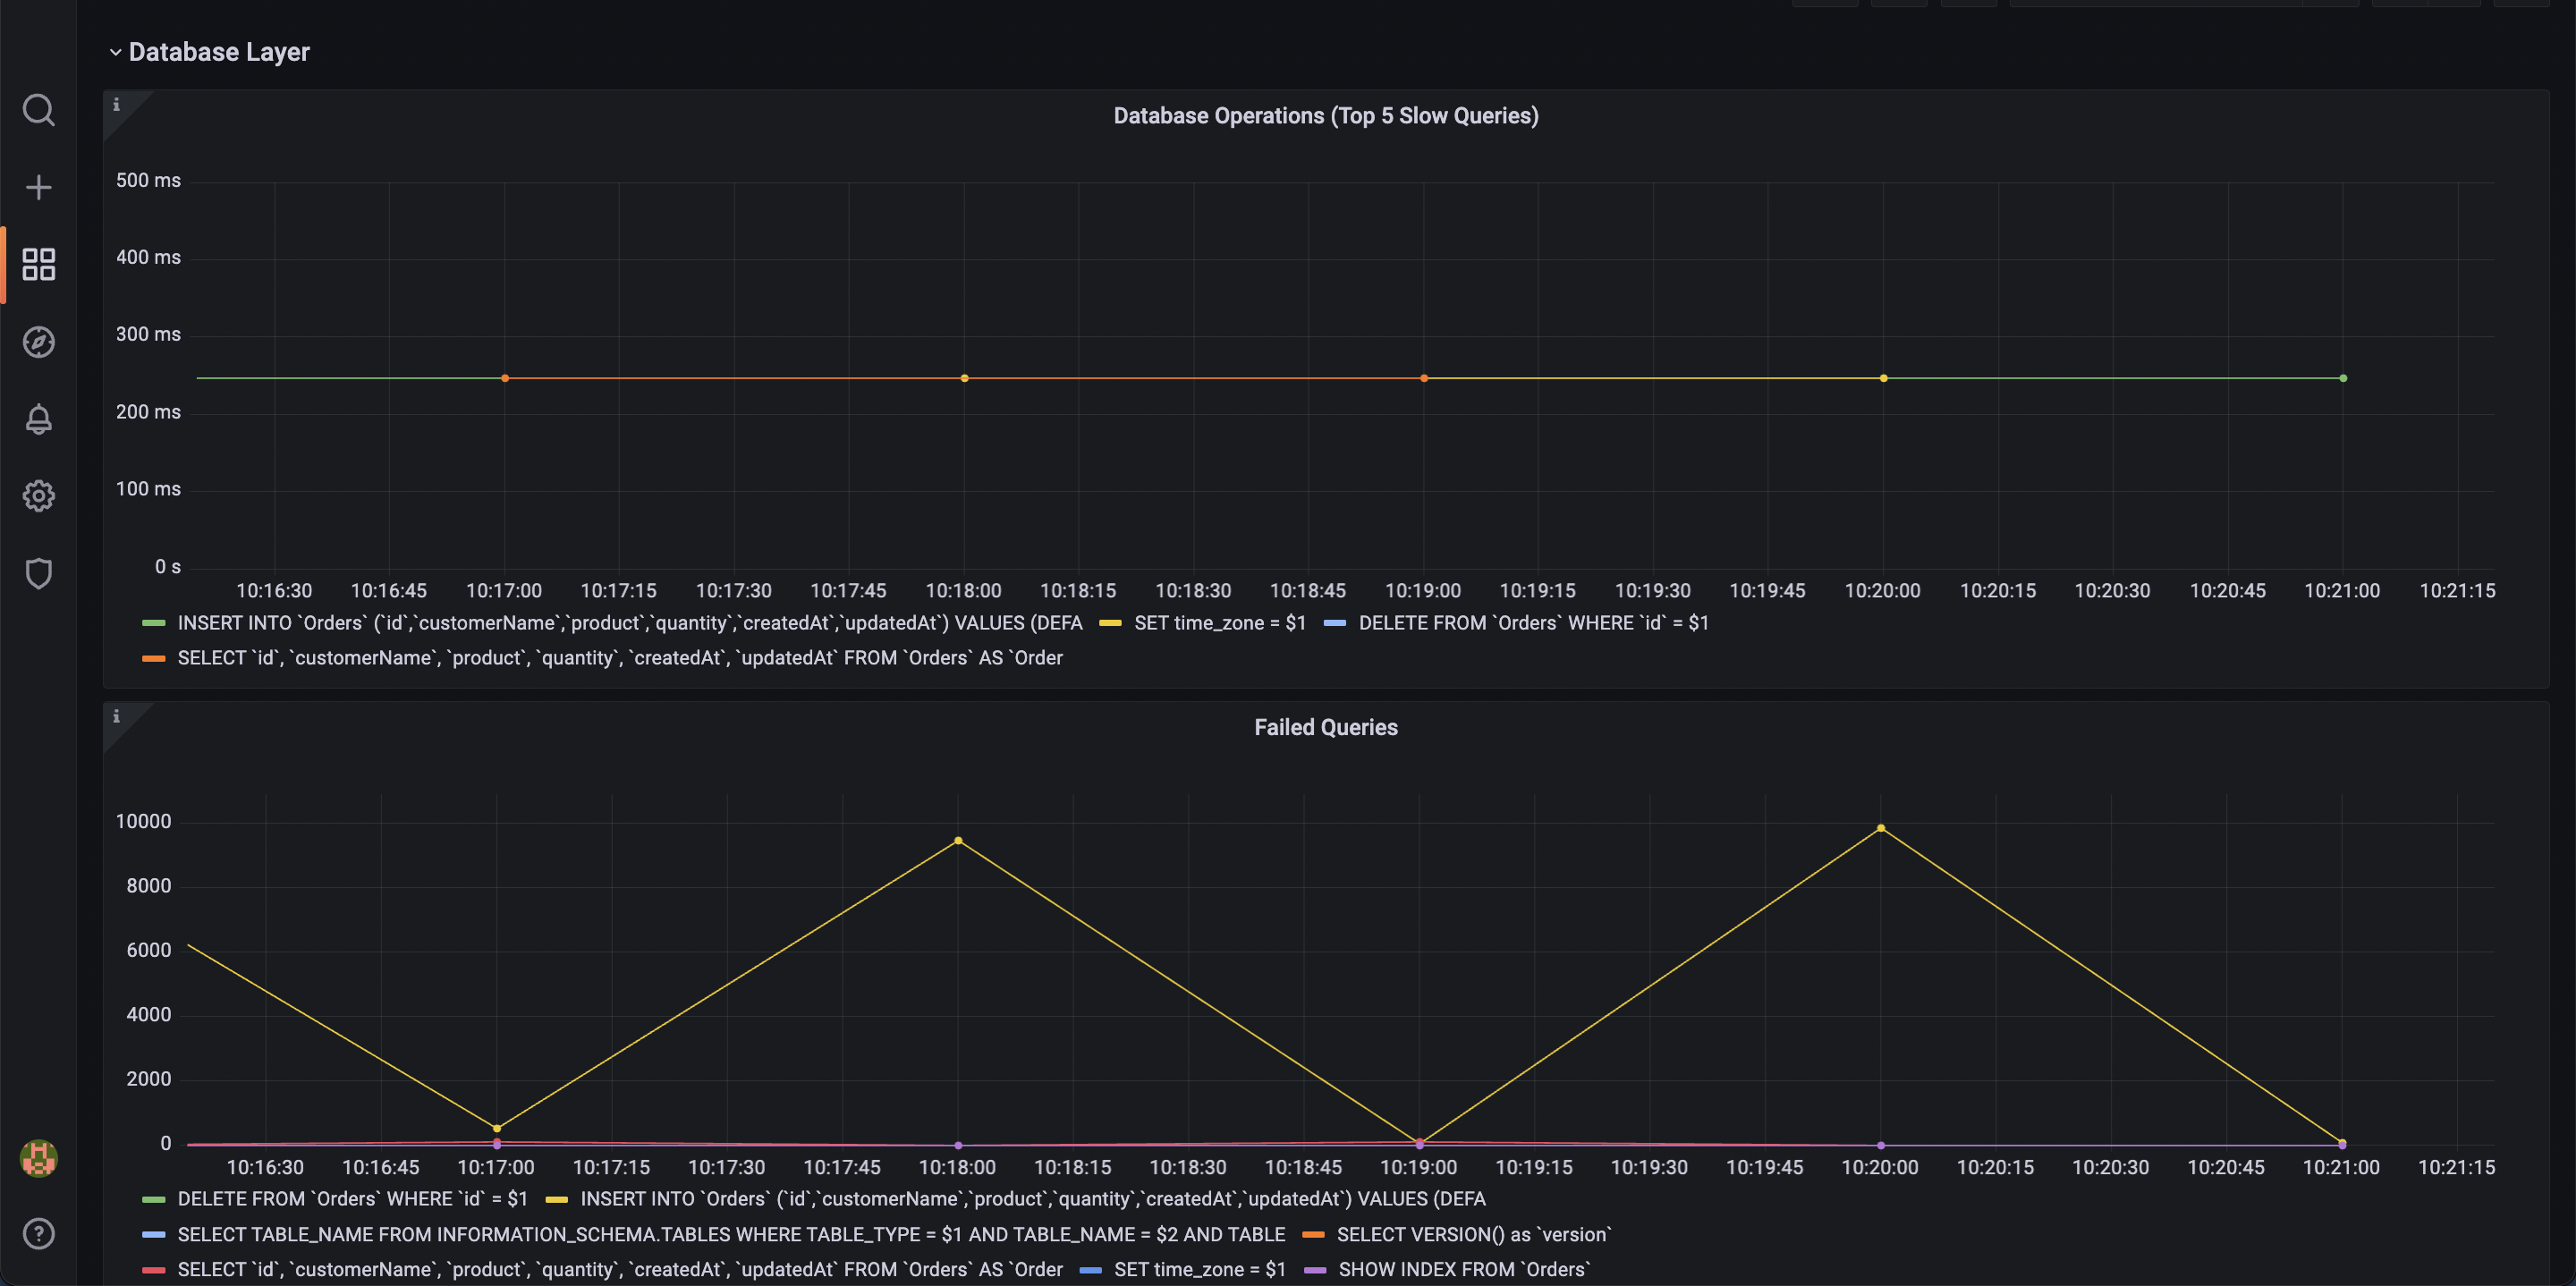
- Import this dashboard into your Grafana
- Select your data source
- Save the dashboard
Last9 builds reliability tools for SRE and DevOps.


