In previous versions, it was possible to rely on username/password to authenticate to Confluent Cloud. Nowadays, only the API key/secret is officially supported to connect to the Metrics API.
To ensure backward compatibility, previous environment variables are still available. Nonetheless, username/password is now deprecated and you must rely on API key/secret.
A simple prometheus exporter that can be used to extract metrics from Confluent Cloud Metric API. By default, the exporter will be exposing the metrics on port 2112. To use the exporter, the following environment variables need to be specified:
CCLOUD_API_KEY: The API Key created withccloud api-key create --resource cloudCCLOUD_API_SECRET: The API Key Secret created withccloud api-key create --resource cloud
CCLOUD_API_KEY and CCLOUD_API_SECRET environment variables will be used to invoke the https://api.telemetry.confluent.cloud endpoint.
./ccloudexporter -cluster <cluster_id>Usage of ./ccloudexporter:
-cluster string
Cluster ID to fetch metric for. If not specified, the environment variable CCLOUD_CLUSTER will be used
-config string
Path to configuration file used to override default behavior of ccloudexporter
-delay int
Delay, in seconds, to fetch the metrics. By default set to 120, this, in order to avoid temporary data points. (default 120)
-endpoint string
Base URL for the Metric API (default "https://api.telemetry.confluent.cloud/")
-granularity string
Granularity for the metrics query, by default set to 1 minutes (default "PT1M")
-listener string
Listener for the HTTP interface (default ":2112")
-log-pretty-print
Pretty print the JSON log output (default true)
-no-timestamp
Do not propagate the timestamp from the the metrics API to prometheus
-timeout int
Timeout, in second, to use for all REST call with the Metric API (default 60)
-verbose
Print trace level logs to stdout
-version
Print the current version and exit
go get github.com/Dabz/ccloudexporter/cmd/ccloudexporter
go install github.com/Dabz/ccloudexporter/cmd/ccloudexporter
export CCLOUD_API_KEY=ABCDEFGHIKLMNOP
export CCLOUD_API_SECRET=XXXXXXXXXXXXXXXX
./ccloudexporter -cluster lkc-abc123docker run \
-e CCLOUD_API_KEY=$CCLOUD_API_KEY \
-e CCLOUD_API_SECRET=$CCLOUD_API_SECRET \
-e CCLOUD_CLUSTER=lkc-abc123 \
-p 2112:2112 \
dabz/ccloudexporter:latestexport CCLOUD_API_KEY=ABCDEFGHIKLMNOP
export CCLOUD_API_SECRET=XXXXXXXXXXXXXXXX
export CCLOUD_CLUSTER=lkc-abc123
docker-compose up -dKubernetes deployment with Prometheus Operator.
These following lines assume there is Prometheus Operator already running in the cluster with label: release=monitoring.
Add the list of cluster ids separated by spaces in ./kubernetes/ccloud_exporter.env, for example: CCLOUD_CLUSTERS=<cluster_id1> <cluster_id2> ....
cp ./ccloud_exporter.env-template ./kubernetes/ccloud_exporter.env
cd ./kubernetes
vim ./ccloud_exporter.env
make install
A Deployment and a Service object are deployed to a unique namespace. A ServiceMonitor CRD is deployed to the Prometheus Operator namespace.
To delete deployment: cd ./kubernetes && make remove
For more advanced deployment, you could specify a YAML configuration file with the -config flag.
If you do not provide a configuration file, the exporter creates one from the provided flags.
| Key | Description | Default value |
|---|---|---|
| config.http.baseurl | Base URL for the Metric API | https://api.telemetry.confluent.cloud/ |
| config.http.timeout | Timeout, in second, to use for all REST call with the Metric API | 60 |
| config.listener | Listener for the HTTP interface | :2112 |
| config.noTimestamp | Do not propagate the timestamp from the metrics API to prometheus | false |
| config.delay | Delay, in seconds, to fetch the metrics. By default set to 120, this, in order to avoid temporary data points | 120 |
| config.granularity | Granularity for the metrics query, by default set to 1 minute | PT1M |
| rules | List of rules that need to be executed to fetch metrics |
| Key | Description |
|---|---|
| rules.clusters | List of clusters to fetch metrics from |
| rules.labels | Labels to exposed to Prometheus and group by in the query |
| rules.topics | Optional list of topics to filter the metrics |
| rules.metrics | List of metrics to gather |
- A simple configuration to fetch metrics for a cluster: simple.yaml
- A configuration to fetch metrics at the partition granularity for a few topics: partition.yaml
config:
  http:
    baseurl: https://api.telemetry.confluent.cloud/
    timeout: 60
  listener: 0.0.0.0:2112
  noTimestamp: false
  delay: 60
  granularity: PT1M
rules:
  - clusters:
      - $CCLOUD_CLUSTER
    metrics:
      - io.confluent.kafka.server/received_bytes
      - io.confluent.kafka.server/sent_bytes
      - io.confluent.kafka.server/received_records
      - io.confluent.kafka.server/sent_records
      - io.confluent.kafka.server/retained_bytes
      - io.confluent.kafka.server/active_connection_count
      - io.confluent.kafka.server/request_count
      - io.confluent.kafka.server/partition_count
      - io.confluent.kafka.server/successful_authentication_count
    labels:
      - cluster_id
      - topic
- typeIn order to avoid reaching the limit of 1,000 points set by the Confluent Cloud Metrics API, the following soft limits has been established in the exporter:
- In order to group by partition, you need to specify one or multiple topics
- You cannot specify more than 100 topics in a single rule
clusters,labelsandmetricsare required in each rule
go get github.com/Dabz/ccloudexporter/cmd/ccloudexporter
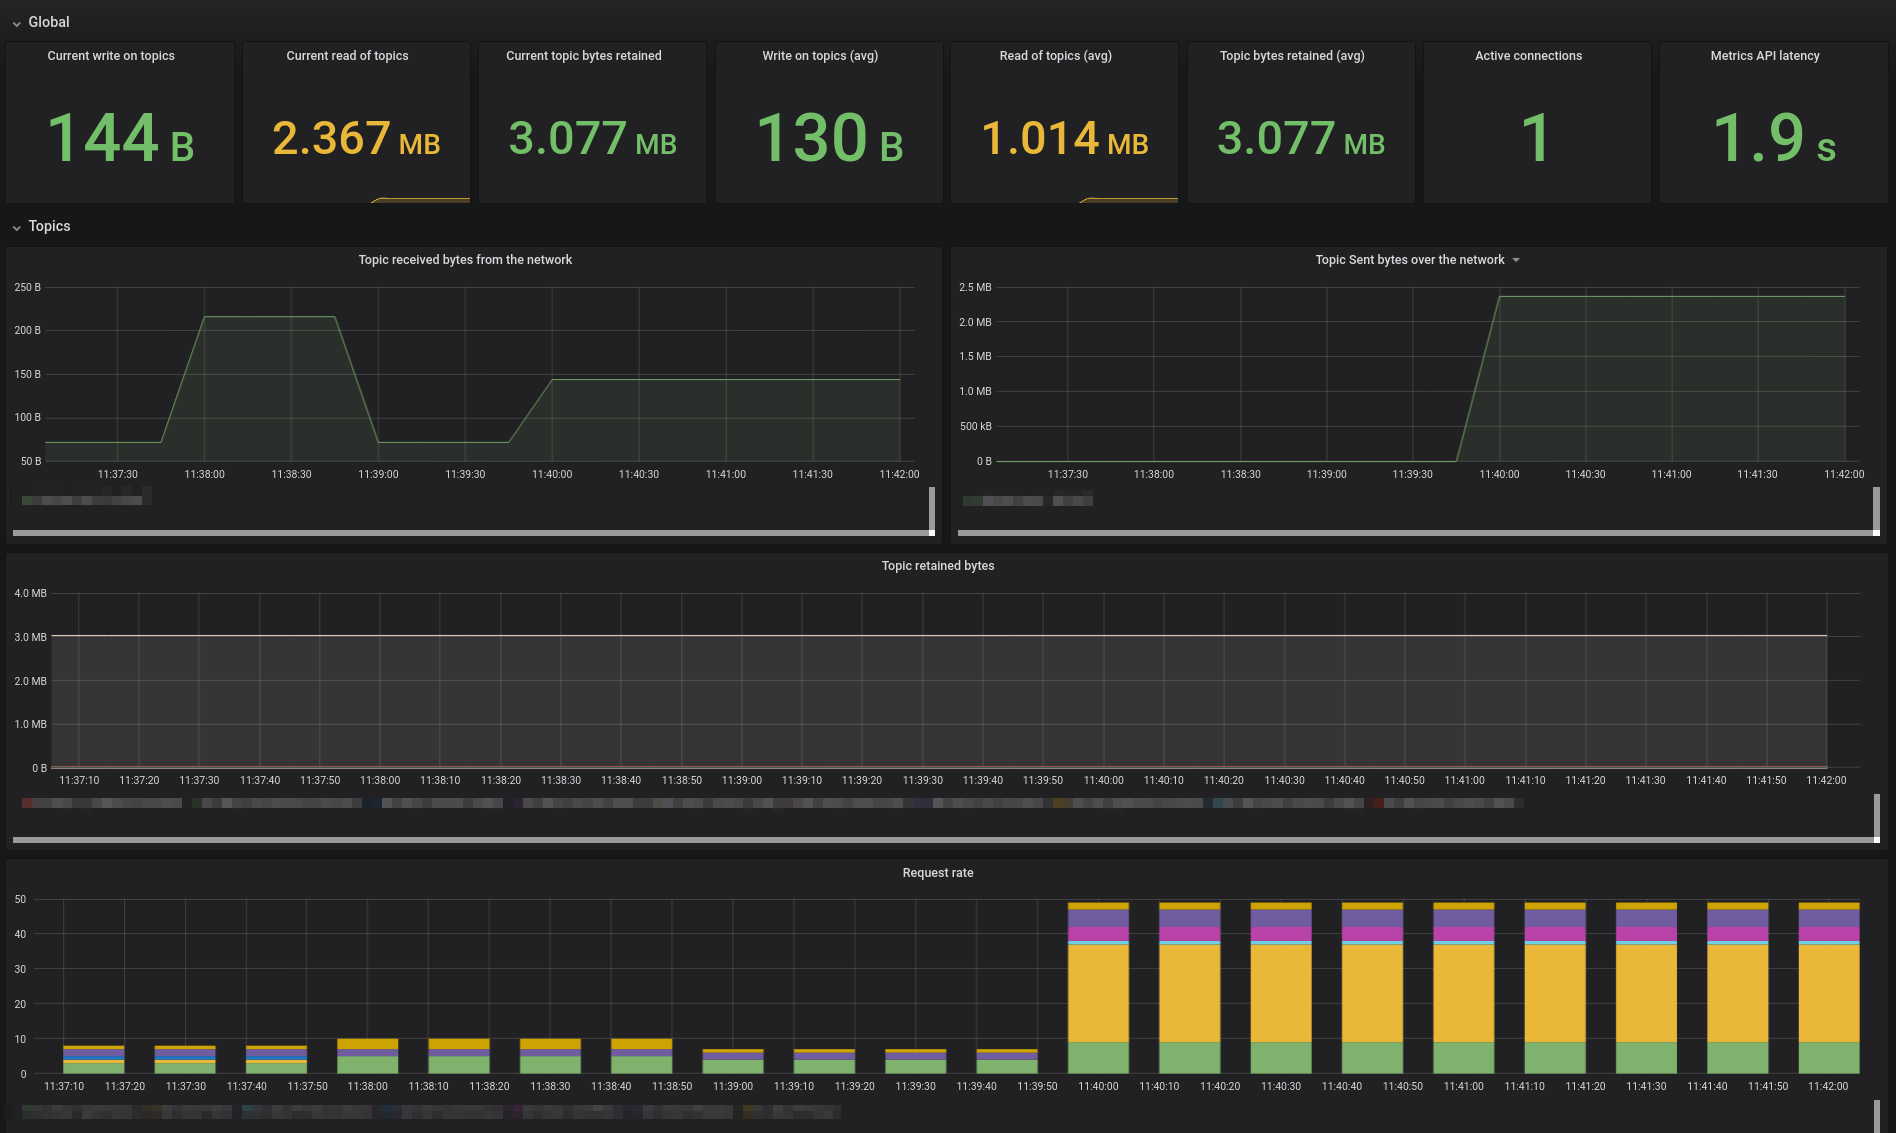
A Grafana dashboard is provided in ./grafana/ folder.
