The IBM Spectrum Scale bridge for Grafana could be used for exploring IBM Spectrum Scale performance data on Grafana dashboards.
Grafana Bridge is a standalone Python application. It translates the IBM Spectrum Scale metadata and performance data collected by the IBM Spectrum Scale performance monitoring tool (ZiMon) to the query requests acceptable by the Grafana integrated openTSDB plugin.
Before installing the IBM Spectrum Scale bridge for Grafana you must install the software prerequisites. Those are:
- Performance Monitoring tool installed and configured on your IBM Spectrum Scale device
- On the collector node the following software need to be installed:
This package could be used for:
- IBM Spectrum Scale devices having mimimum release level 5.0.3 FP2 and above
- Grafana 6.0.0 and above
To use this tool on the older IBM Spectrum Scale devices please refer to the SUPPORT_MATRIX file.
The IBM Spectrum Scale system must run 4.2.1. or above. Run mmlsconfig to view the current configuration data of a GPFS™ cluster).
The bridge works in permanent communication with the pmcollector. Therefore it is recommended to install and run this tool directly on a pmcollector node.
In a multi-collector environment, there is no need to run the bridge on each pmcollector node separately, provided that they are configured in federated mode. Federation basically allows collectors to connect and collaborate with their peer collectors. If the peers have been specified, any query for measurement data must be directed to any of the collectors listed in the peer definition. The chosen collector will collect and assemble a response based on all relevant data from all collectors. For more information, see Performance Monitoring tool overview in IBM Spectrum Scale: Advanced Administration Guide.
Ensure that Python and CherryPy have been installed on the IBM Spectrum Scale system. Check the SUPPORT_MATRIX file for the recommended version.
Clone the repository using git in your favorite directory on the collector node. Alternatively download the zip package and unpack it :
# unzip ibm-spectrum-scale-bridge-for-grafana.zipStart the bridge application by issuing:
# python zimonGrafanaIntf.py If the bridge did establish the connection to the specified pmcollector and the initialization of the metadata was performed successfully, you should get the message "server started" at the end of line. Otherwise check the zserver.log stored in the zimonGrafanaIntf directory. Additionally, check the pmcollector service running properly by issuing:
# systemctl status pmcollectorDownload and install Grafana according to the given instructions. Before you start Grafana for the first time, check the configuration options for port settings. Start the Grafana server as it described on the Grafana configuration pages.
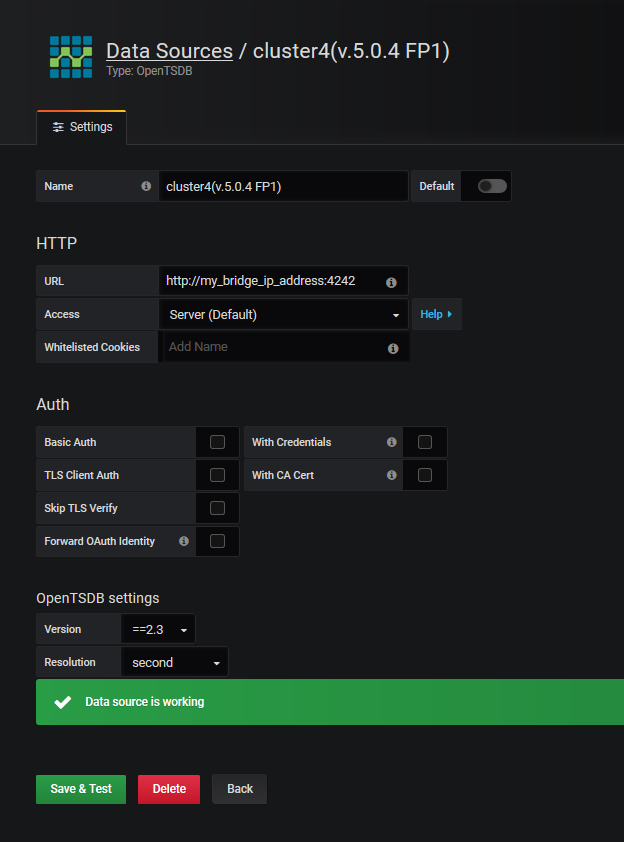
Define a new data source (Data Sources -> Add New)
NOTE: The IBM Spectrum Scale bridge listens on port 4242 for HTTP connections, and on port 8443 for HTTPS connections
Grafana now can talk to Spectrum Scale Performance Monitoring tool via the bridge. Follow the grafana instructions to create dashboards.
At this time, third party contributions to this code will not be accepted.
IBM Spectrum Scale bridge for Grafana is licensed under version 2.0 of the Apache License. See the LICENSE file for details.
