The aim of this repo is to showcase ways of generating evidence to support strategic active network planning tools in England and beyond.
What follows is a language agnostic but fully reproducible (with R, see README.qmd for code) description of input datasets, processes and functions for generating estimates of active travel uptake down to the street level. It will make use of some of the same input datasets that are used in the Propensity to Cycle Tool (PCT). For full reproducibility, the code in this repo is developed in a Docker container using the .devcontainer.json format.
We will cover input datasets, processing steps, and outputs.
The input datasets were extracted from the Propensity to Cycle Tool and
underlying datasets. Small input datasets are saved in the input/
folder of this repo.
Zone data is available at many geographic levels, including large zones (e.g. MSOAs) and small zones (e.g. Output Areas). MSOAs representing York are shown below.
OD data has the following structure:
| geo_code1 | geo_code2 | all | from_home | light_rail | train | bus | taxi | motorbike | car_driver | car_passenger | bicycle | foot | other | geo_name1 | geo_name2 | la_1 | la_2 |
|---|---|---|---|---|---|---|---|---|---|---|---|---|---|---|---|---|---|
| E02002772 | E02002772 | 365 | 0 | 0 | 2 | 8 | 0 | 2 | 147 | 14 | 41 | 150 | 1 | York 001 | York 001 | York | York |
| E02002772 | E02002773 | 27 | 0 | 0 | 0 | 1 | 0 | 0 | 20 | 1 | 2 | 2 | 1 | York 001 | York 002 | York | York |
| E02002772 | E02002774 | 18 | 0 | 0 | 1 | 0 | 0 | 0 | 15 | 2 | 0 | 0 | 0 | York 001 | York 003 | York | York |
| E02002772 | E02002775 | 69 | 0 | 0 | 0 | 9 | 0 | 1 | 51 | 4 | 4 | 0 | 0 | York 001 | York 004 | York | York |
| E02002772 | E02002776 | 253 | 0 | 0 | 1 | 32 | 0 | 7 | 162 | 28 | 20 | 3 | 0 | York 001 | York 005 | York | York |
| E02002772 | E02002777 | 165 | 0 | 0 | 0 | 10 | 0 | 0 | 136 | 11 | 8 | 0 | 0 | York 001 | York 006 | York | York |
| E02002772 | E02002778 | 50 | 0 | 0 | 0 | 2 | 0 | 0 | 41 | 3 | 4 | 0 | 0 | York 001 | York 007 | York | York |
| E02002772 | E02002779 | 42 | 0 | 0 | 0 | 0 | 0 | 0 | 39 | 1 | 1 | 1 | 0 | York 001 | York 008 | York | York |
| E02002772 | E02002780 | 122 | 0 | 0 | 0 | 10 | 0 | 4 | 86 | 9 | 11 | 2 | 0 | York 001 | York 009 | York | York |
| E02002772 | E02002781 | 124 | 0 | 0 | 0 | 10 | 2 | 4 | 89 | 6 | 13 | 0 | 0 | York 001 | York 010 | York | York |
This dataset was extracted from the following open access endpoint: https://s3-eu-west-1.amazonaws.com/statistics.digitalresources.jisc.ac.uk/dkan/files/FLOW/wu03ew_v2/wu03ew_v2.zip
The OD dataset can be visualised in a more policy-relevant way, as illustrated in the next section.
A key dataset type for simulating trips not covered by available OD data is data on trip origins (e.g. representing residential areas and population estimates) and ‘trip attractors’. These can be obtained from OSM. These datasets typically have pont and polygon geometries and numerous features that can feed into trip generation models, a subsection of the enxt section.
There are currently datasets representing origins and destinations in this repo, something that may change in the future.
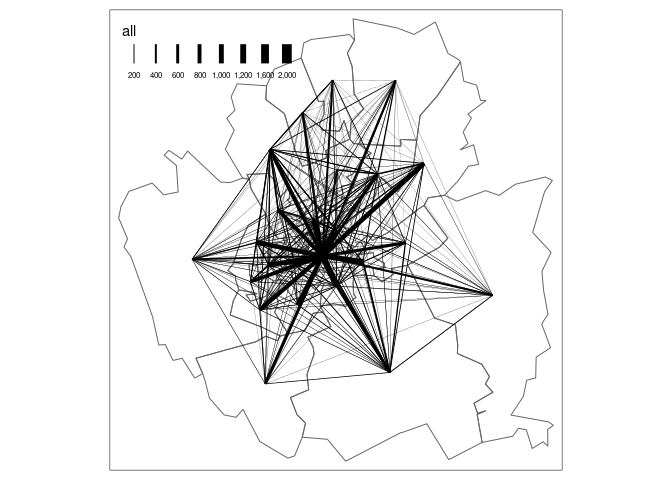
OD data can be effectively represented as desire lines, as follows (see
output/desire_lines.geojson):
Clearly this is an oversimplification. The section on ‘jittering’ demonstrates how disaggregation and setting weighted random start and end points can lead to more realistic desire lines and route networks.
Trip generation is the process of estimating the number of trips between origins and destinations. It can be done using spatial interaction models.
Jittering, sometimes combined with disaggregation of desire lines representing many trips (above a threshold number of trips that can be set by the developer iteratively) distributes start and end points more evenly across origin and destination zones.
The outcome of routing the desire lines shown above is shown below.
The routes illustrated in the figure above and saved in
routes_full.geojson in the repo’s releases took around 4 minutes to
calculate for 576 using OSRM’s public facing instance. That works out at
around 0.4166667, not very fast, we can surely do better!
Another issue with the routes dataset represented below is that there is only a single geometry and set of features for the entirety of each route: segment level outputs from routing engines are more policy relevent.
Uptake functions model change in transport behaviour. They can be combined with scenarios representing changes in travel demand.
In the plot of routes above there are many overlapping lines. To overcome this problem the ‘overline’ function can be used to generate a cohesive route network. The results are shown below.


