Note: an interactive version of this report is available here.
This repo builds on work documented in the srn repo, focussing on active travel potential and severance around major transport infrastructure.
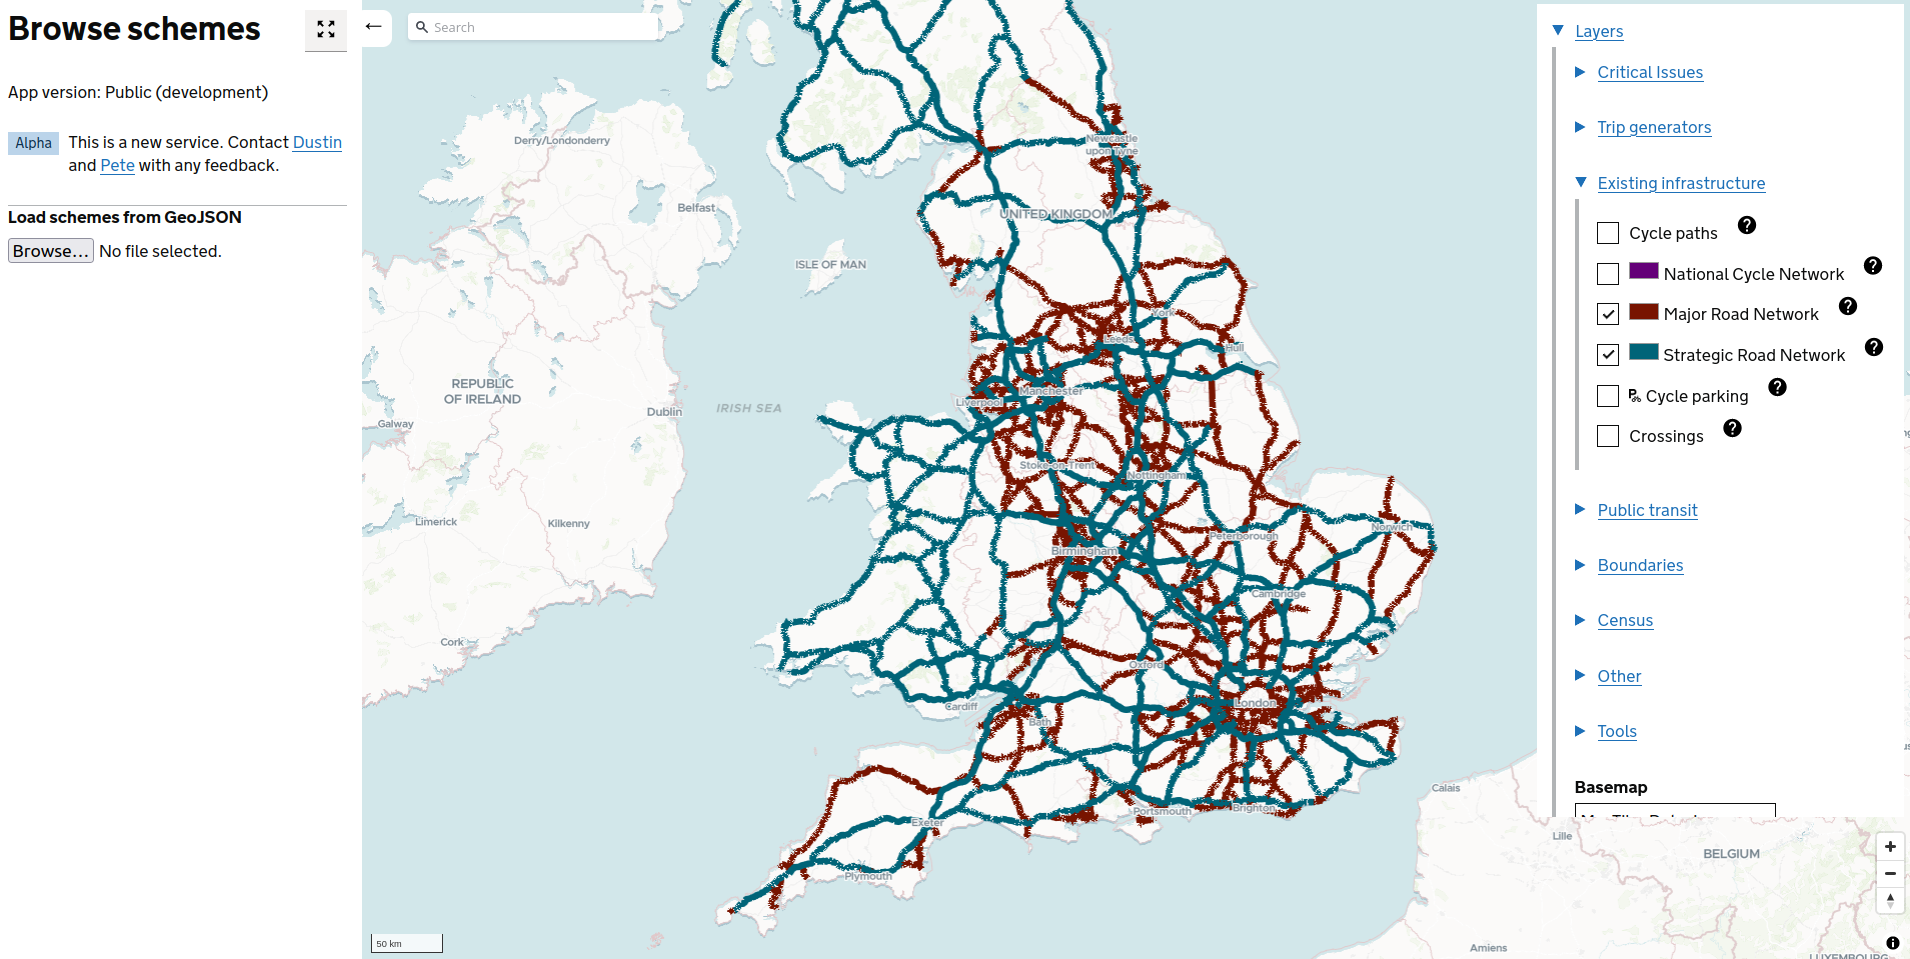
The Strategic Road Network (SRN) and Major Road Network (MRN) are illustrated below (source: browse tool of ATIP).
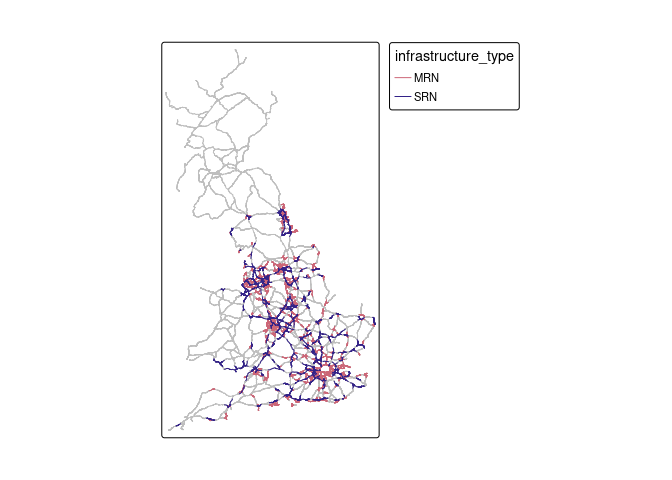
After downloading and combining the datasets, we can plot them as follows with R:
The main focus of the analysis presented in this report is the SRN, the road network controlled by National Highways (NH).
Data on active travel potential was taken from the Propensity to Cycle Tool (PCT), a Department for Transport funded project that builds on official data to model cycling potential nationwide. In future we would like to add data representing walking potential, possibly based on travel to school data.
As a first approximation of active travel potential we used Propensity to Cycle Tool (PCT) data. To ensure consistency across areas, we defined ‘cycling potential’ in this case as the distance that could be cycled within each grid cell, reducing the influence of variable road lengths on the results (10 100 m segments with cycling potential of 20 has the same impact as a single 5 km segment with cycling potential of 20 trips per day). Aggregating to 5 km resolution ensures the operations work fast for national data and remove noise from the results. Higher levels of spatial resolution could be used in future work.
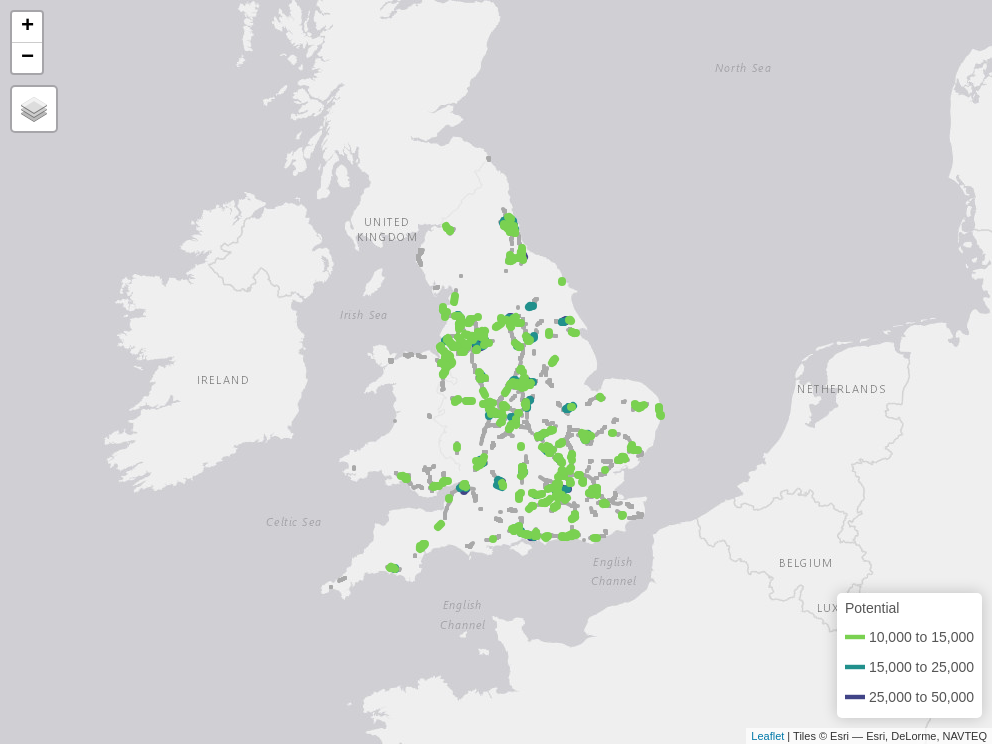
This approach allows identification of sections of the SRN and MRN in areas with high (more than 5000 km cycled within each 5km grid cell under the Go Dutch scenario) active travel potential nationwide, as illustrated below.
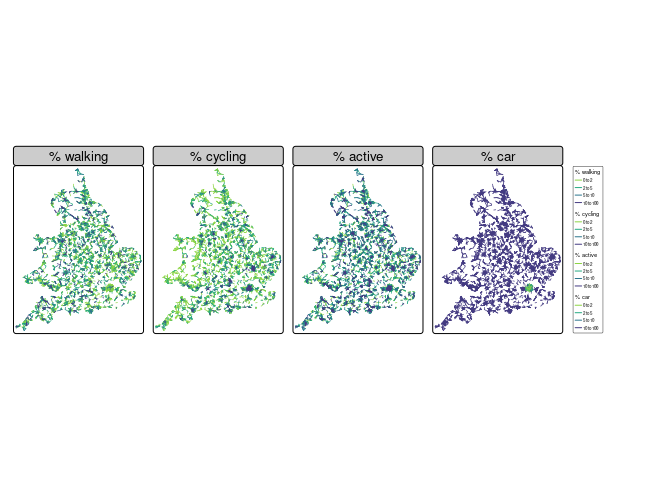
The approach also allows estimation of current and potential future levels of cycling for every road segment. The results of joining the current estimated and potential cycling values to road segments, taking the mean values of cell centroids that are within 5km of each road segment centroid, are shown below.
Note: the units of the values presented above are in estimated km cycling per day per 5 km grid cell, derived from the route network layer in the PCT, representing active travel potential for utility cycling in the vicinity of roads (estimated commuter cycling potential is a function of number of cyclable trips to work and is a good proxy for utility cycling potential and to a lesser extent leisure cycling potential). We assign more meaningful units of estimated number of potential trips in the next section.
After classifying the roads into named groups and keeping only road sections with a level of cycling potential above a certain threshold (2000 km cycled within each 5 km grid cell in the first instance), we filtered out the top n. (e.g. 500) road sections based on cycling potential. Roads were grouped in the following ways:
- by road classification number and name (if available)
- by active travel potential quantile (currently set to 20 quantiles although this can be varied to increase or decrease the number of groups and average length of road sections in each group)
In cases where the same road (e.g. M56) has multiple sections with high cycling potential, the sections are given an id, e.g. M56 1, M56 2 etc.
In total, 1317 road sections at least 1km in length (another parameter that can be adjusted) were identified with high cycling potential, with the top 500 shown in the interactive table below.
The interactive map can be viewed by downloading resulting file
and below:
The results presented in the previous section are based on estimates of active travel (commuter cycling) potential at the road network level in the vicinity (around 5 km) of each road segment. This approach is good for a ‘first pass’ national analysis but has limitations:
- There is no guarantee that the active travel on the segments in the vicinity of the roads need to interact with the roads, e.g. they could just run parallel to them.
- The approach leads to estimates of cycling potential in units that are not conducive to benefits estimation.
- The approach does not take into account the desire lines of cyclists, which may not follow the road network.
Using origin-destination data, which can be represented as ‘desire lines’ between origin and destination points or zones, can address these limitations.
The desire lines approach scales nationally although is more computationally intensive than the road network approach. There are 1,408,275 desire lines in the national dataset from the PCT (compared with 558,173 road segments). An overview of the desire lines, based on a sample of the top 10,000 desire lines longer than 5km by current active travel mode share, is shown below.
Because of the computational resources needed to process the national desire lines dataset, we’ll focus on case study areas in this section. The ~20k desire lines in the Manchester area are shown below.


