SDK for creating new strategies on Uniswap V3
git clone https://github.com/mellow-finance/mellow-strategy-sdk.git
cd mellow-strategy-sdk
python3 -m venv .venv
source .venv/bin/activate
pip install poetry
poetry install
or
python3 -m venv .venv
source .venv/bin/activate
pip install mellow_strategy_sdkfrom mellow_sdk.primitives import Pool, Token, Fee
from mellow_sdk.data import RawDataUniV3
from mellow_sdk.strategies import UniV3Passive
from mellow_sdk.backtest import Backtest
from mellow_sdk.viewers import RebalanceViewer, UniswapViewer, PortfolioViewer
from mellow_sdk.positions import BiCurrencyPosition, UniV3PositionA typical notebook would start with downloading and preparing data for a specific pool. Let's choose WBTC/WETH, fee 0.3% pool.
pool = Pool(Token.WBTC, Token.WETH, Fee.MIDDLE)Аt the first run you need to download the data
data = RawDataUniV3(pool, 'data', reload_data=False).load_from_folder()univ3_passive = UniV3Passive(
lower_price=data.swaps['price'].min() - 1,
upper_price=data.swaps['price'].max() + 1,
pool=pool,
gas_cost=0.,
name='passive'
)Next step is to run backtest using your strategy and data
bt = Backtest(univ3_passive)
portfolio_history, rebalance_history, uni_history = bt.backtest(data.swaps)Next visualize results
rv = RebalanceViewer(rebalance_history)
uv = UniswapViewer(uni_history)
pv = PortfolioViewer(portfolio_history, pool)

# Draw portfolio stats, like value, fees earned, apy
fig1, fig2, fig3, fig4, fig5, fig6 = pv.draw_portfolio()

# Draw Uniswap intervals
intervals_plot = uv.draw_intervals(data.swaps)

# Draw rebalances
rebalances_plot = rv.draw_rebalances(data.swaps)

# Calculate df with portfolio stats
stats = portfolio_history.calculate_stats()intervals_plot.show()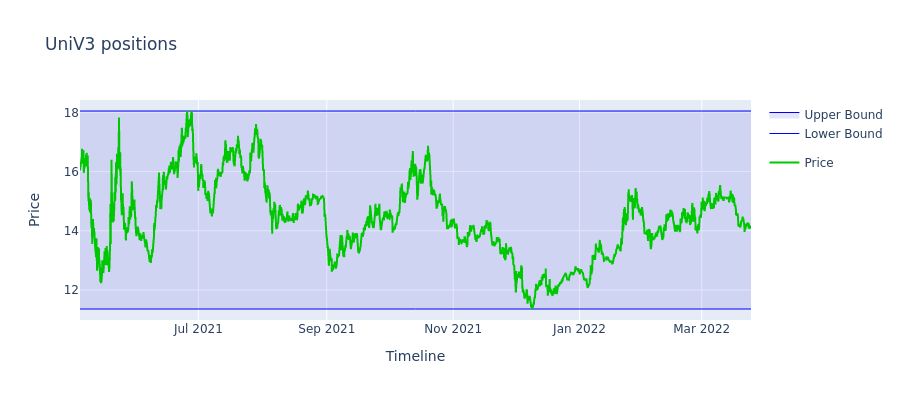
rebalances_plot.show()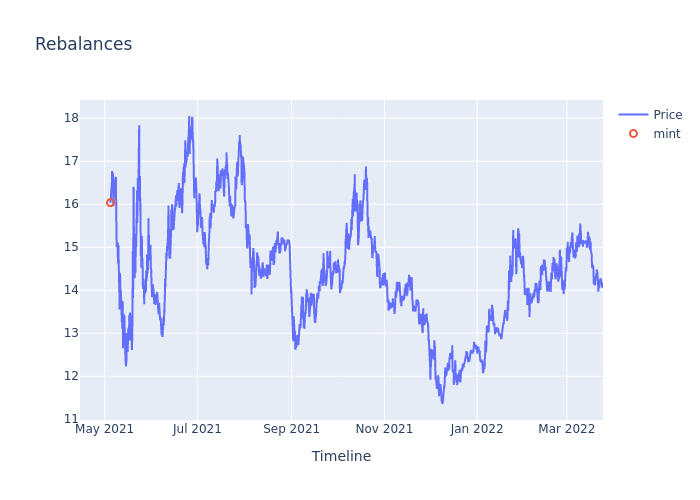
fig2.show()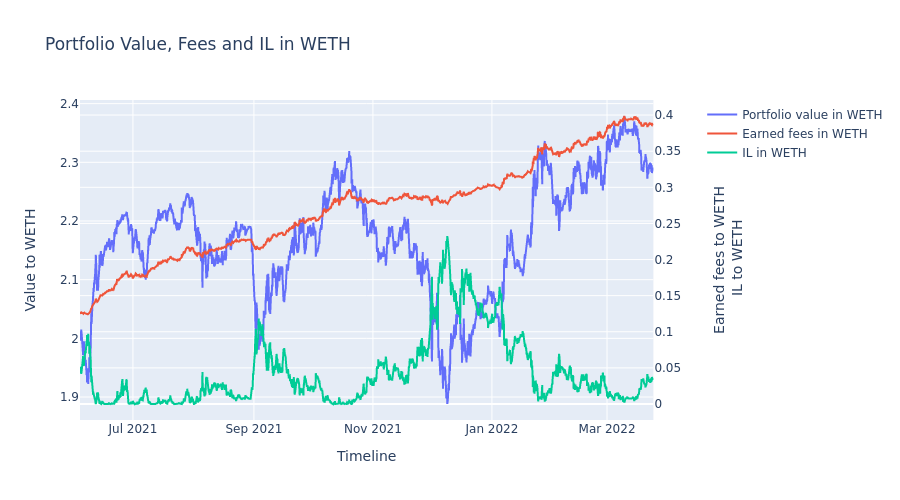
fig4.show()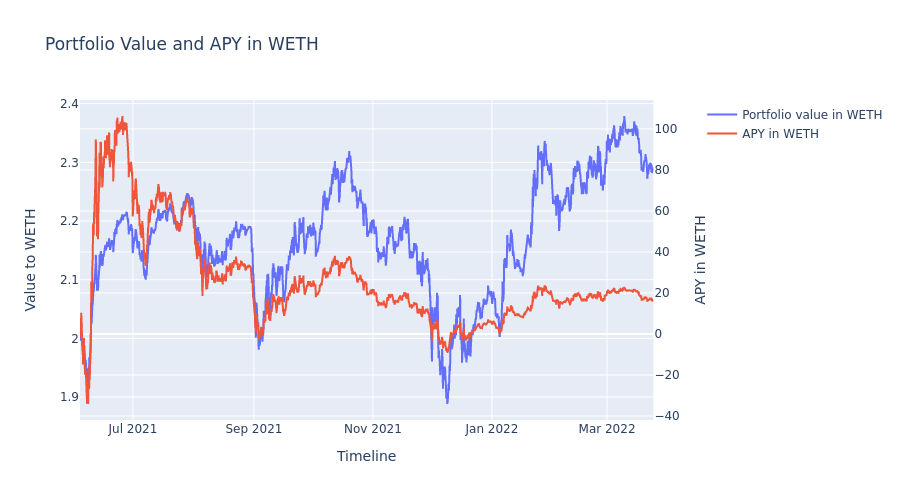
fig6.show()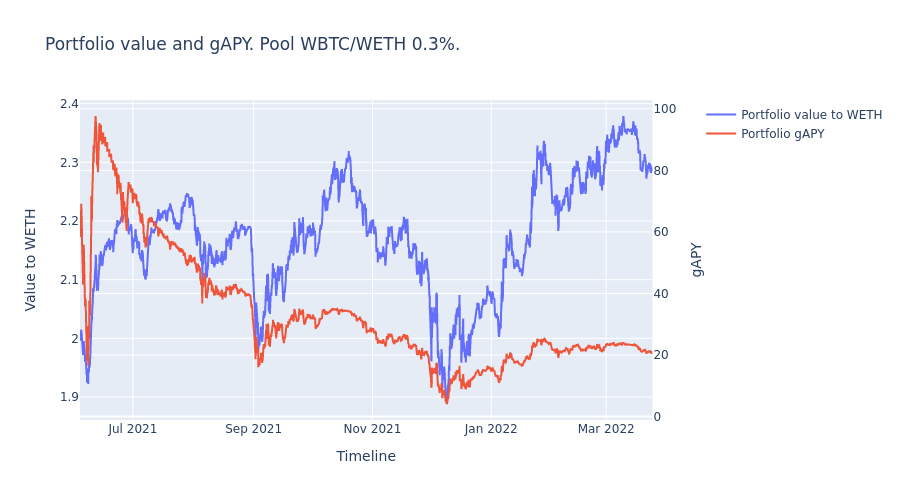
Congratulations! Now you have the results of your strategy backtest on the real UniV3 data!