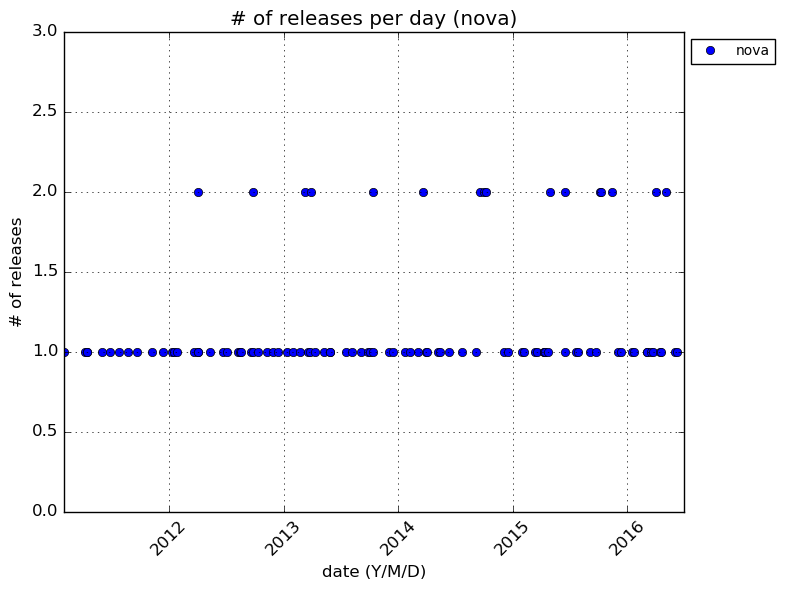
generates custom 'update vs. time' statistics from github projects. here we focus on the number of releases/commits over time.
e.g. to get the nr. of releases per day for the 'nova' repository, since Feb 1st 2011, run the following command:
$ python devops-stats.py --repo_dir ~/workbench/openstack/nova --start_date 2011,2,1 --out_dir ~/workbench/devops-stats/sandbox/graph/openstack
the resulting graph is then available as a .png file in ~/workbench/devops-stats/sandbox/graph/openstack/nova.mode-gen.png.
if you want the nr. of commits, simply add --commit to the previous command:
$ python devops-stats.py --commit --repo_dir ~/workbench/openstack/nova --start_date 2011,2,1 --out_dir ~/workbench/devops-stats/sandbox/graph/openstack
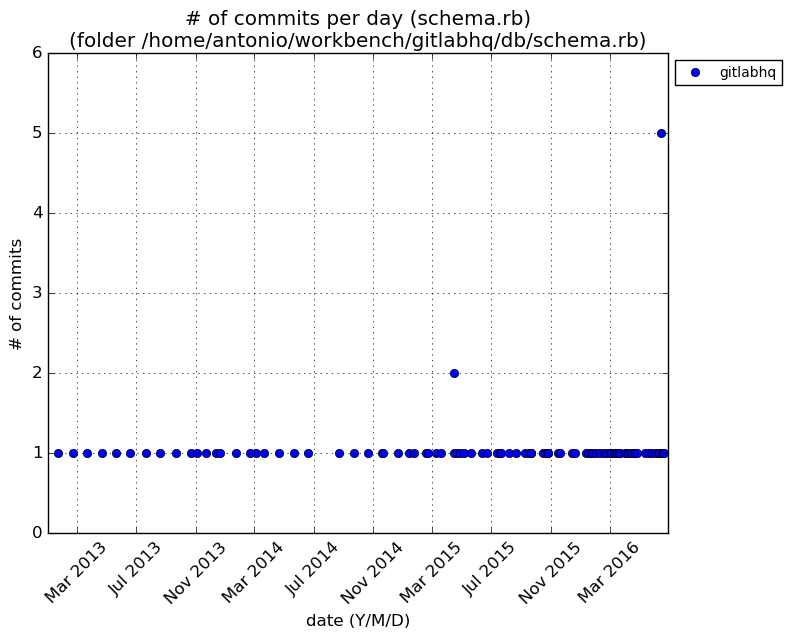
to look into the nr. of releases of a particular folder/file, use the option --folder as follows:
$ python devops-stats.py --folder --repo_dir ~/workbench/gitlabhq/db/schema.rb --start_date 2013,1,1 --out_dir ~/workbench/devops-stats/sandbox/graph/gitlab
the graph will show you the nr. of releases per day for the file gitlabhq/db/schema.rb in the
.png file at ~/workbench/devops-stats/sandbox/graph/gitlabhq/schema.rb.mode-folder.png.
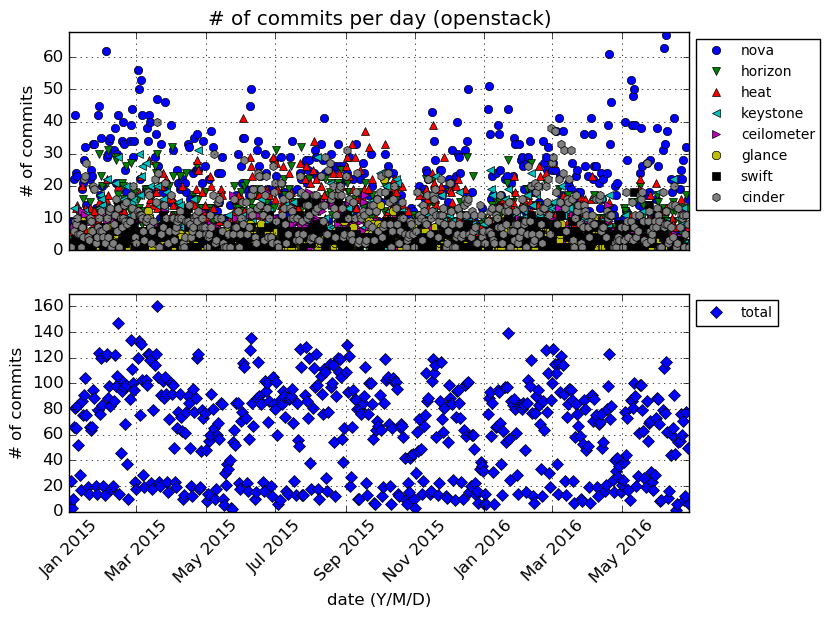
if you have a base directory with multiple repositories, you can use the --project option to generate a plot of the nr. of releases/commits per day as follows (here we show the number of commits):
$ python devops-stats.py --commit --project --repo_dir ~/workbench/openstack --out_dir ~/workbench/devops-stats/sandbox/graph/openstack
in this case, we have a base directory - -repo_dir ~/workbench/openstack - holding multiple OpenStack git repositories. by specifying the --project option, the script generates a graph with the nr. of commits (note the use of the --commit option) per day at ~/workbench/devops-stats/sandbox/graph/openstack/openstack.mode-project.png.
for further details, run $ python devops-stats.py -h.