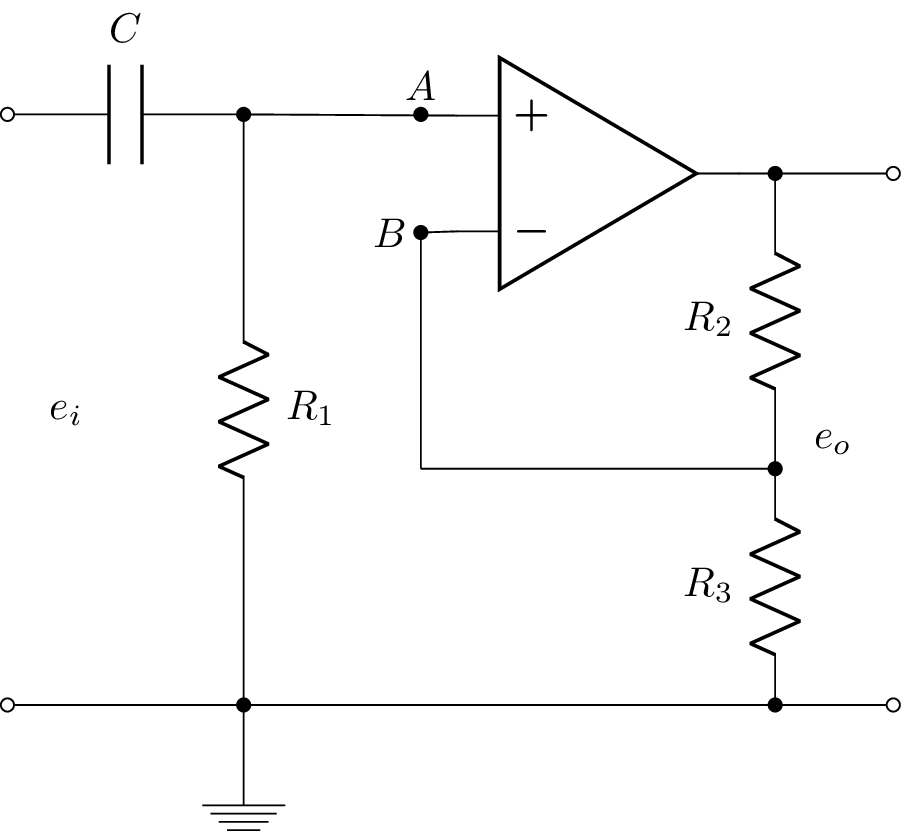
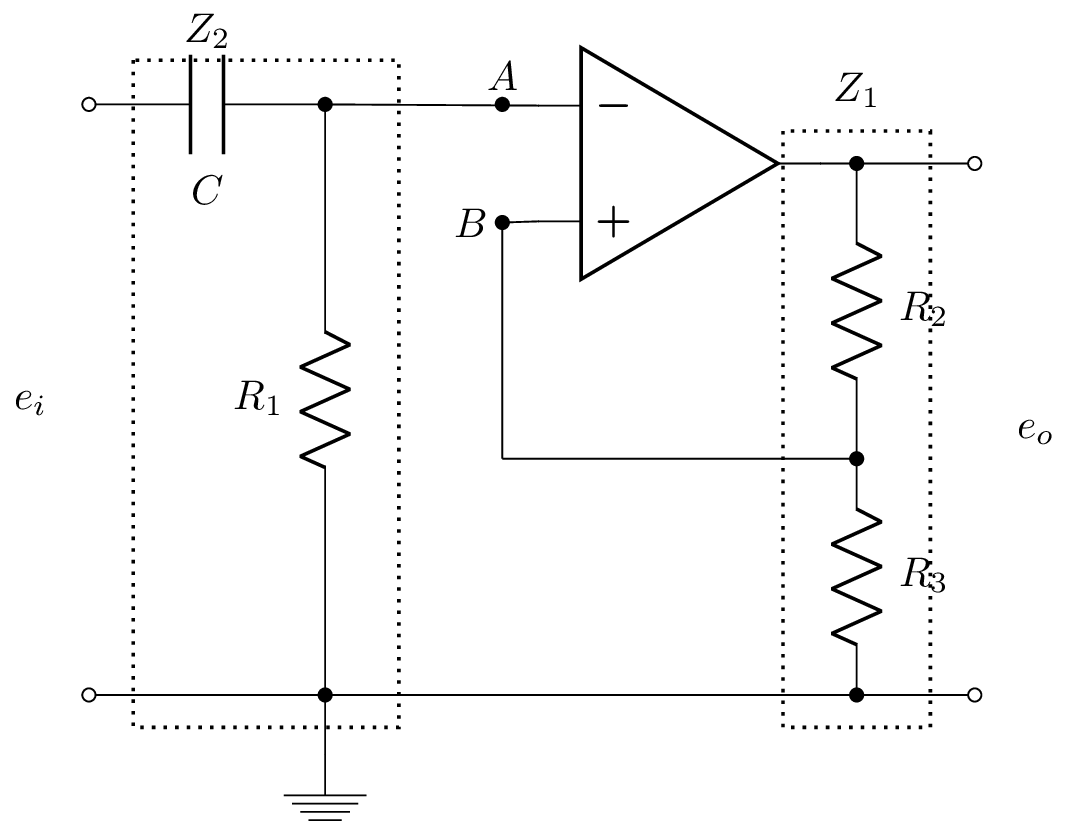
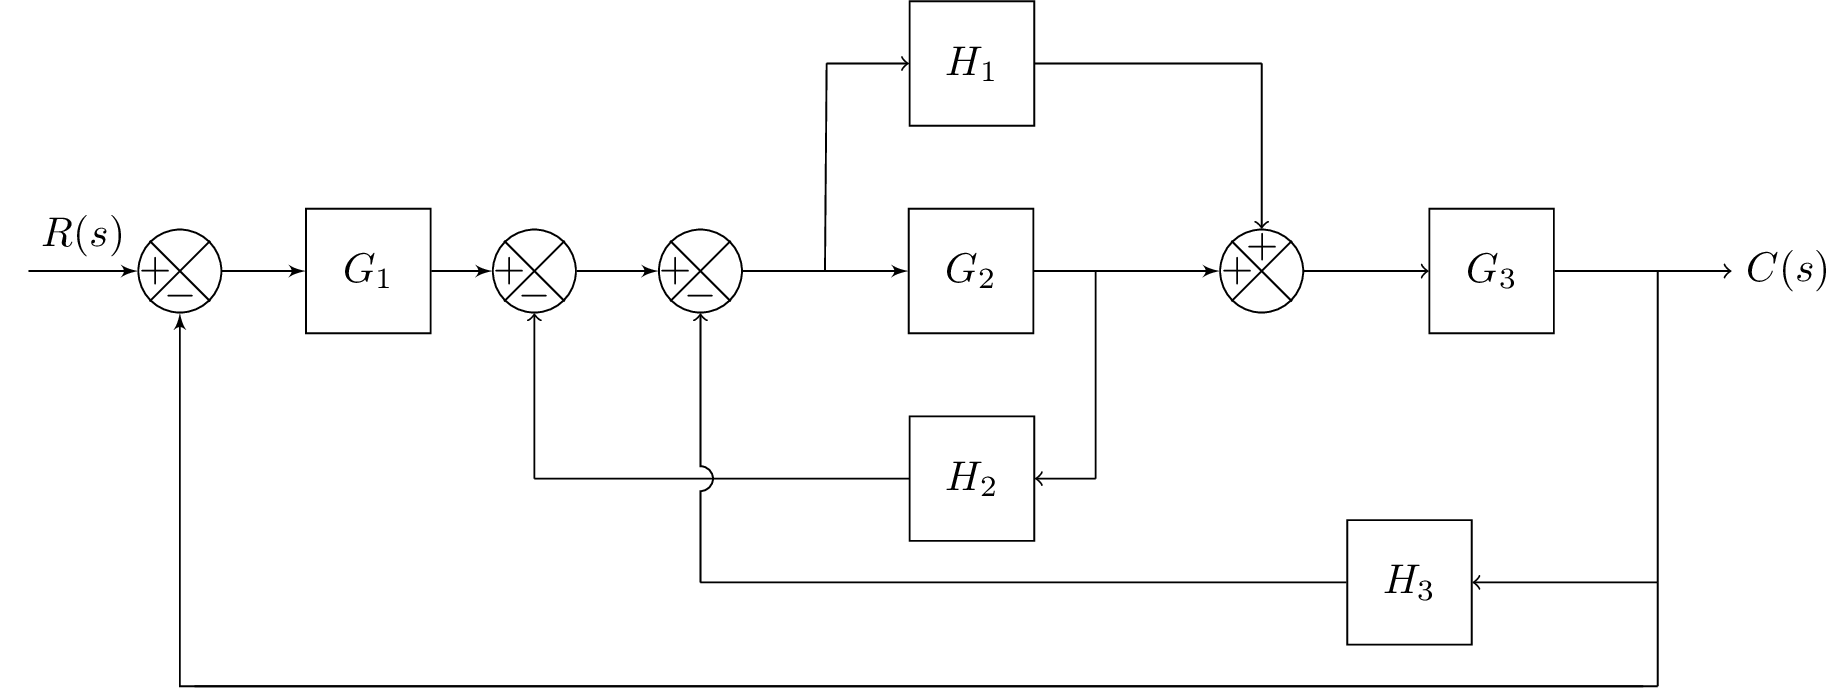
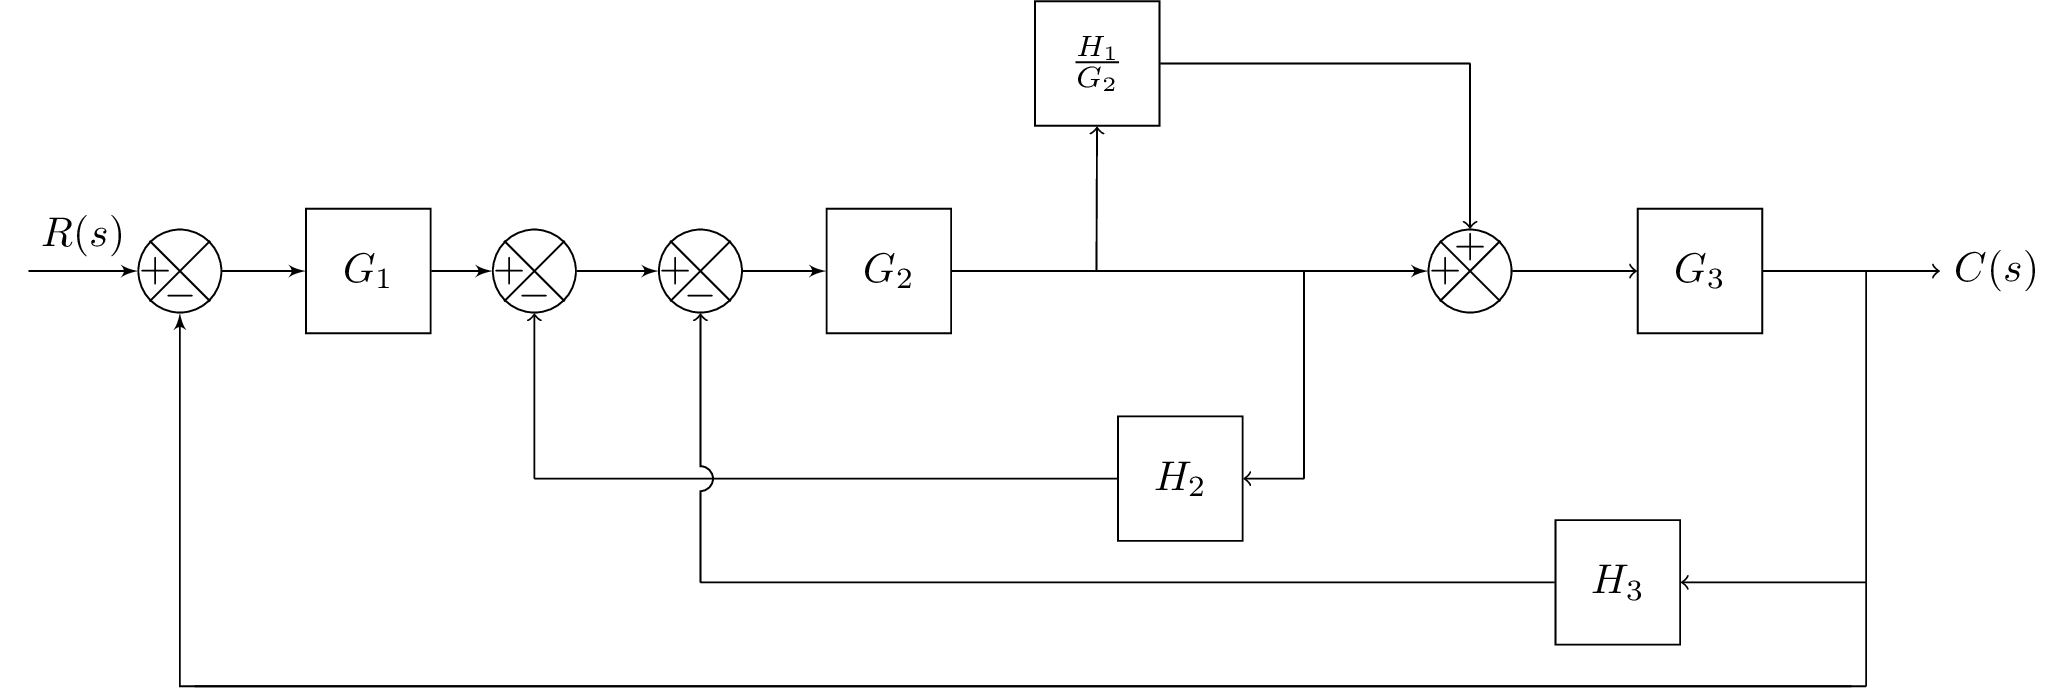
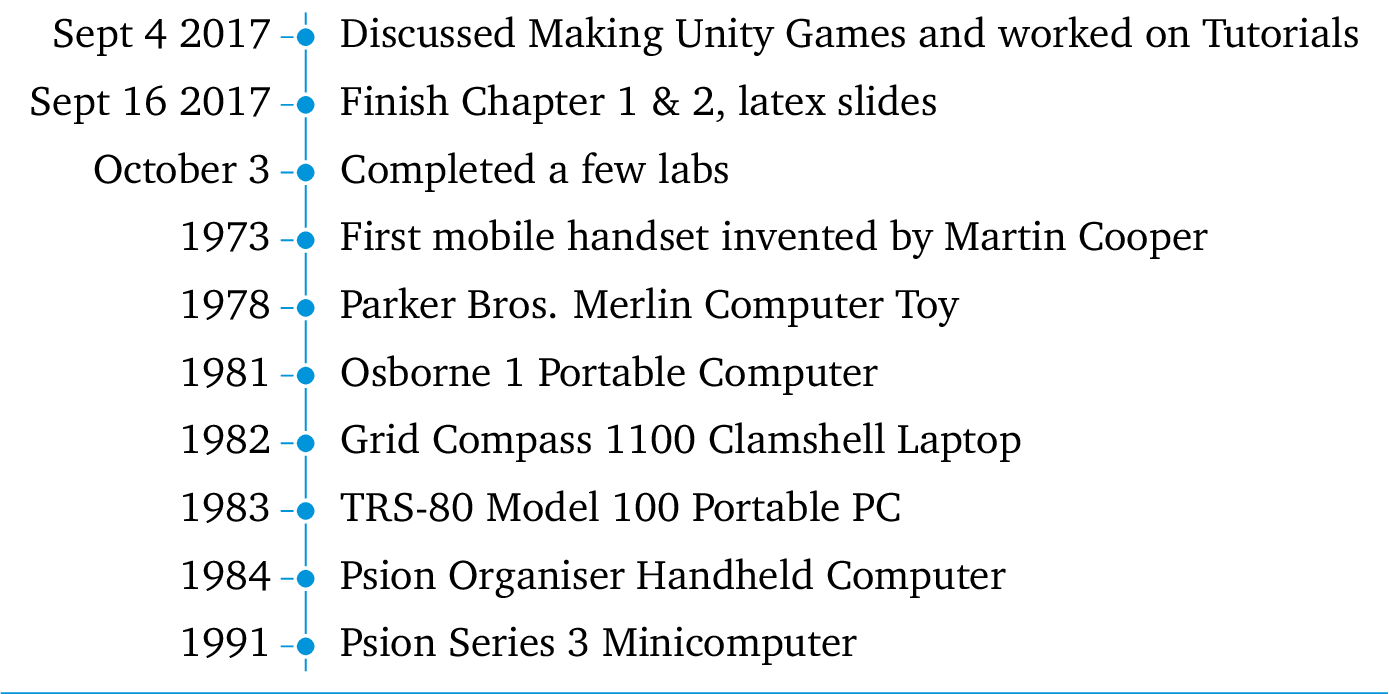
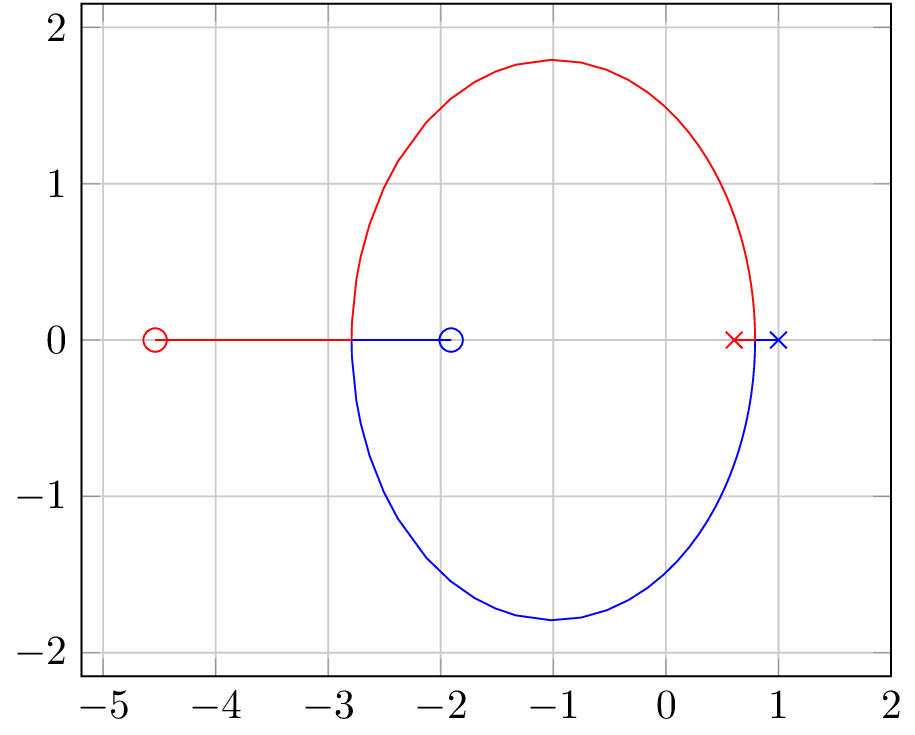
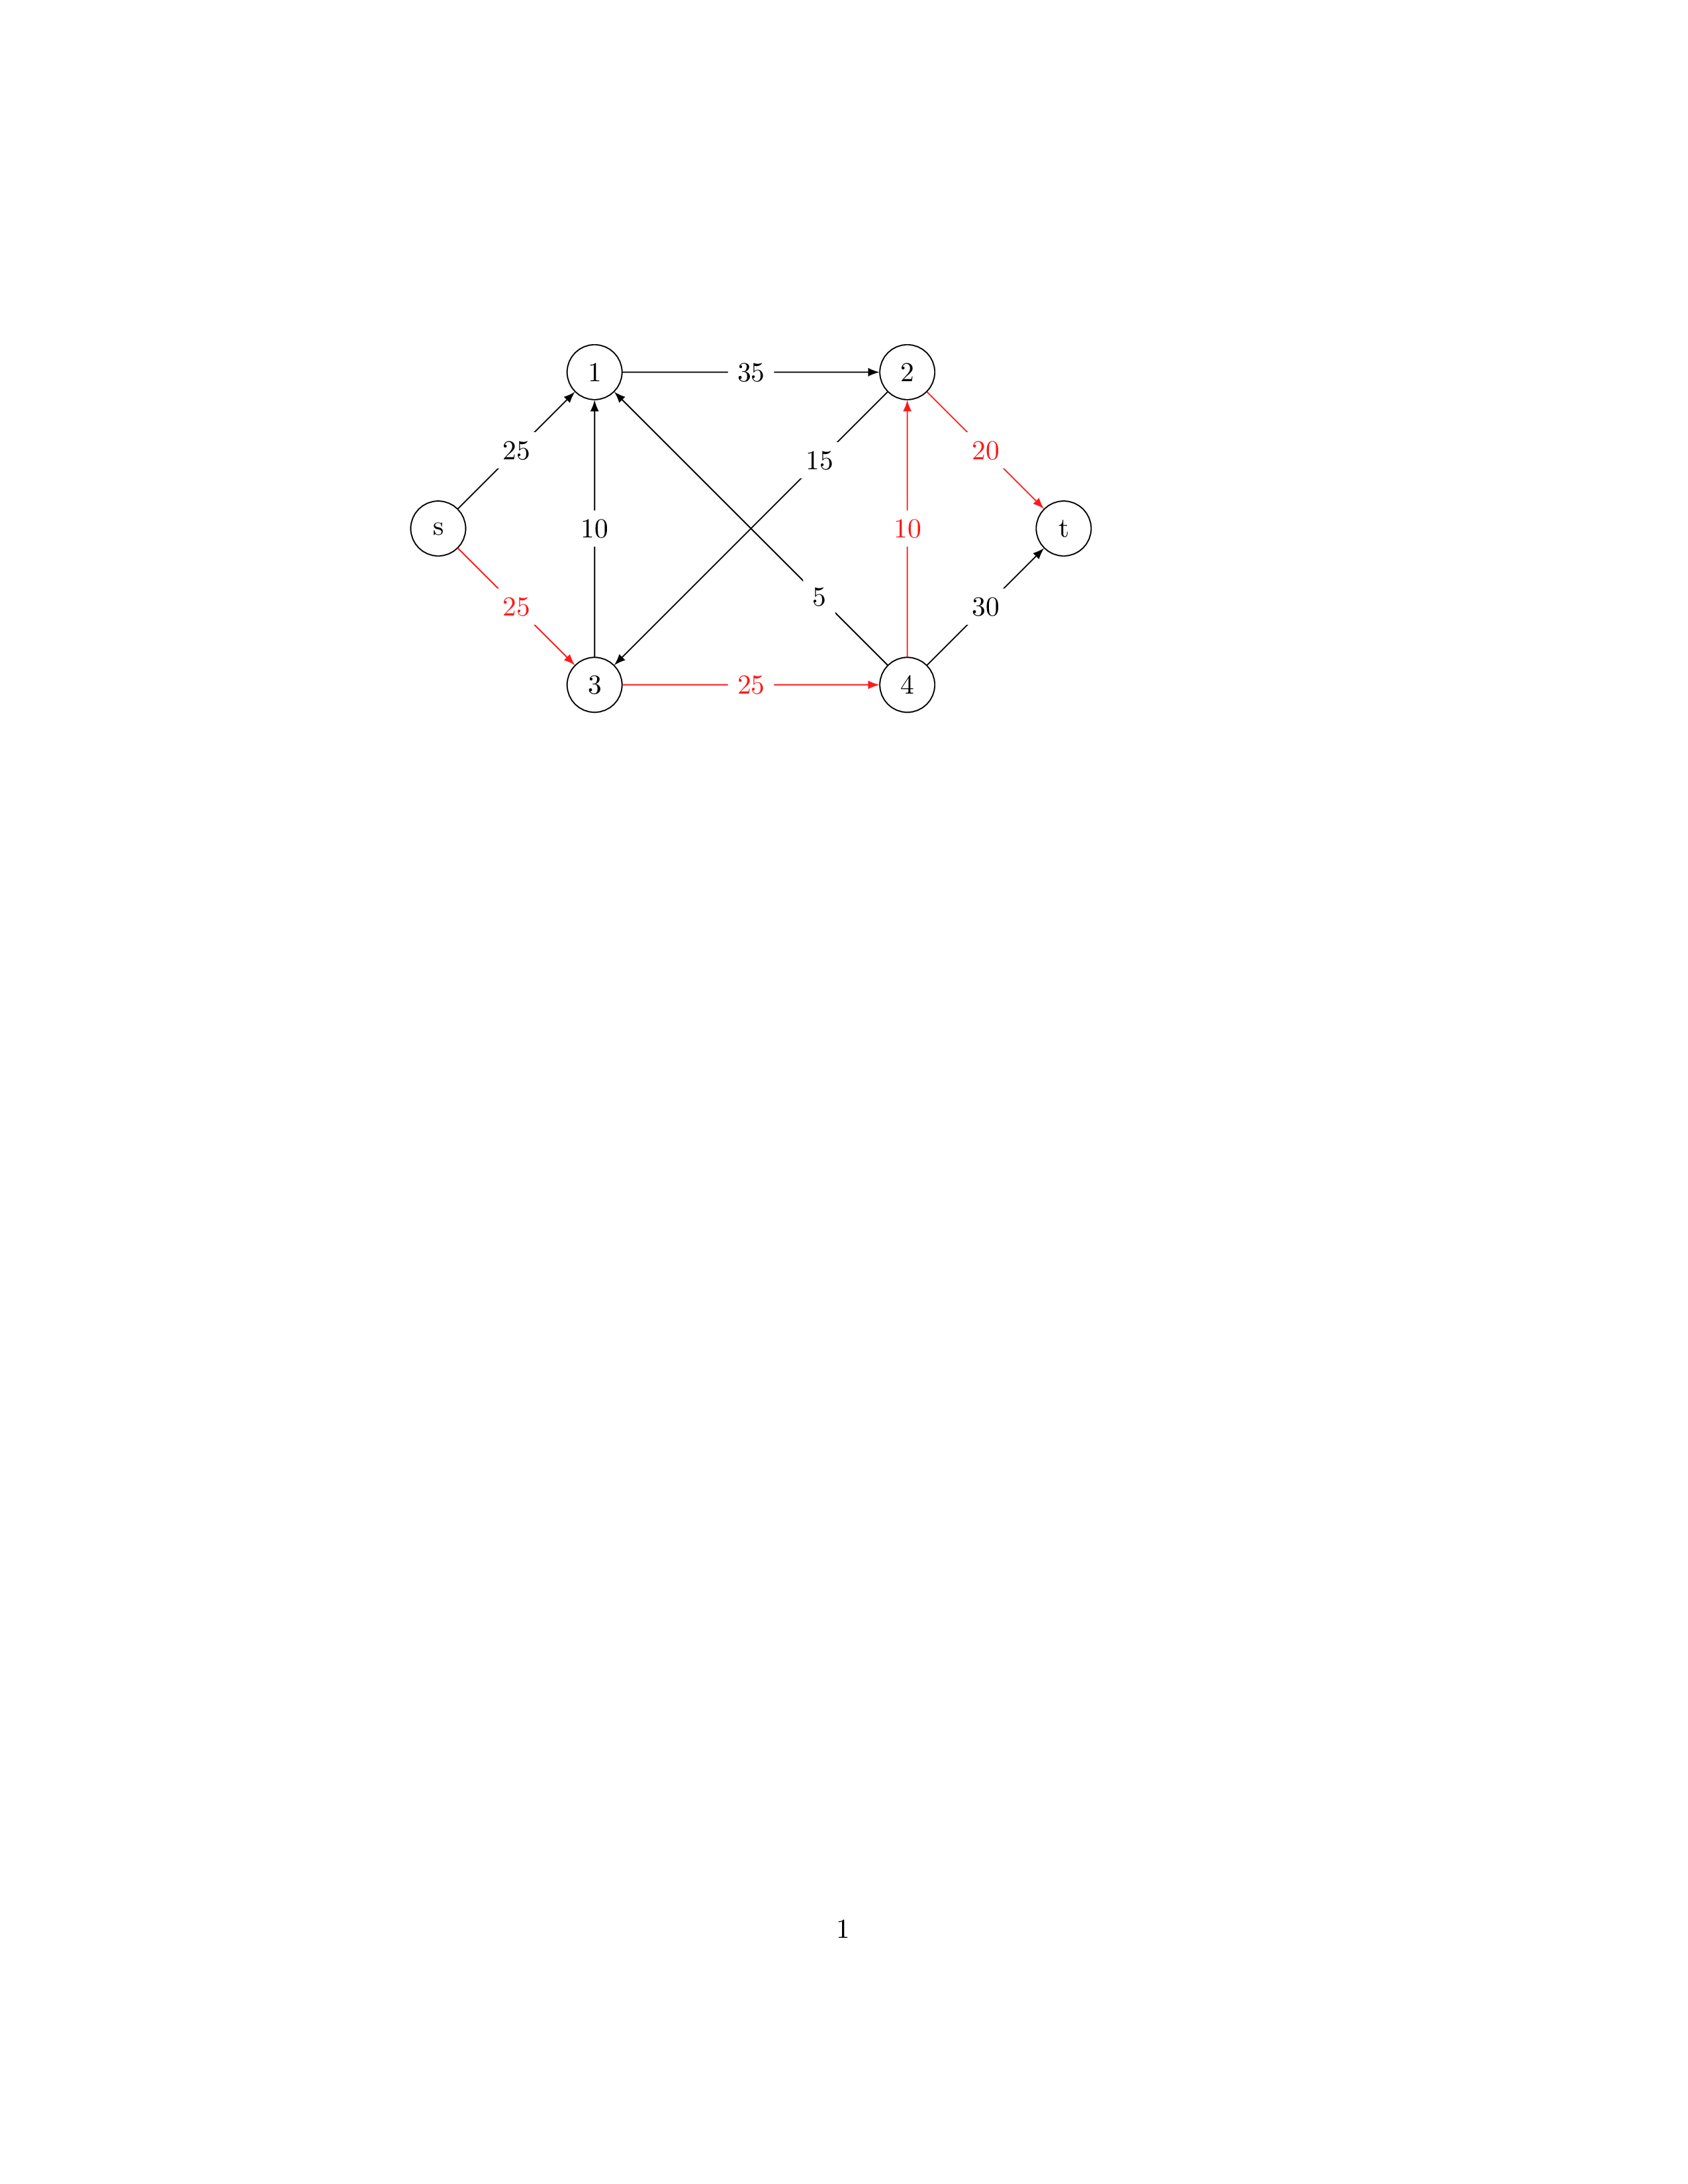
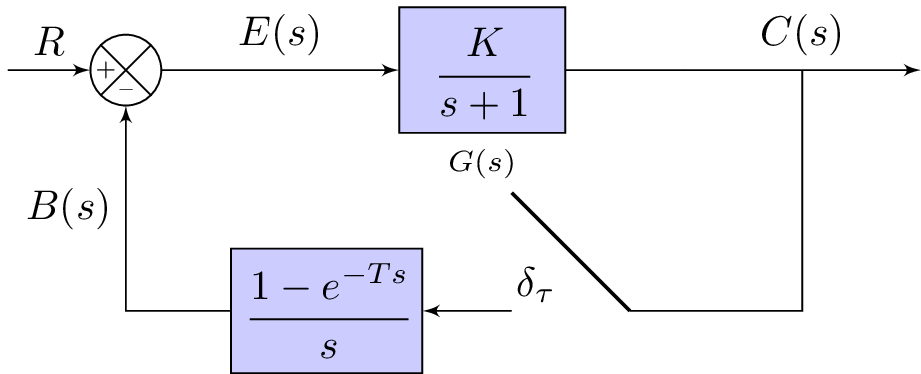
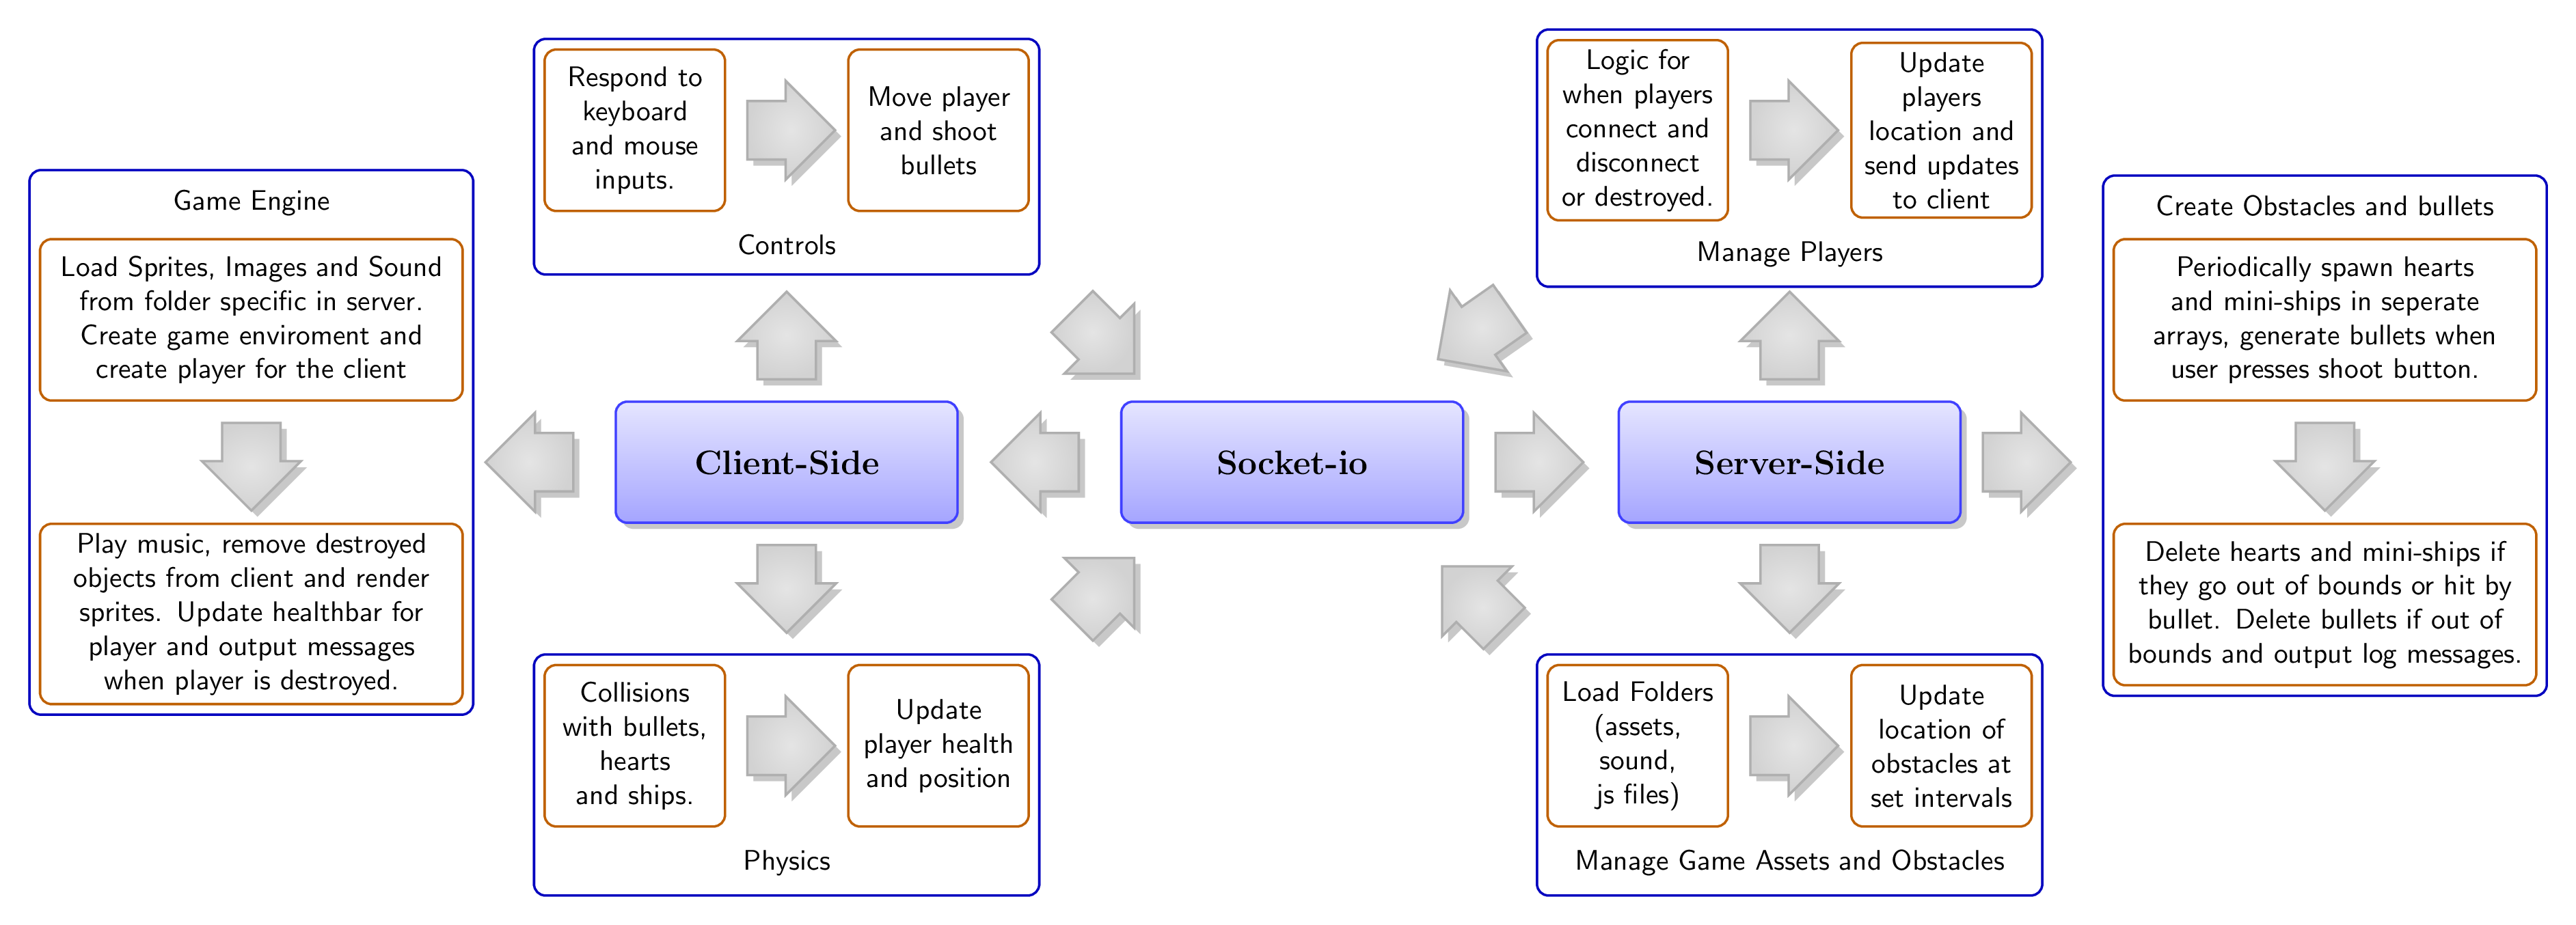
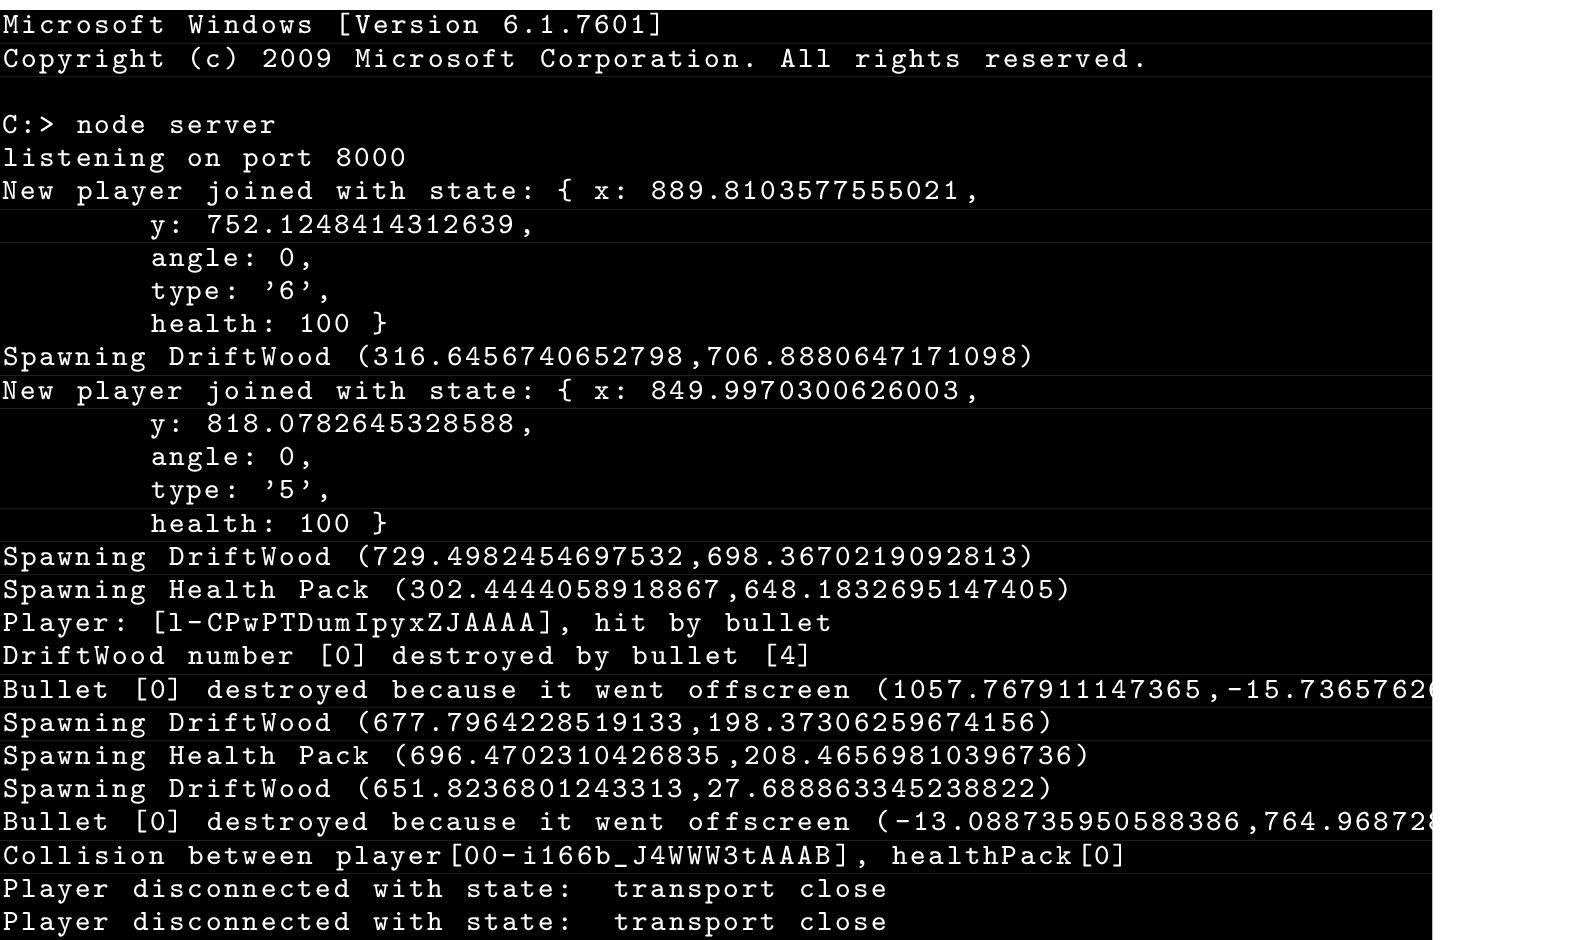
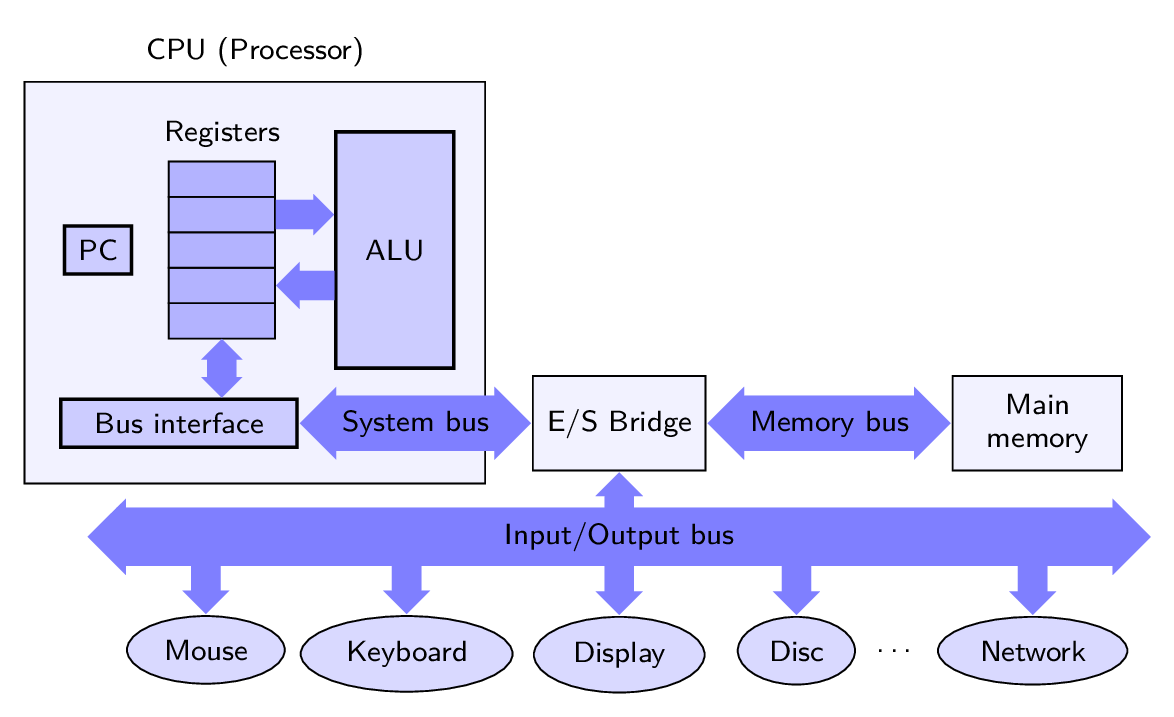
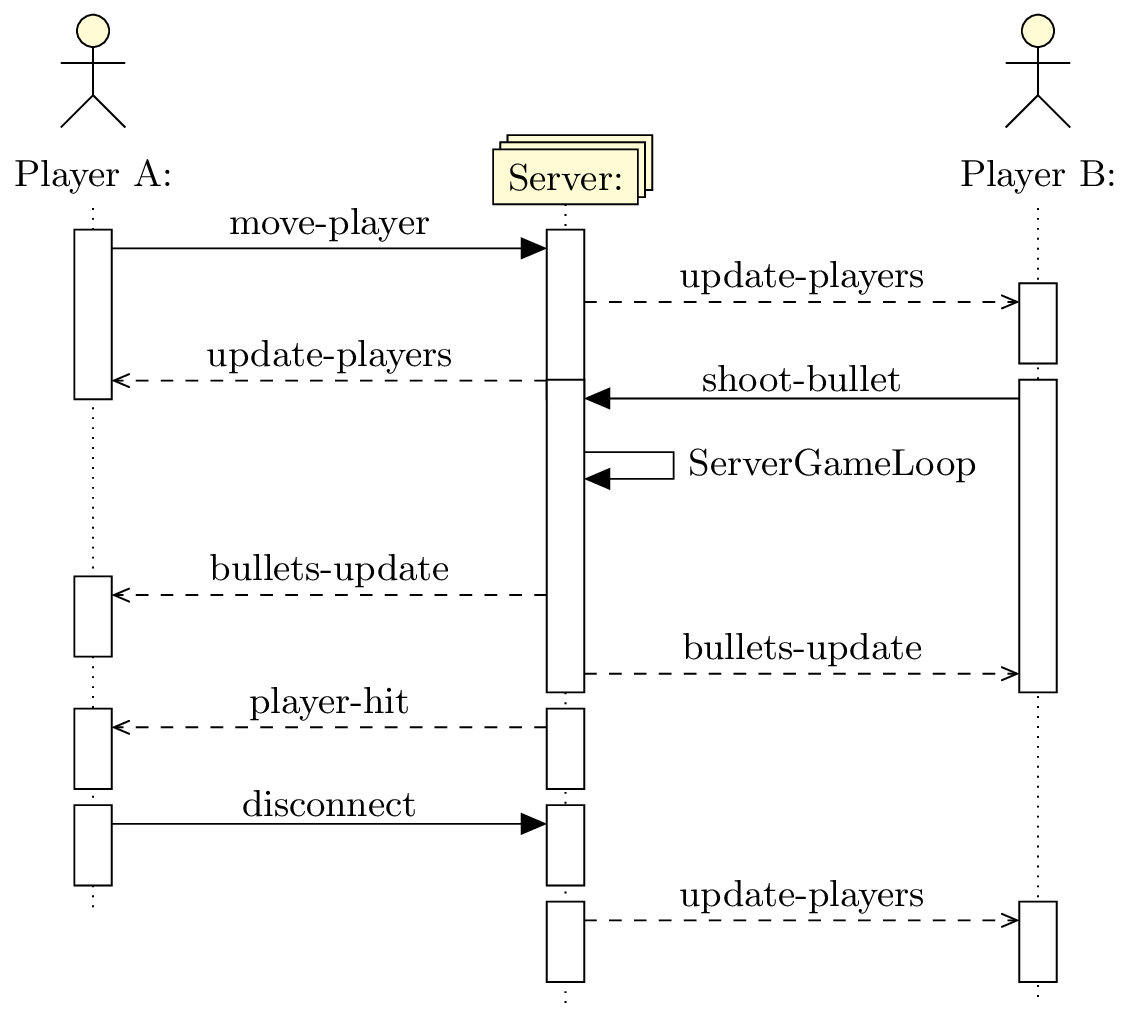
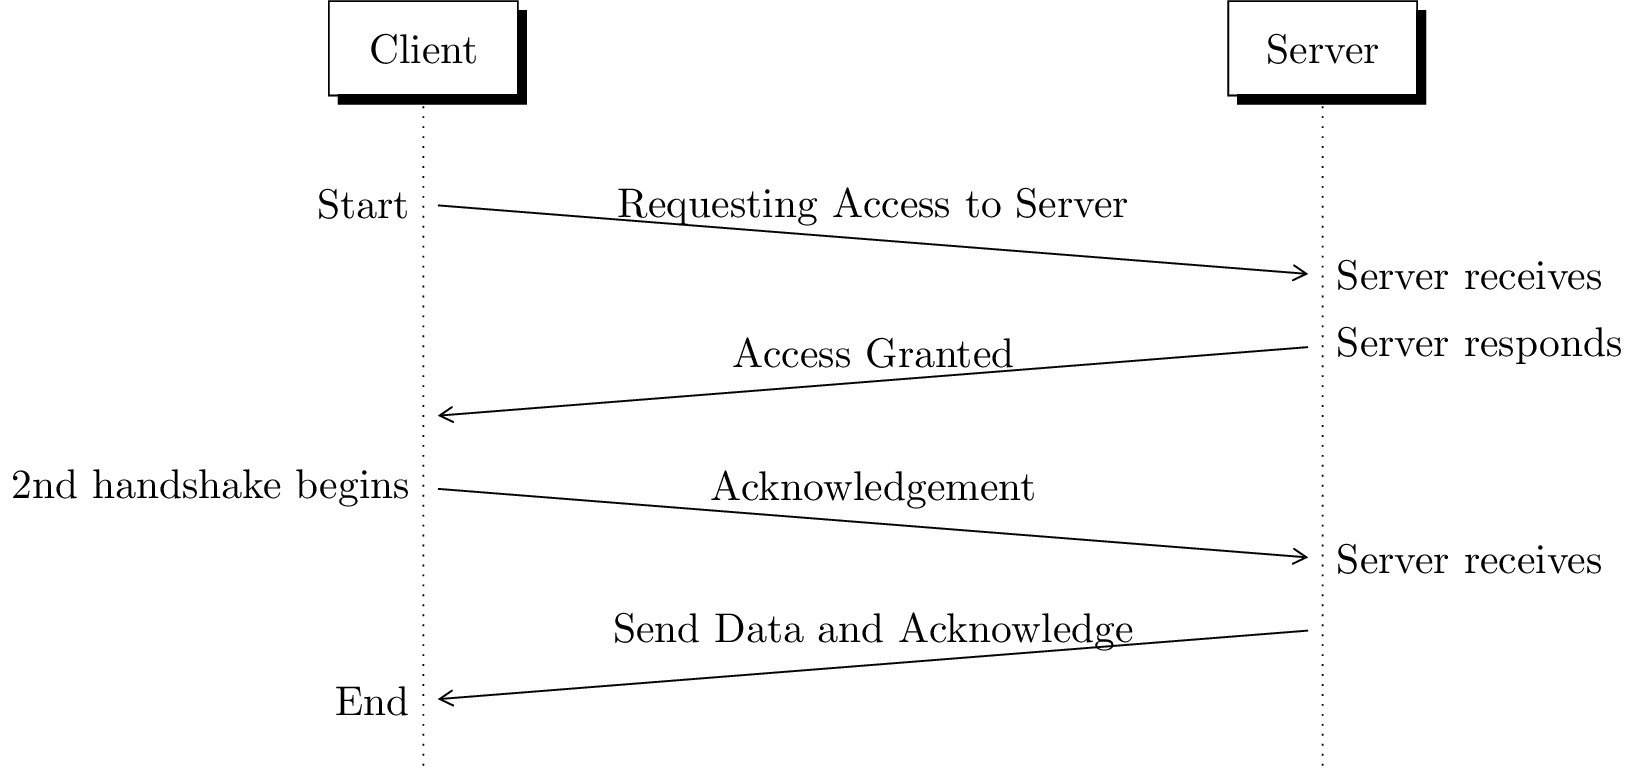
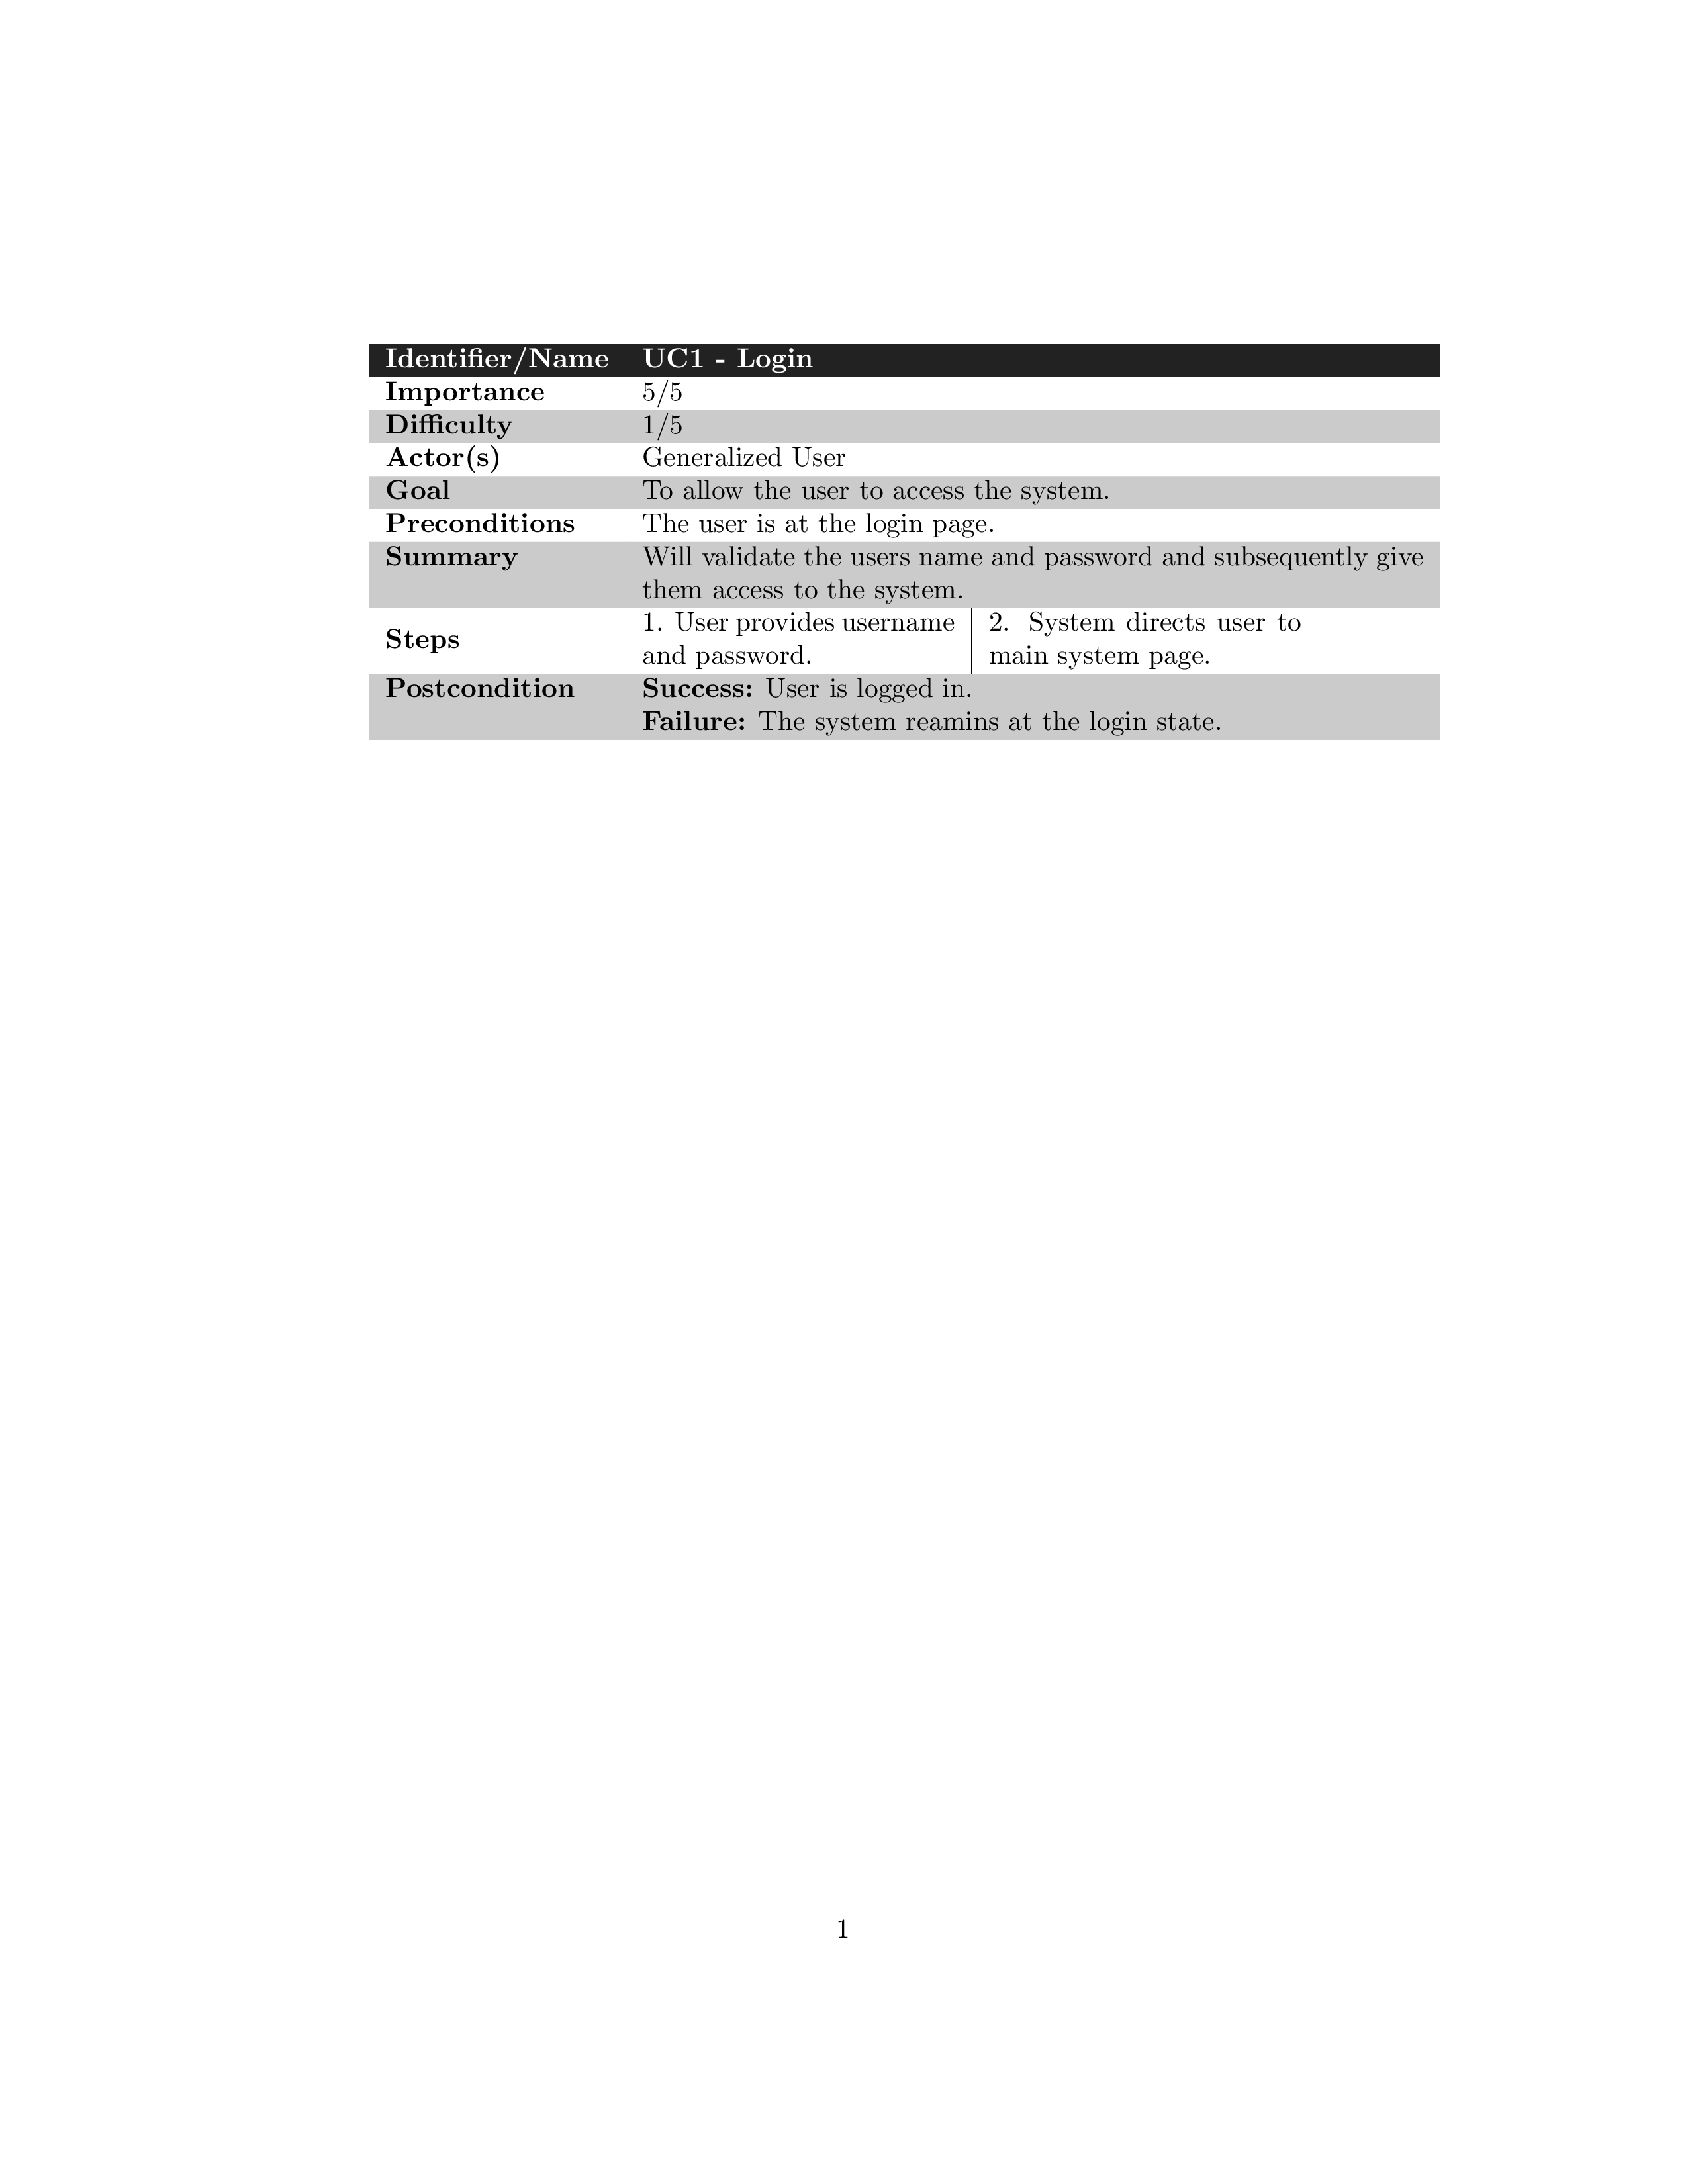
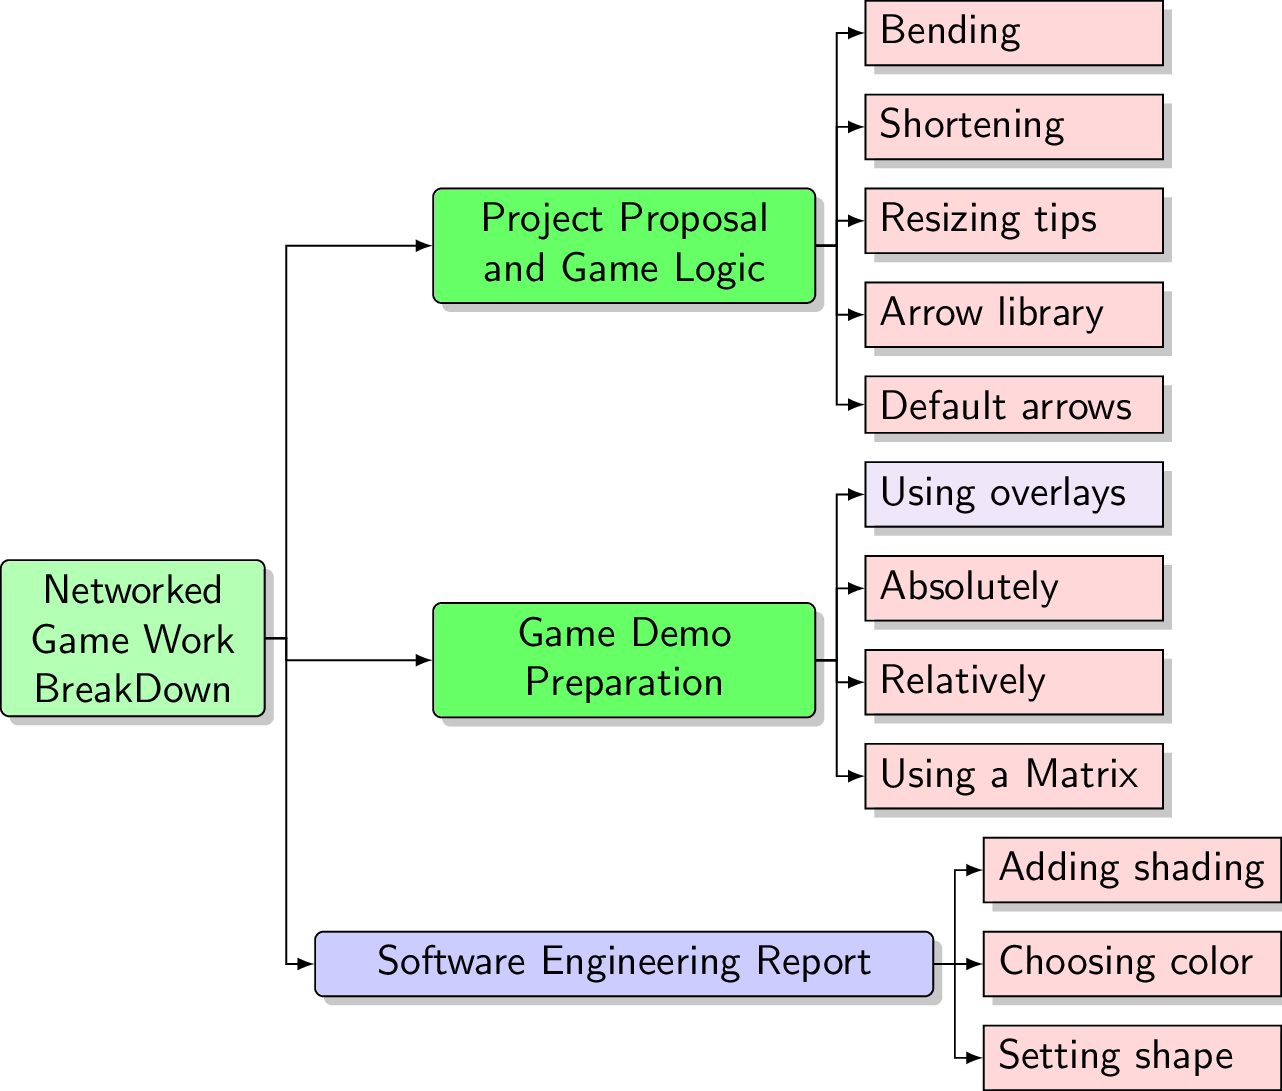
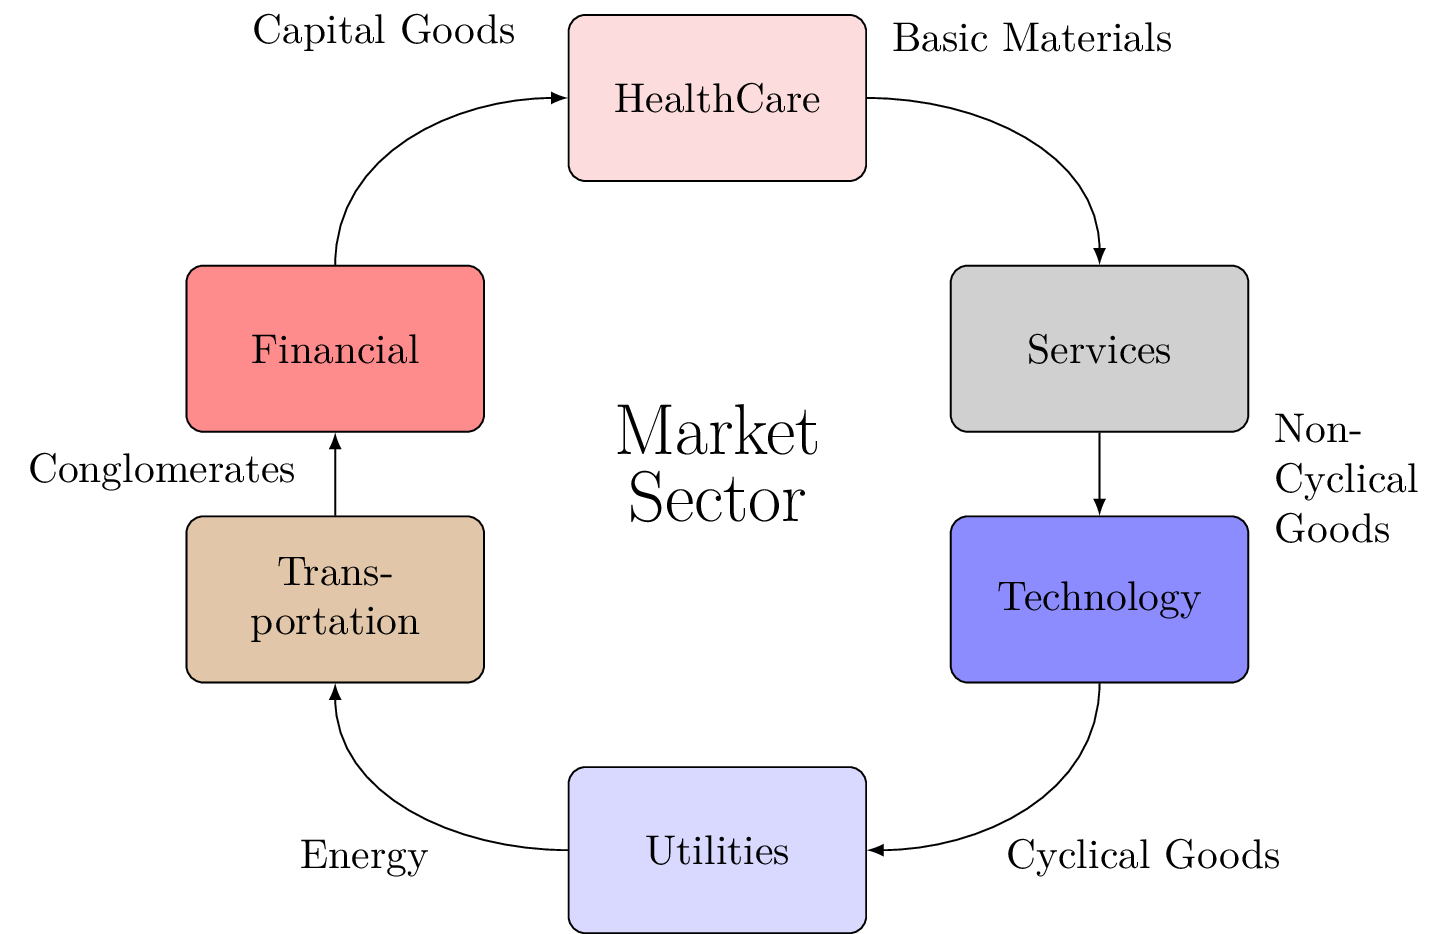
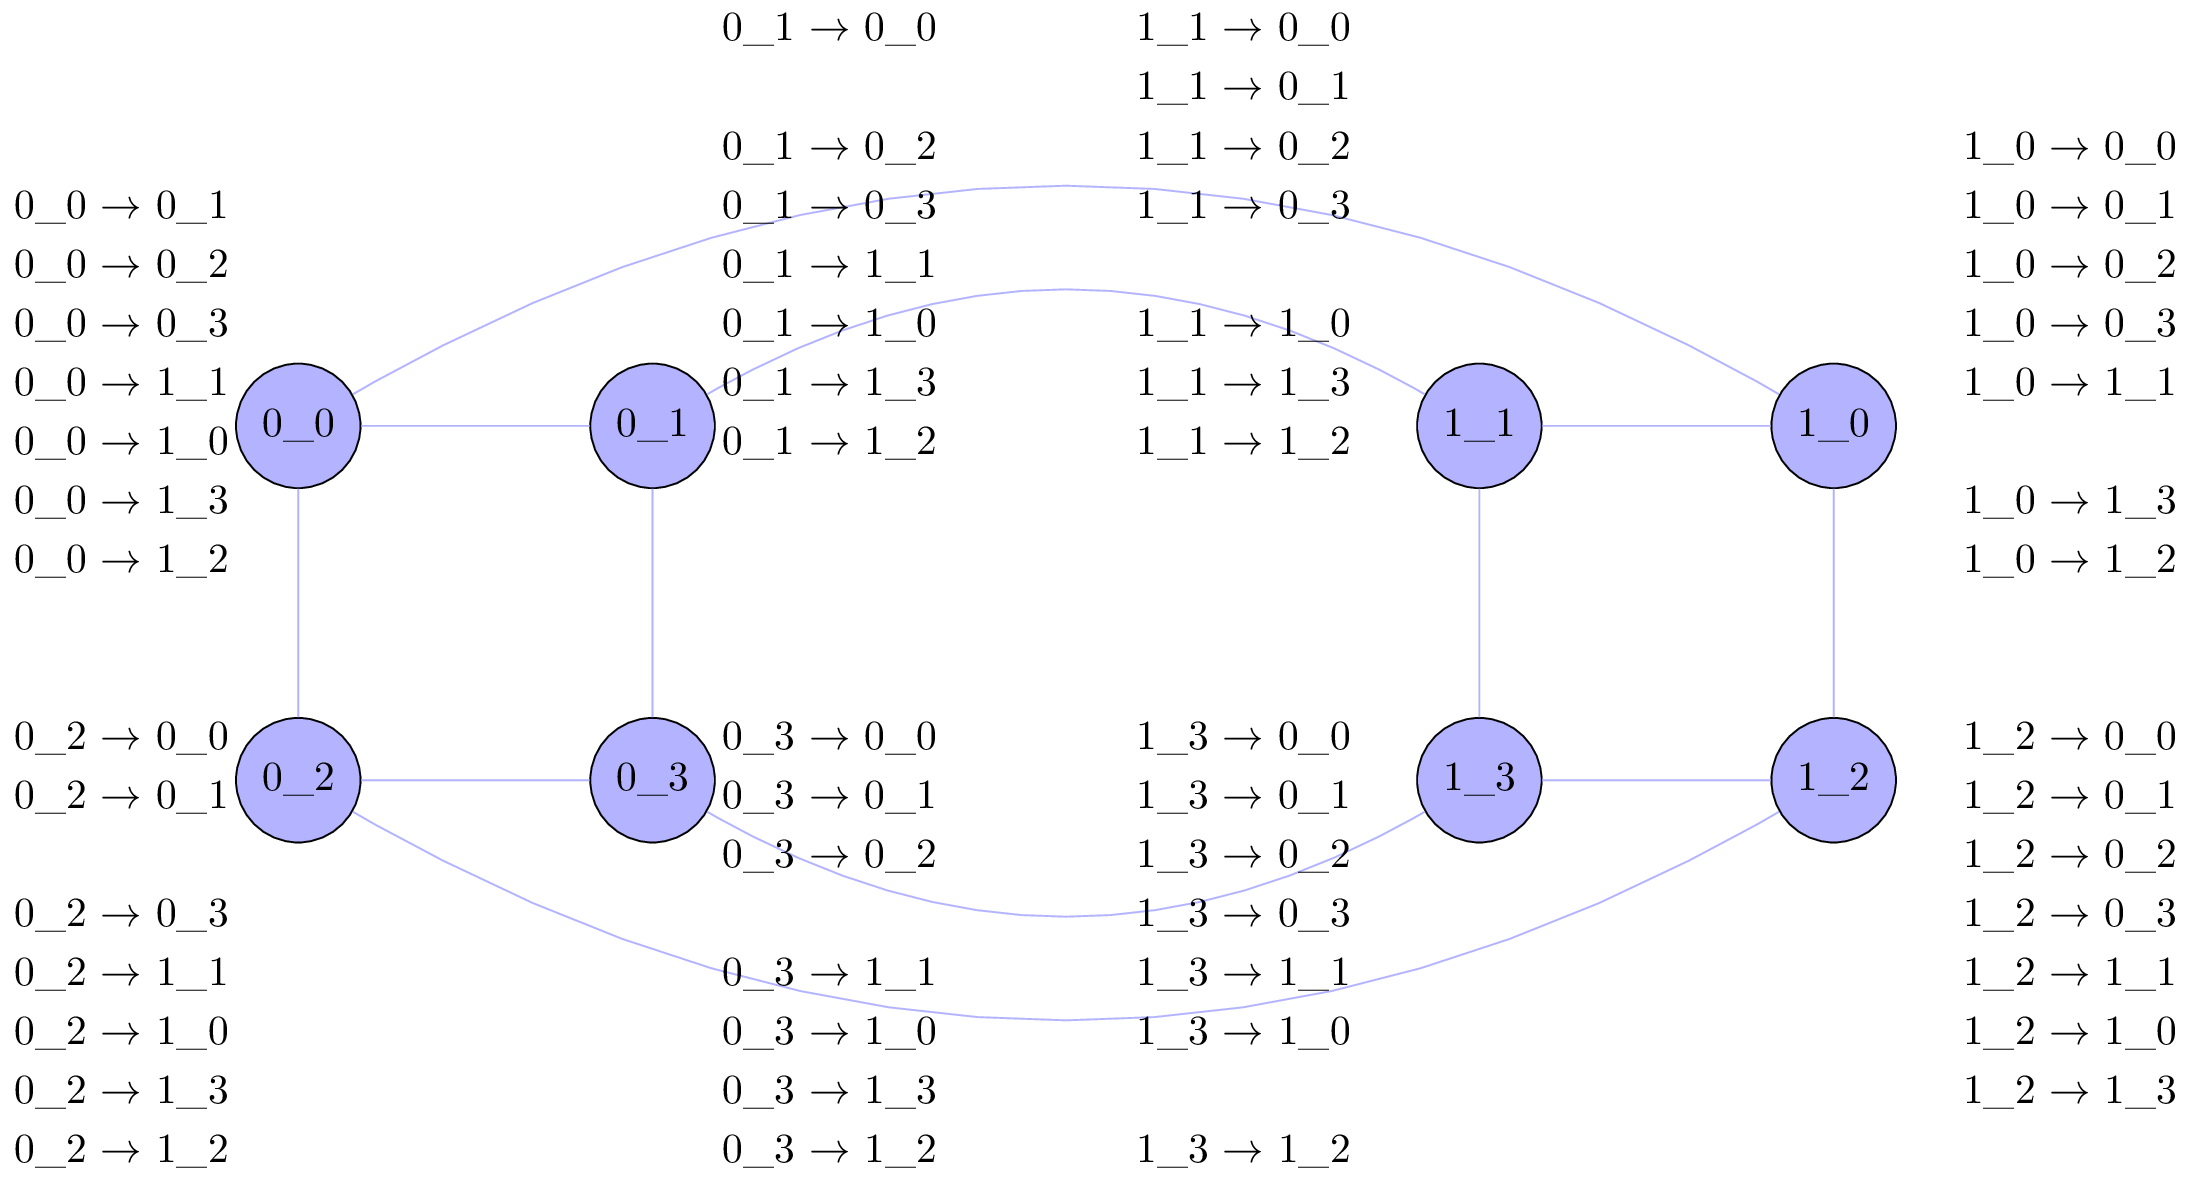
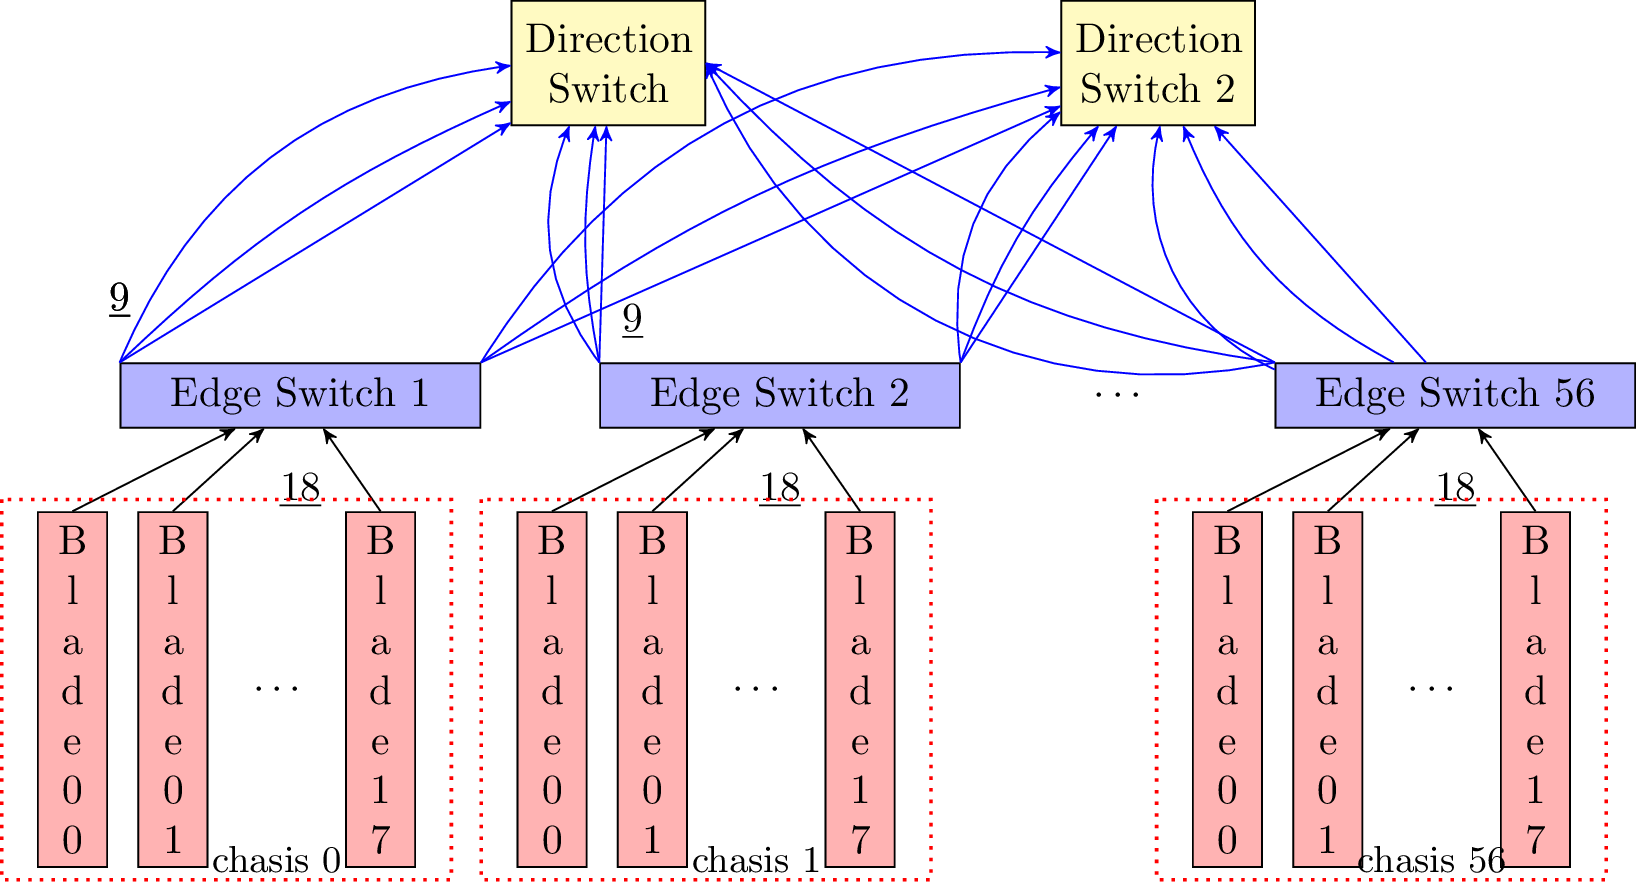
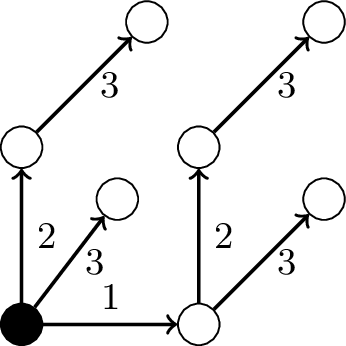
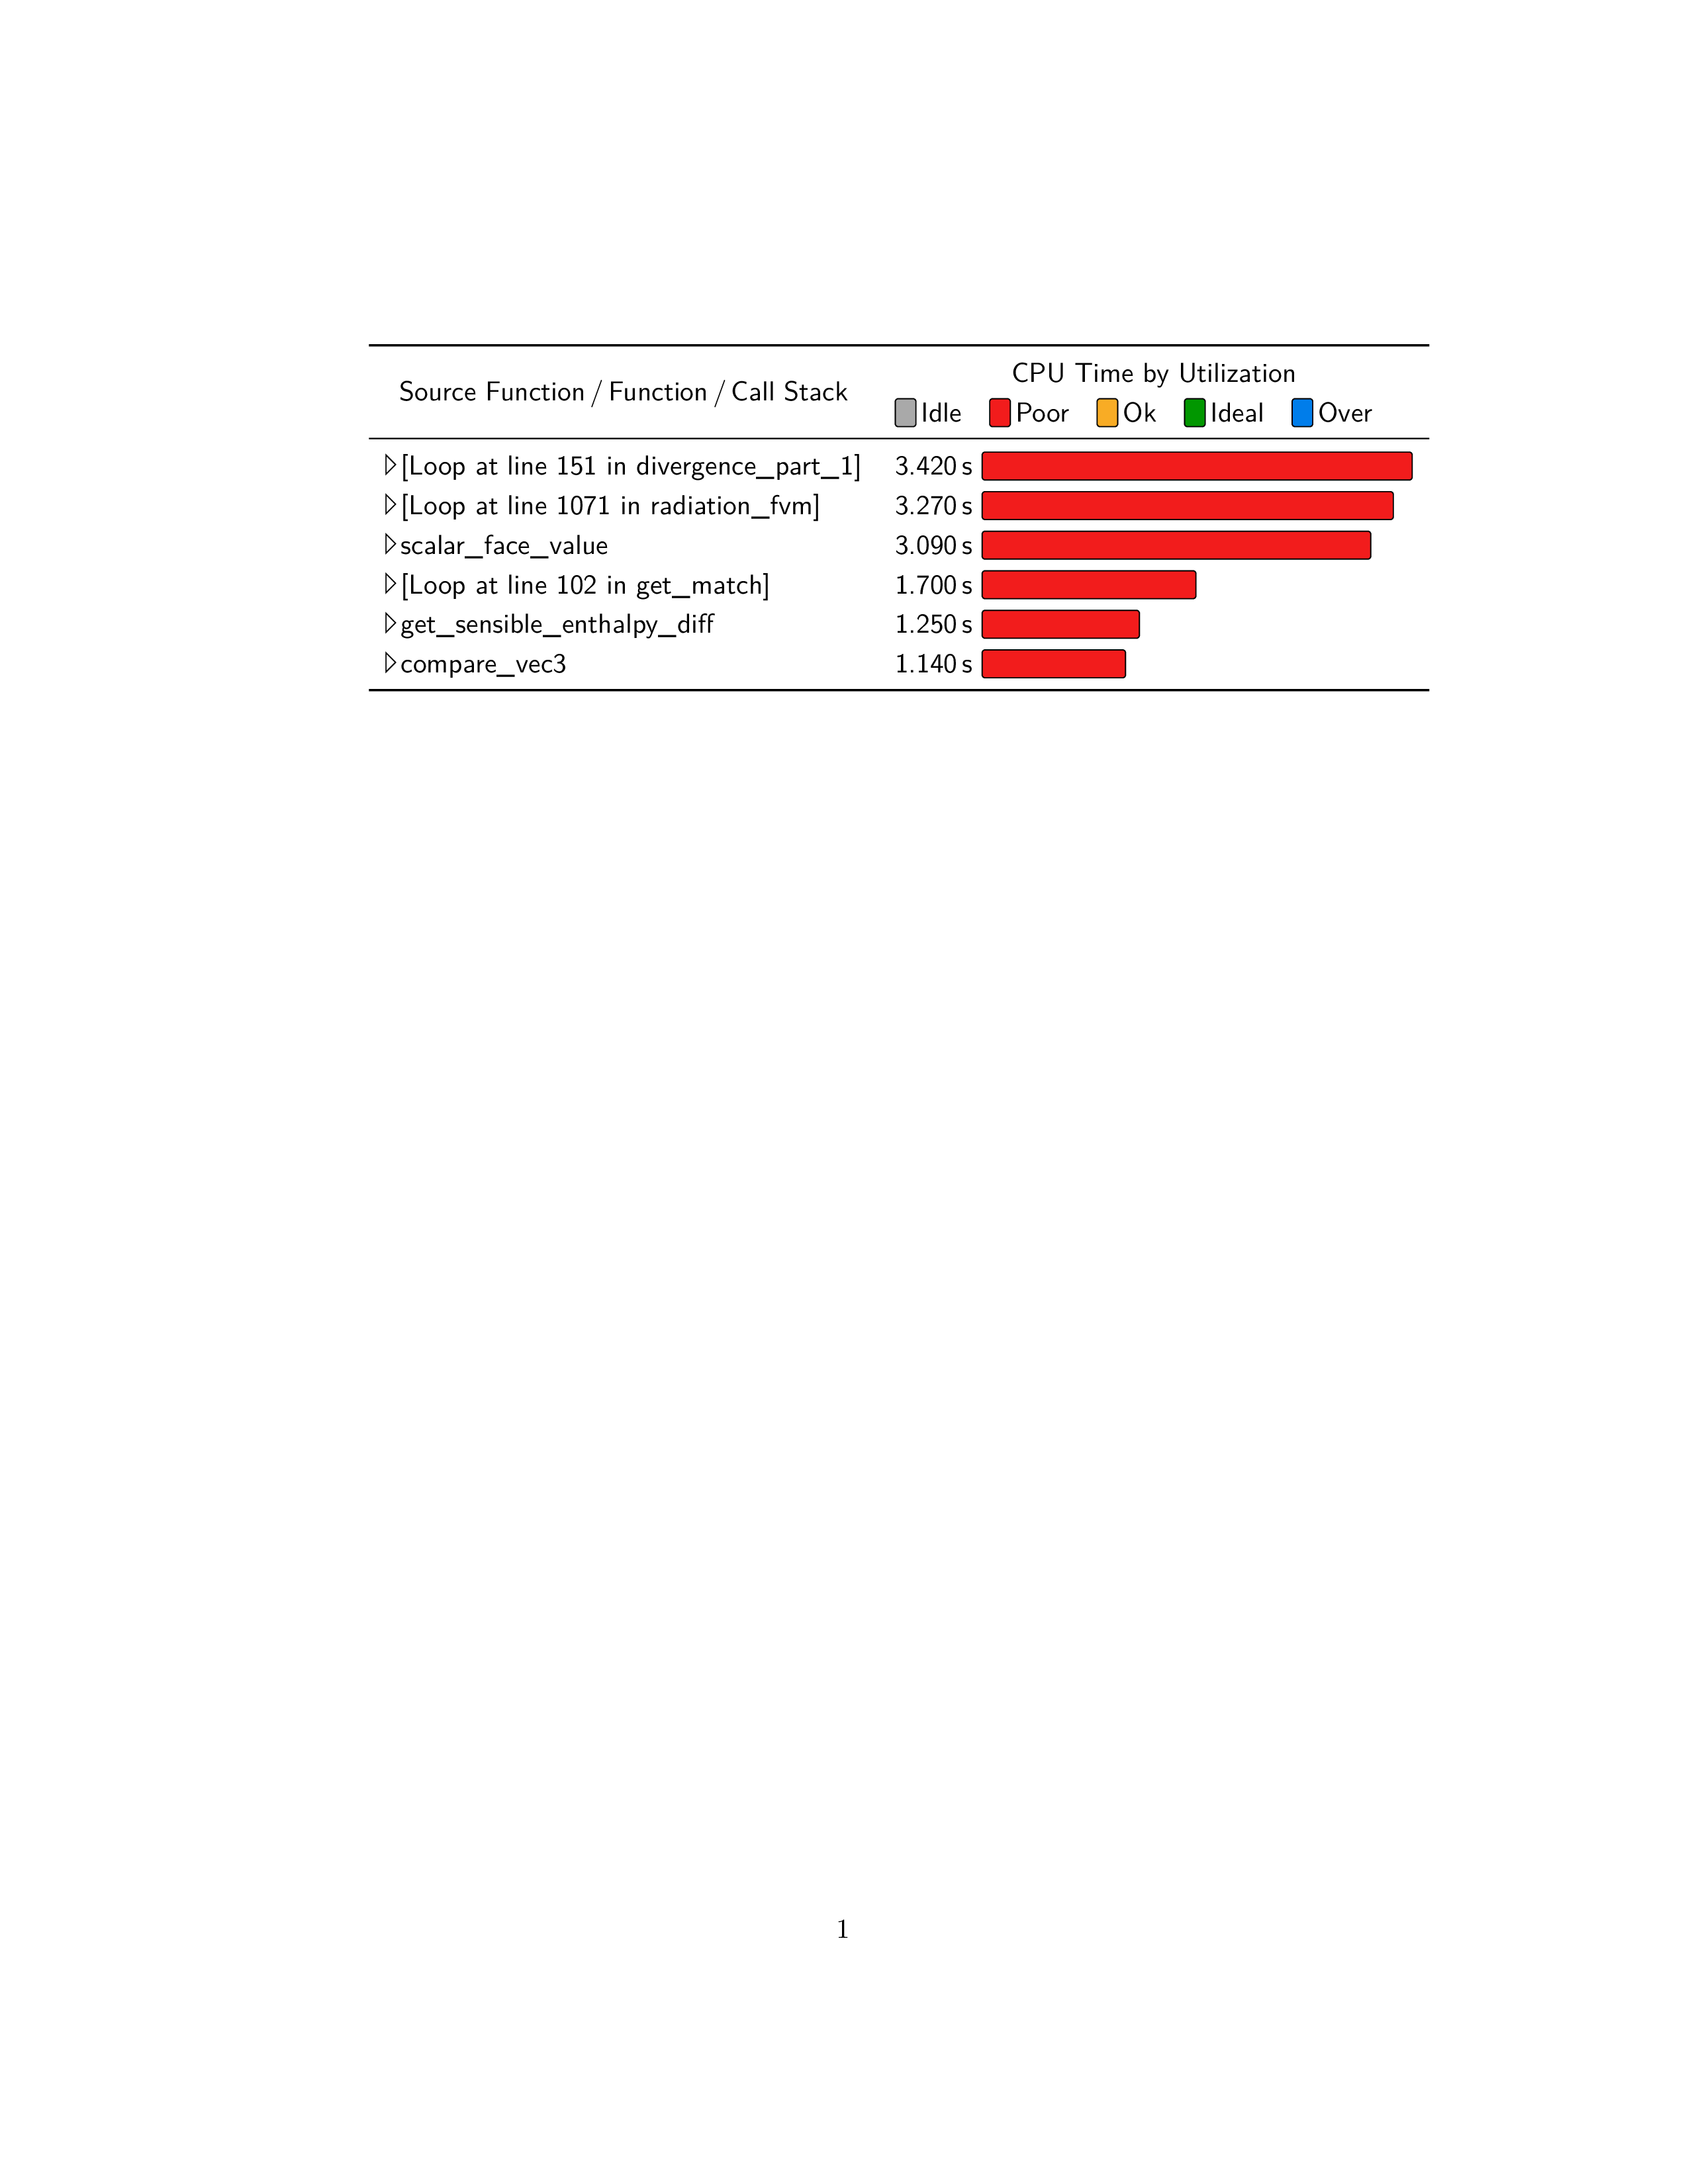
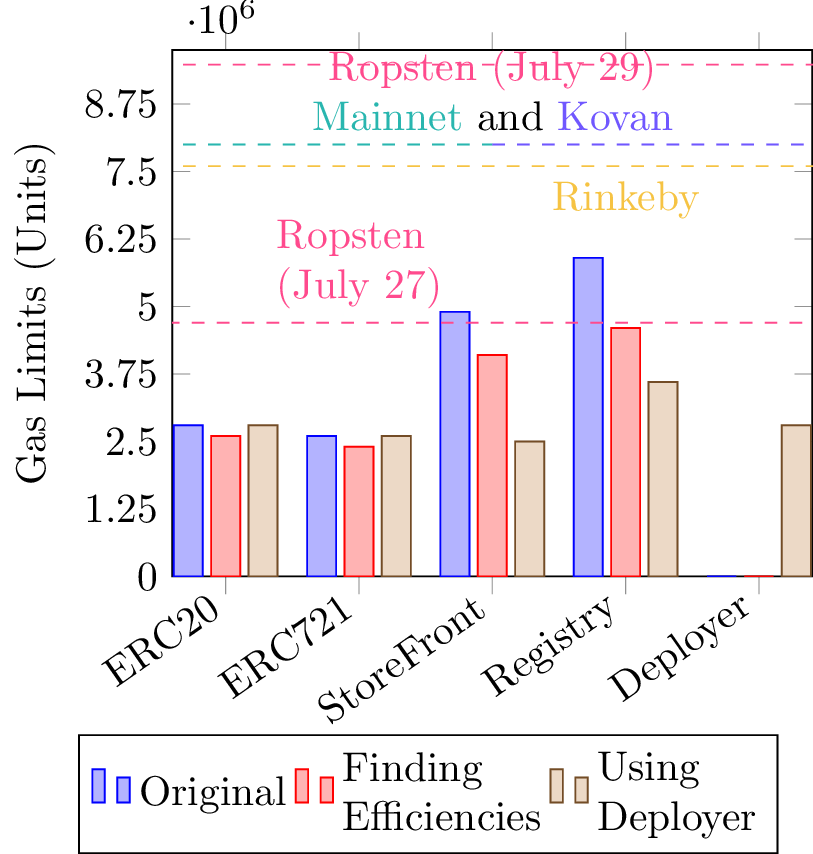
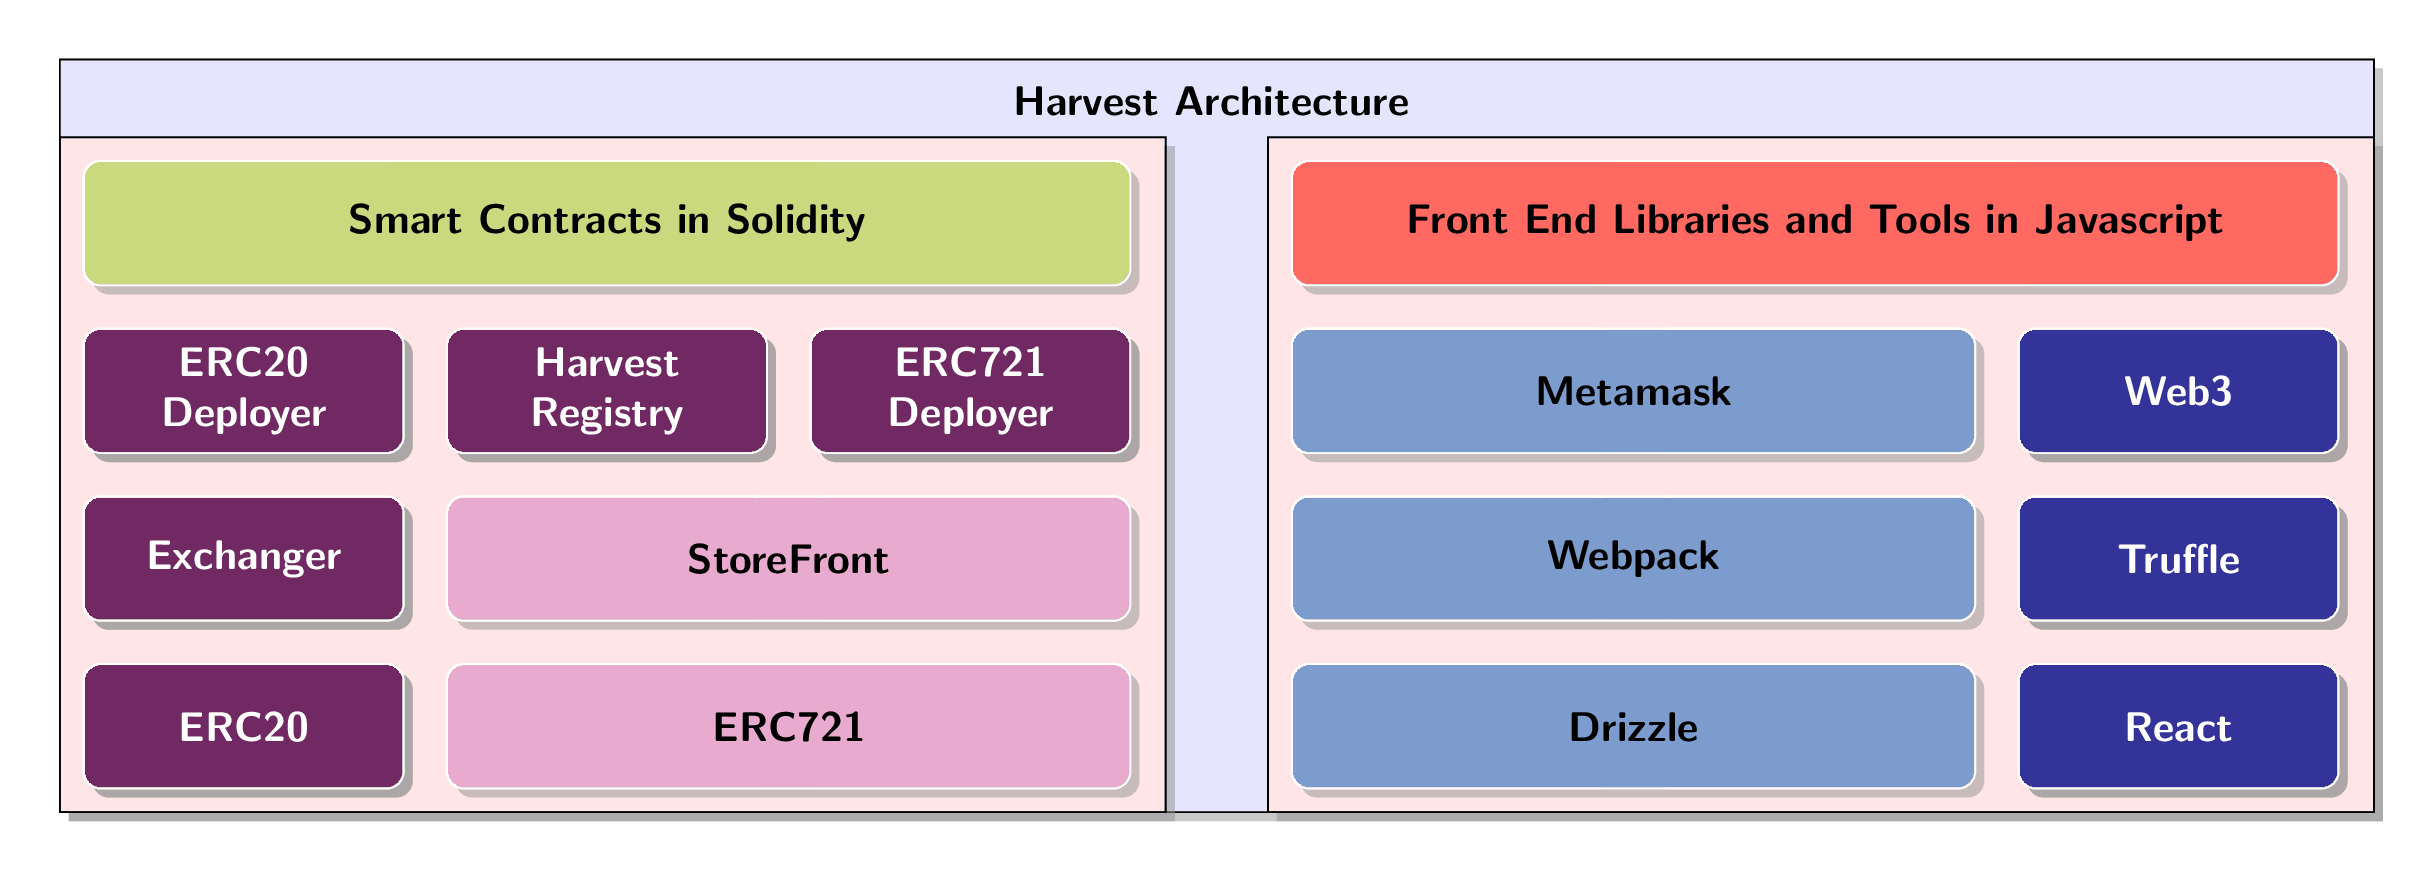
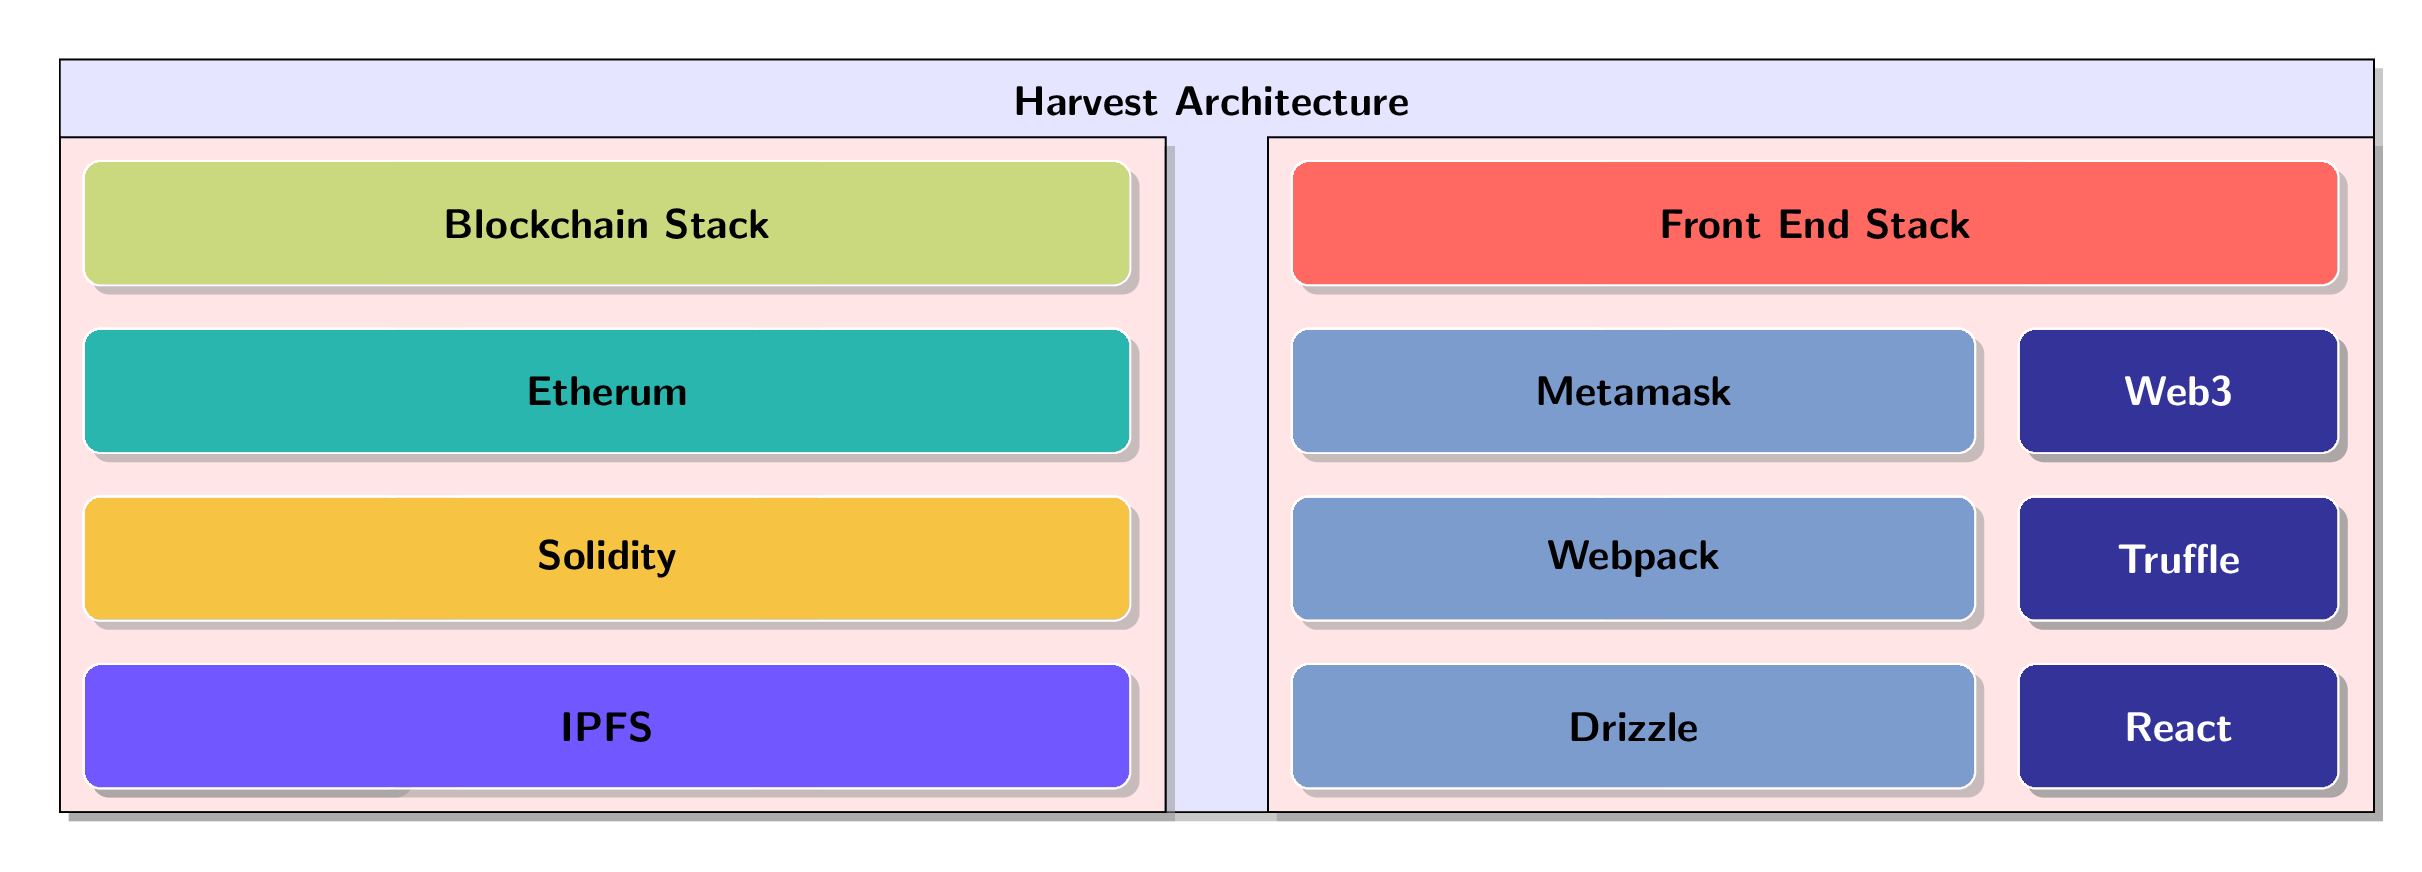
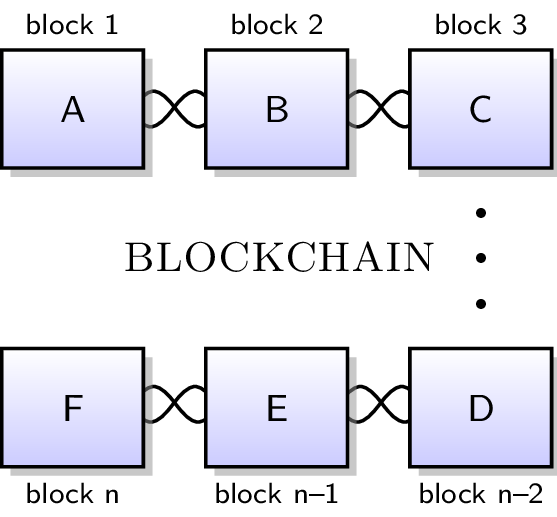
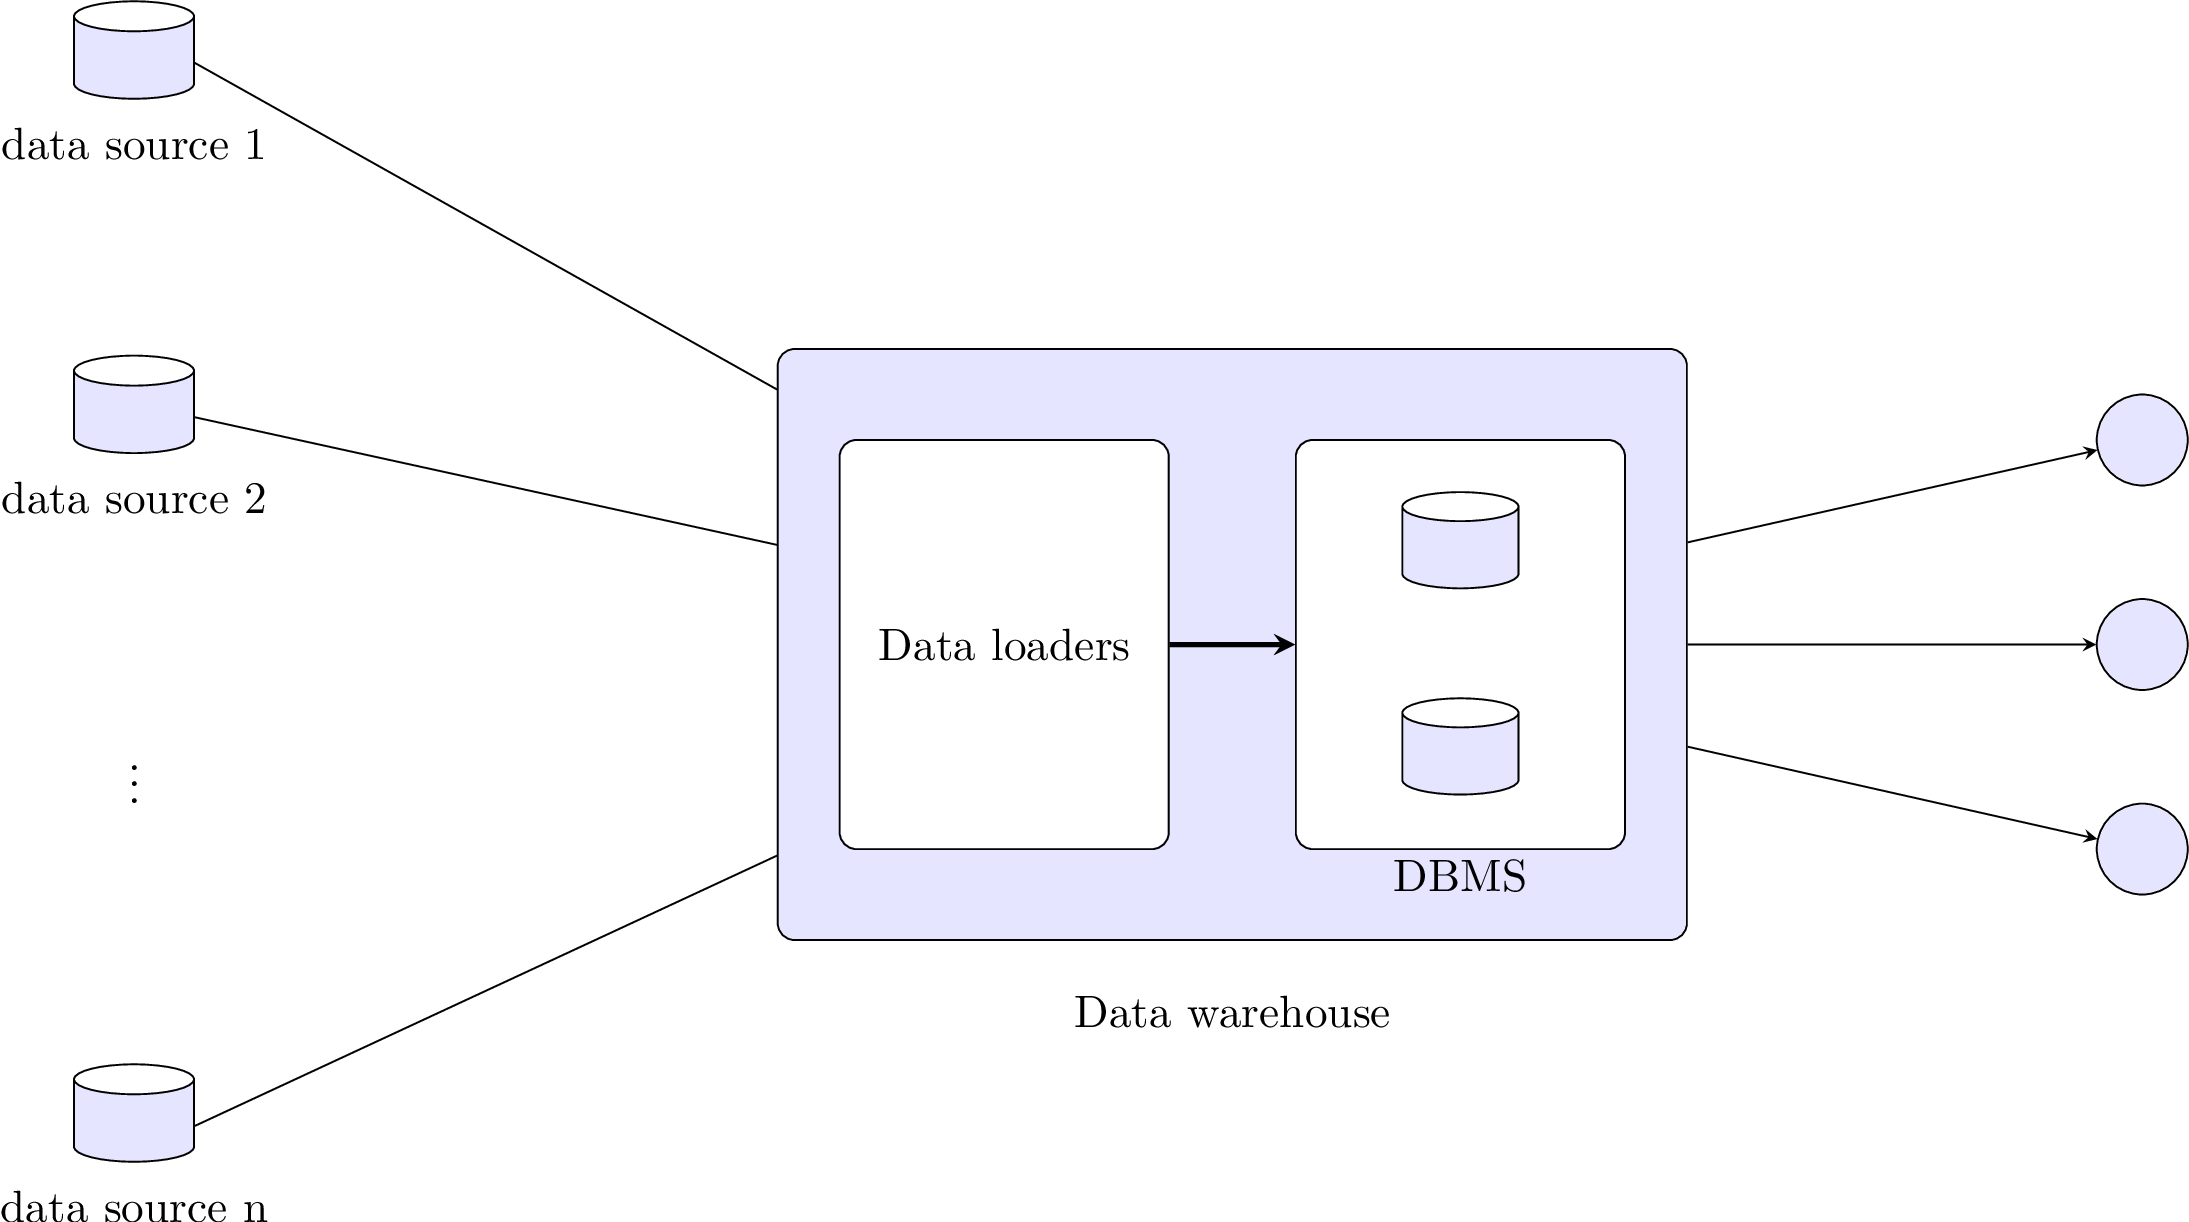
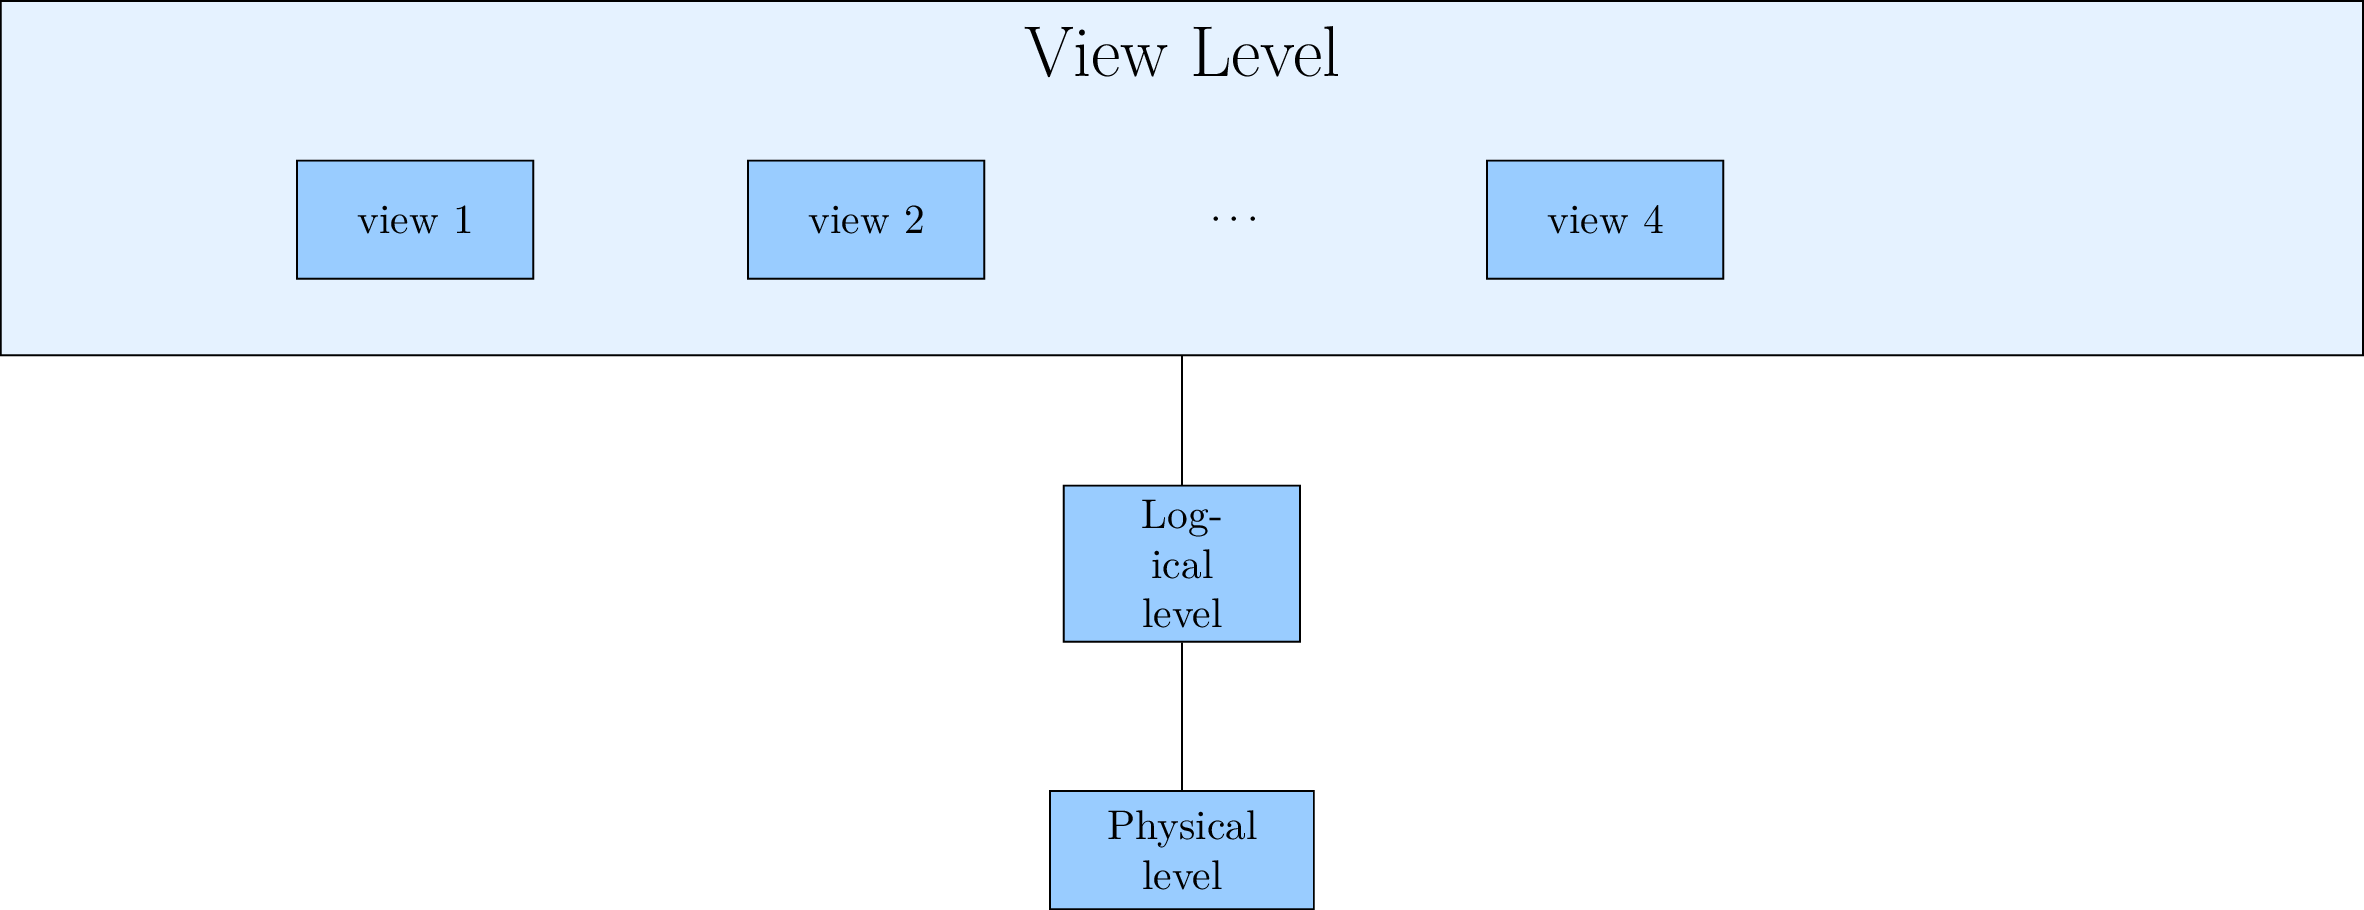
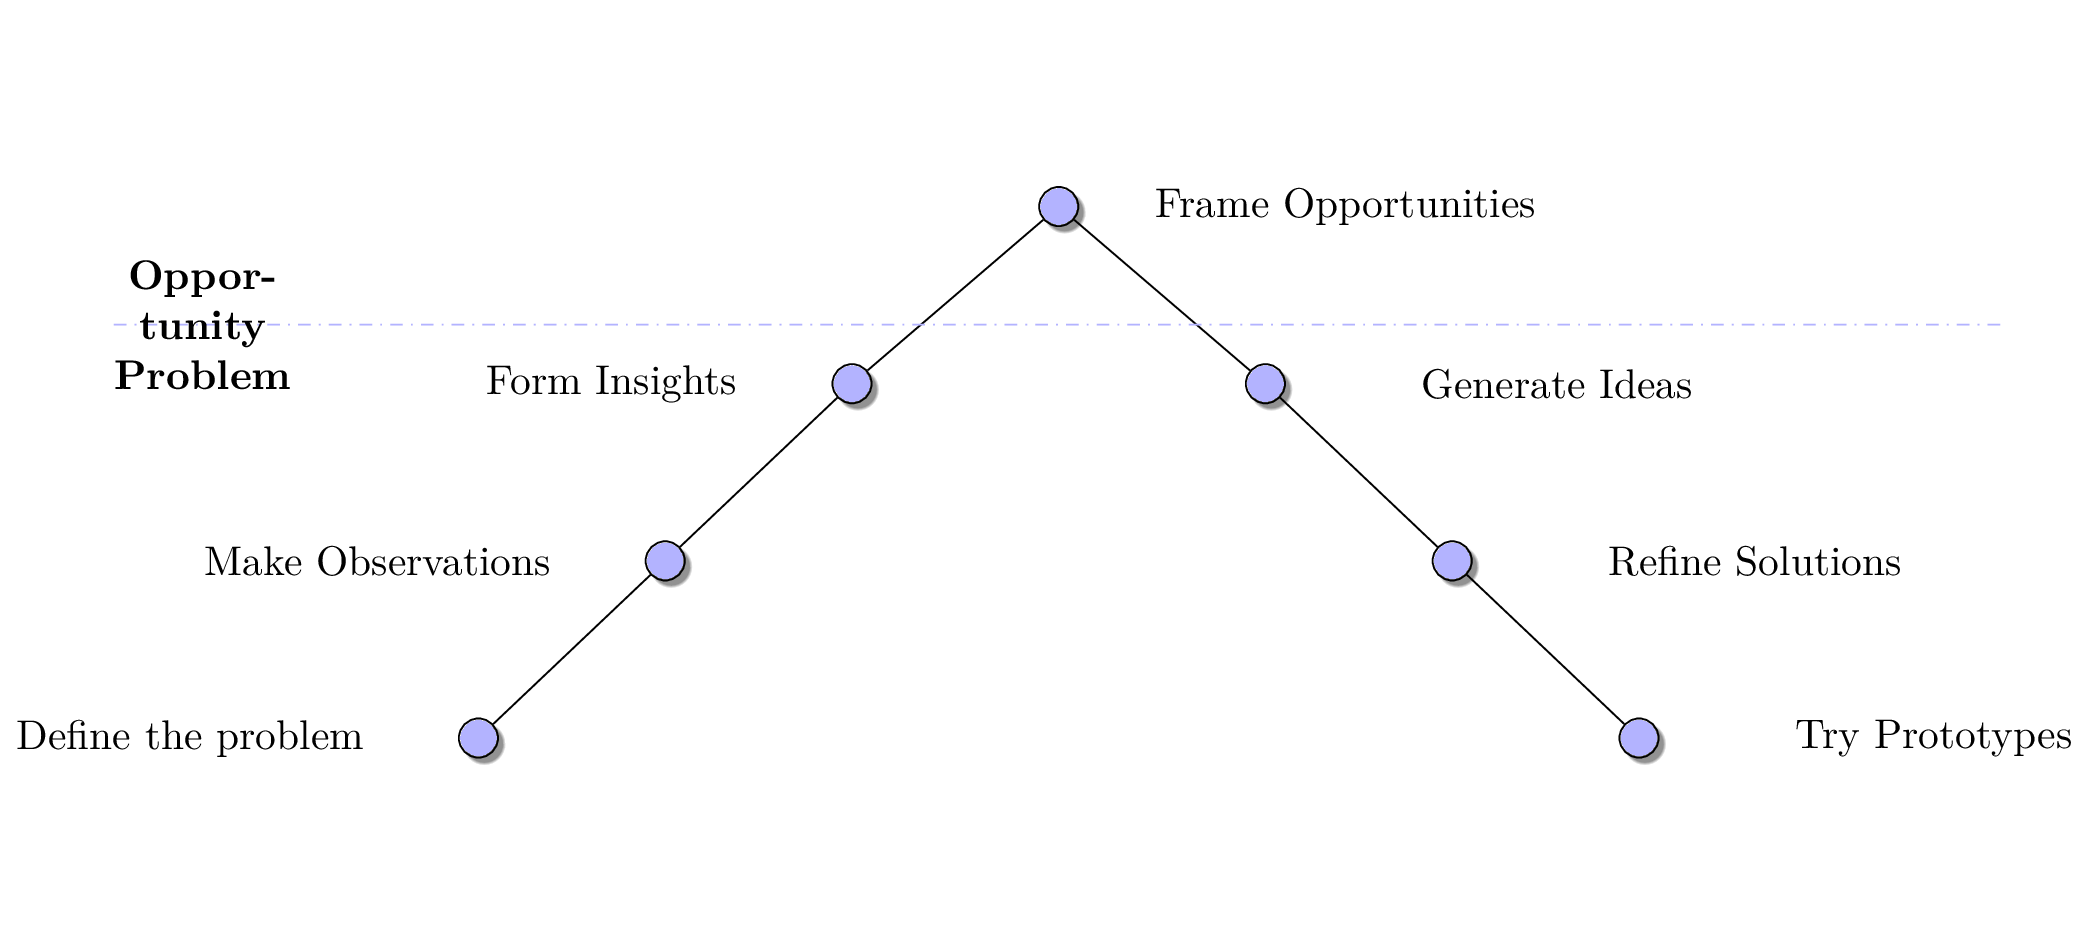
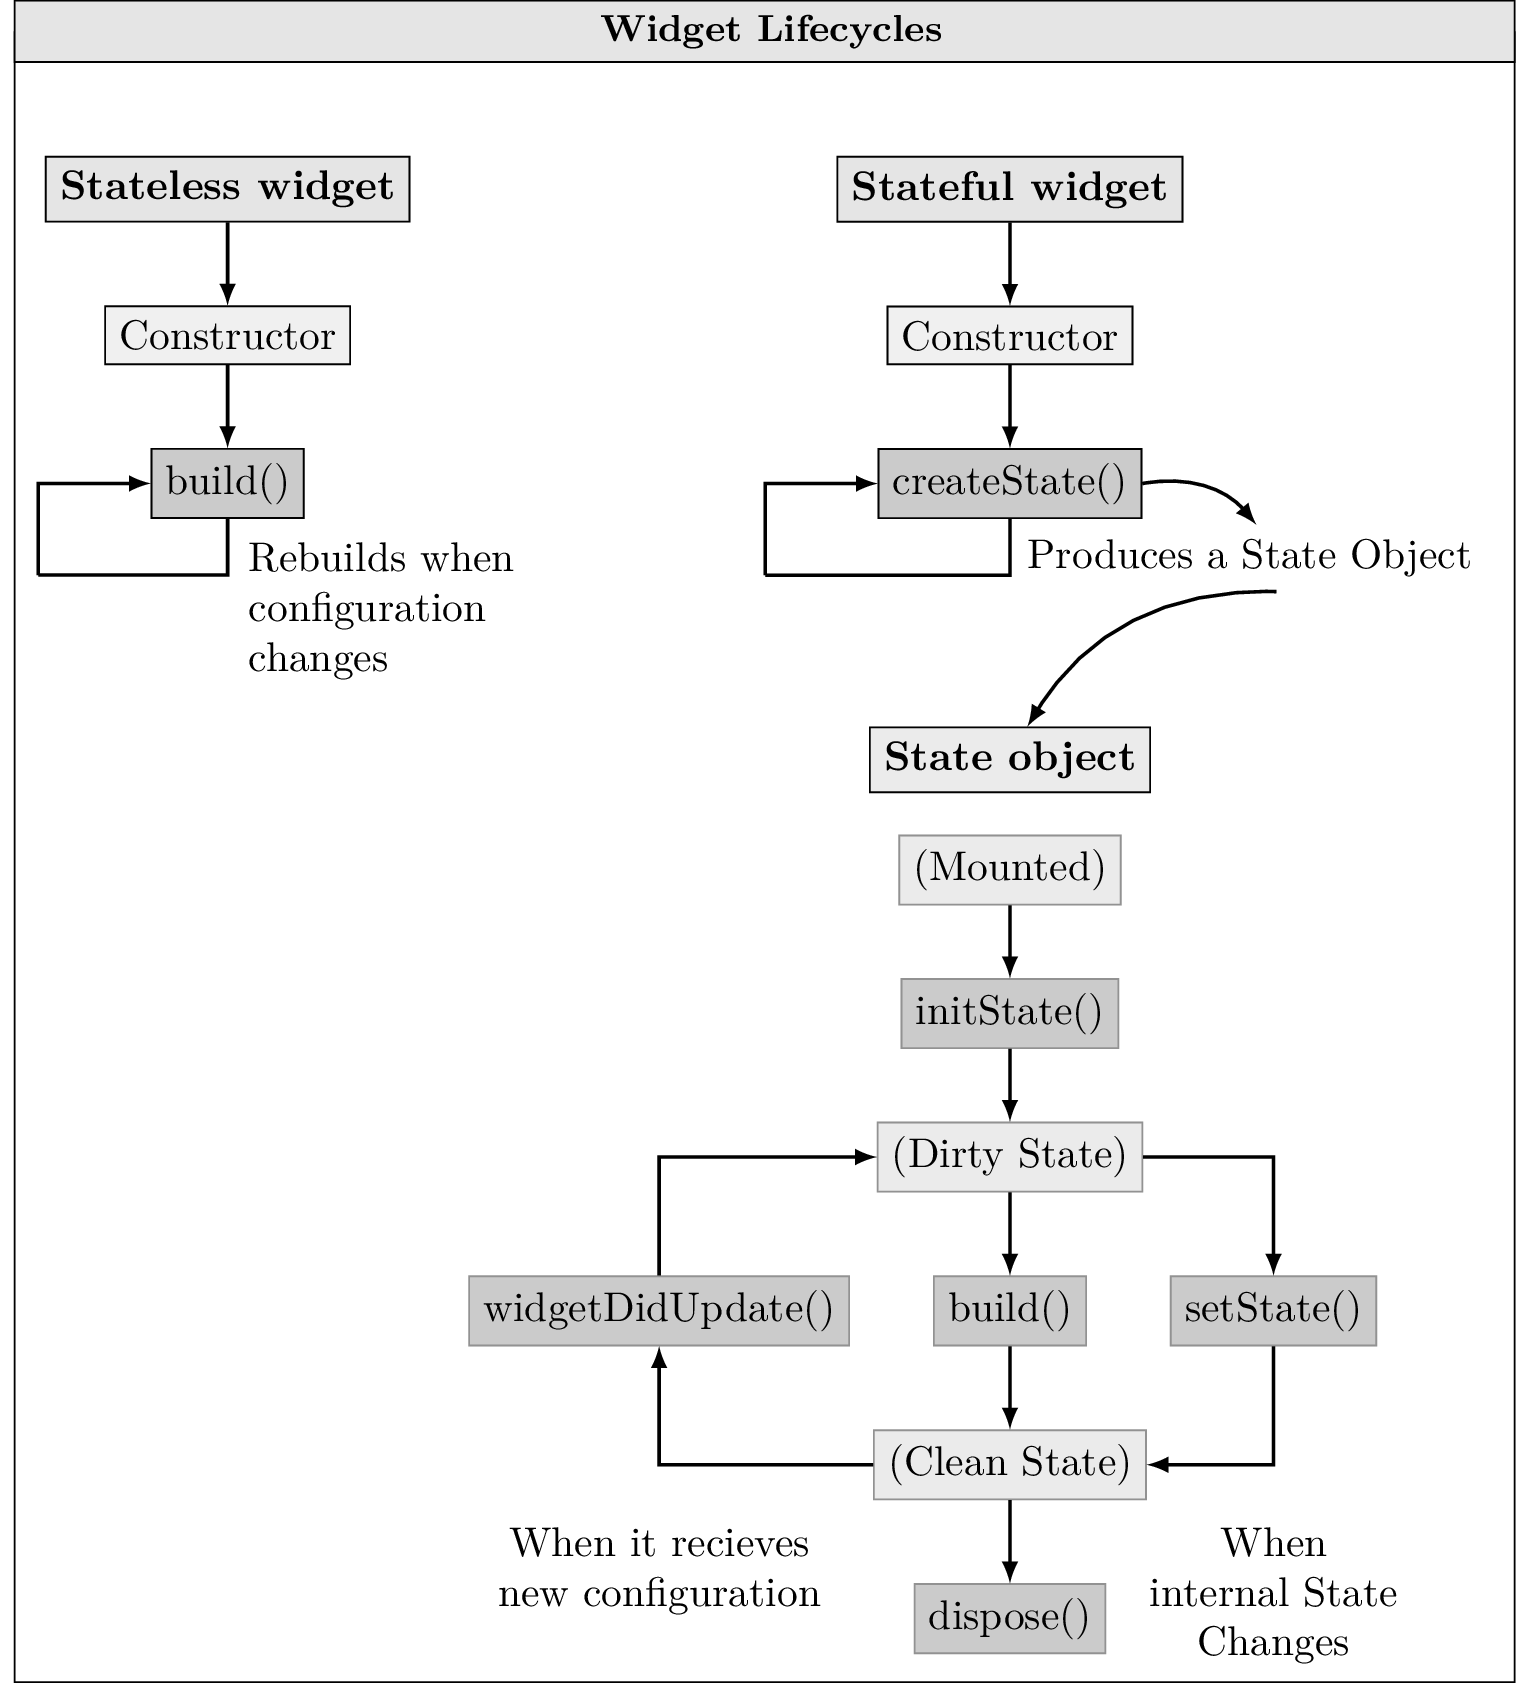
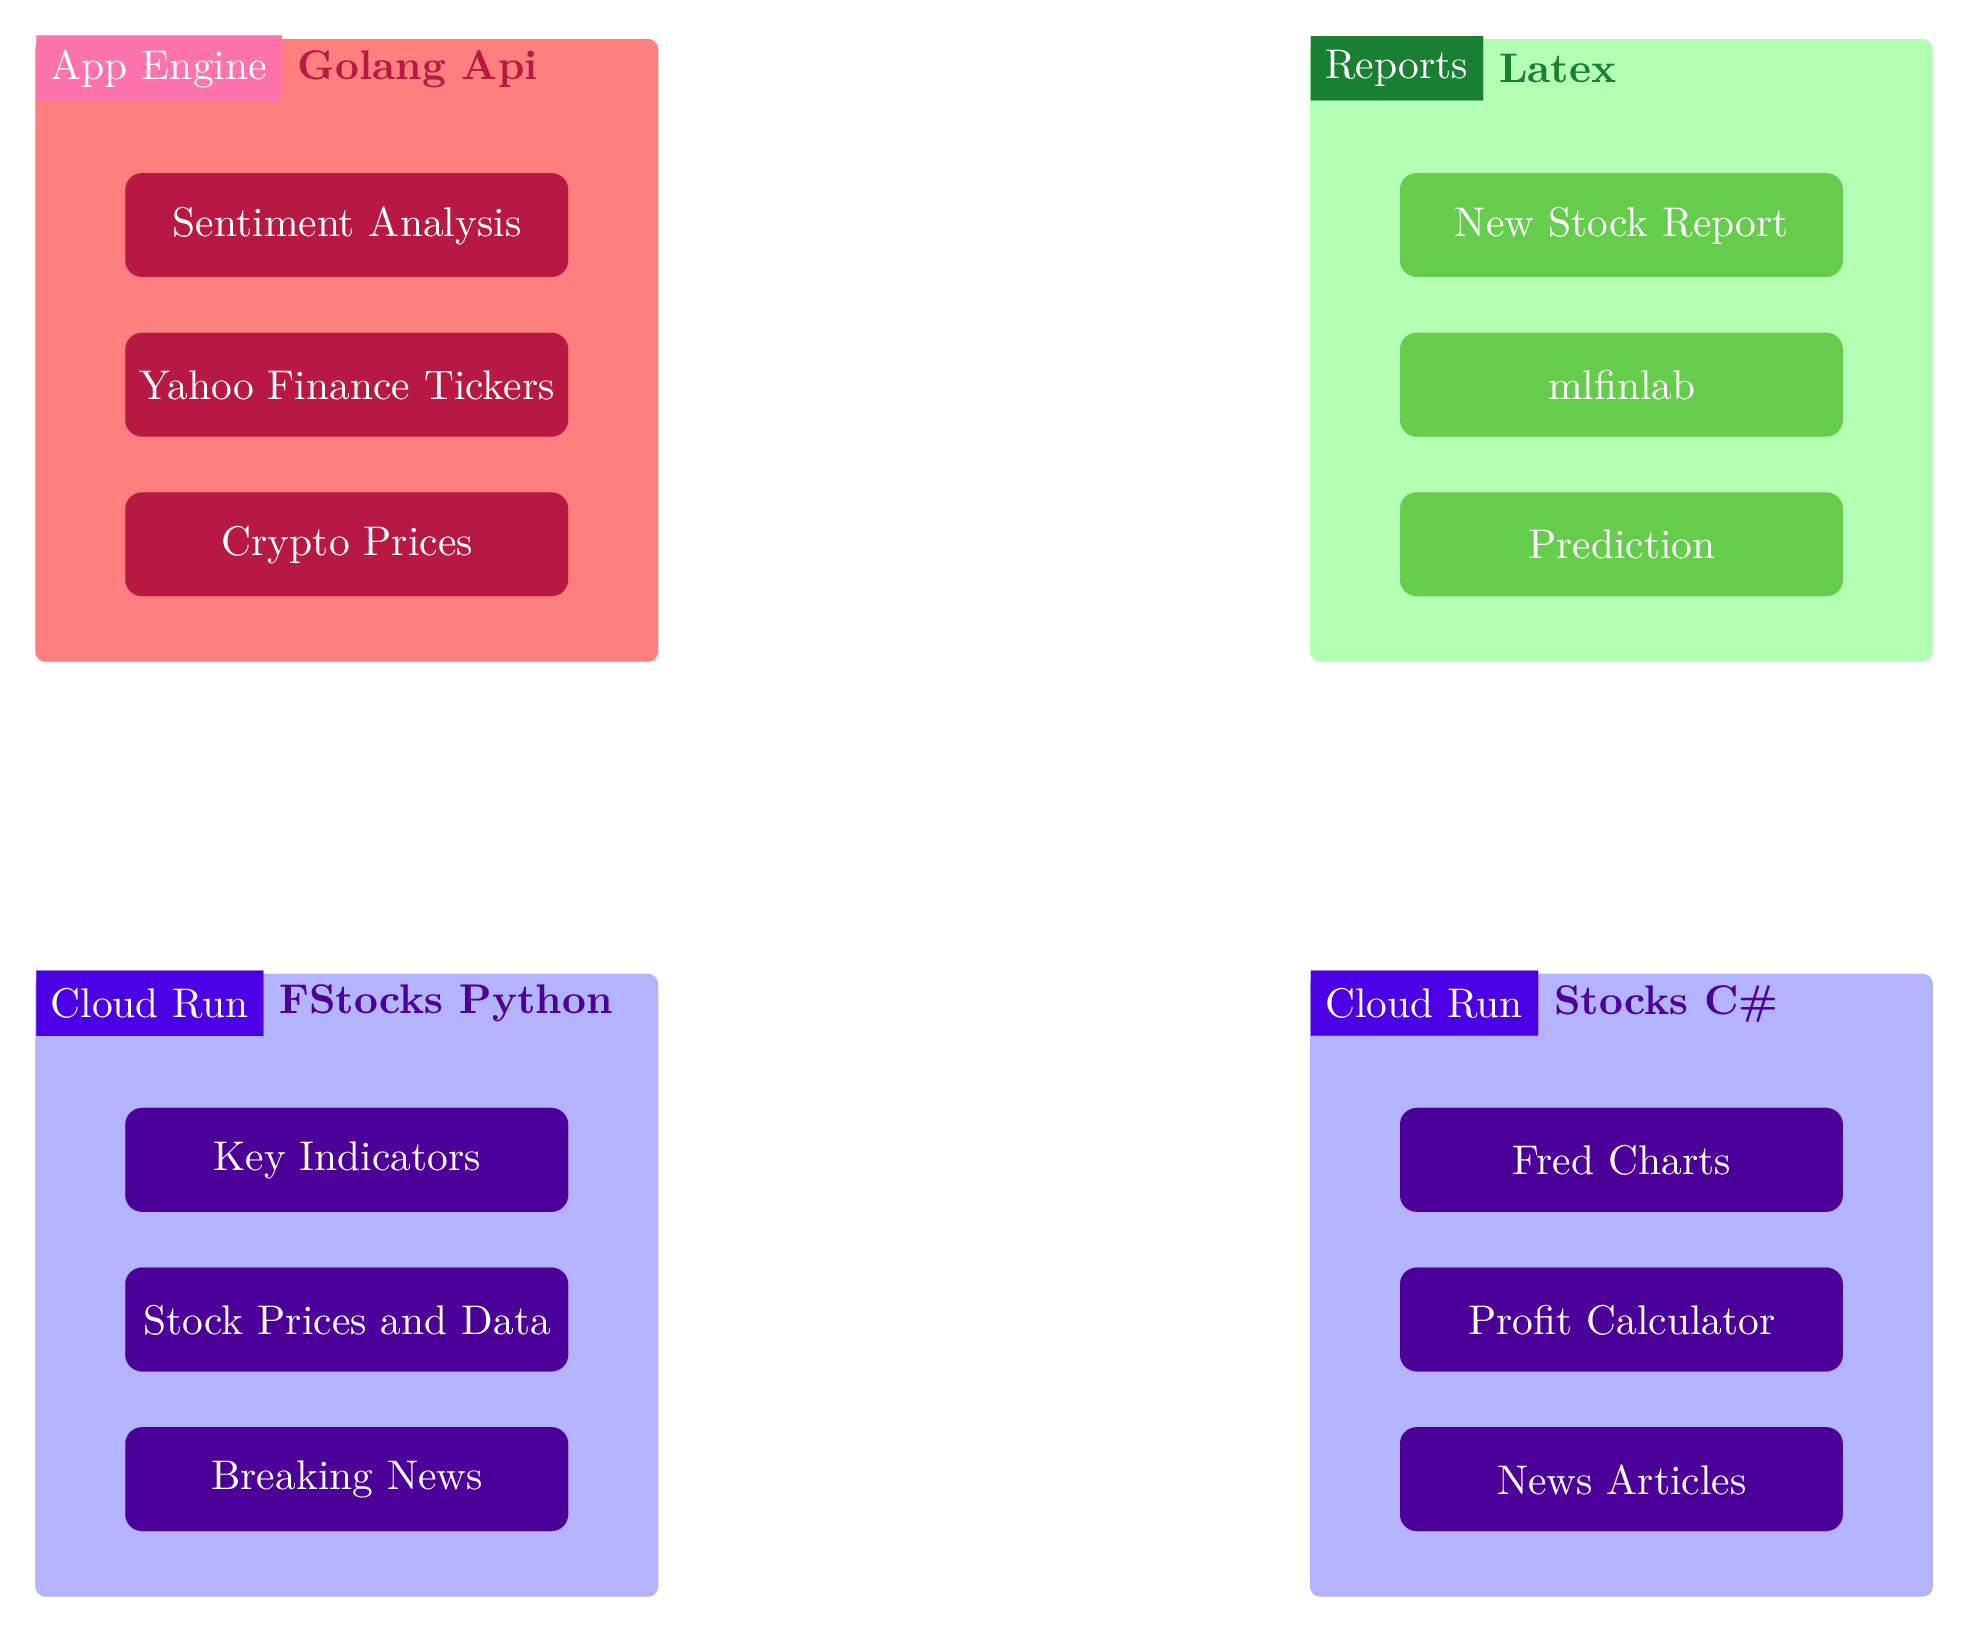
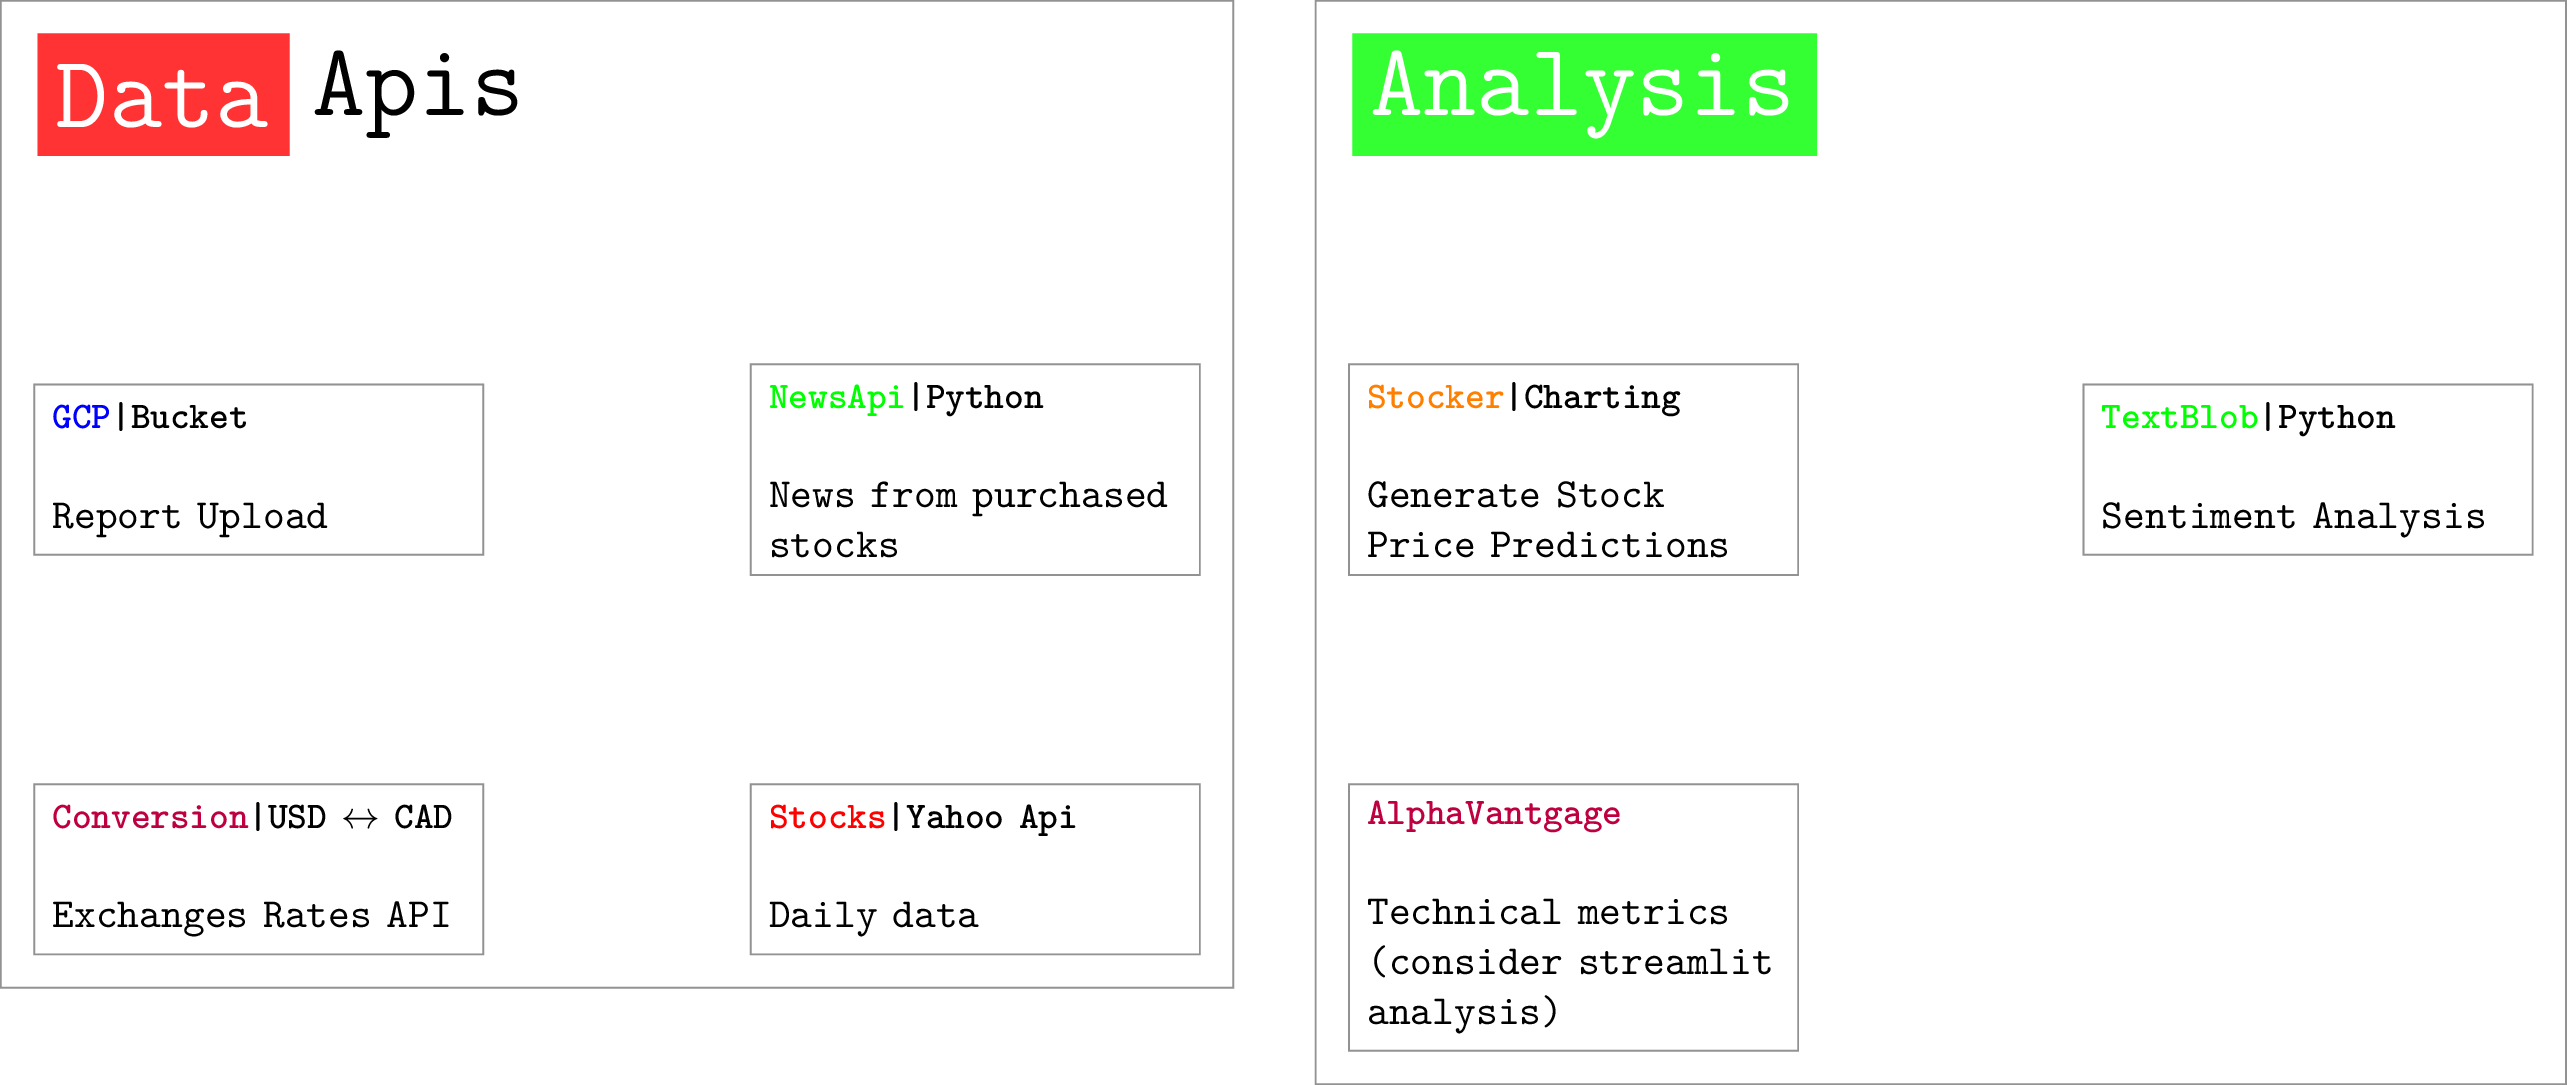
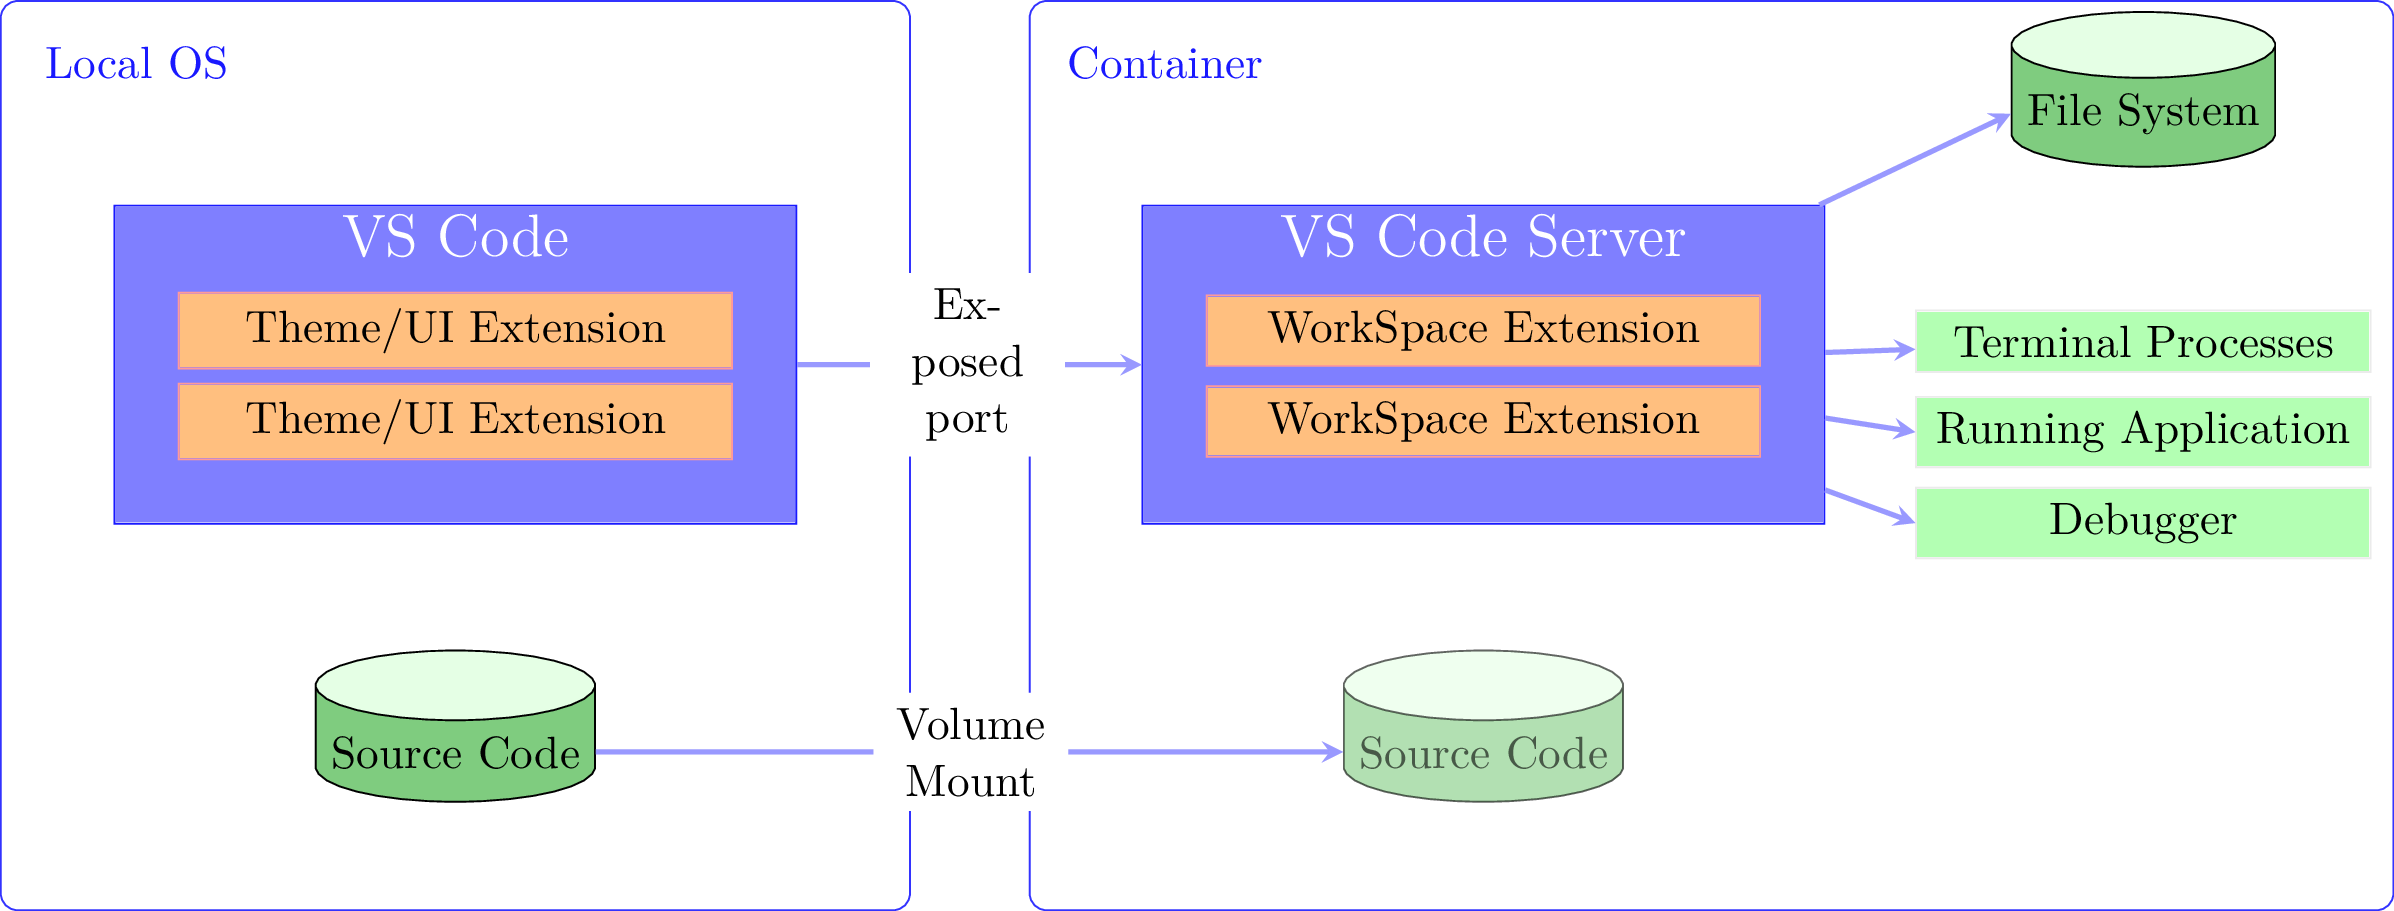
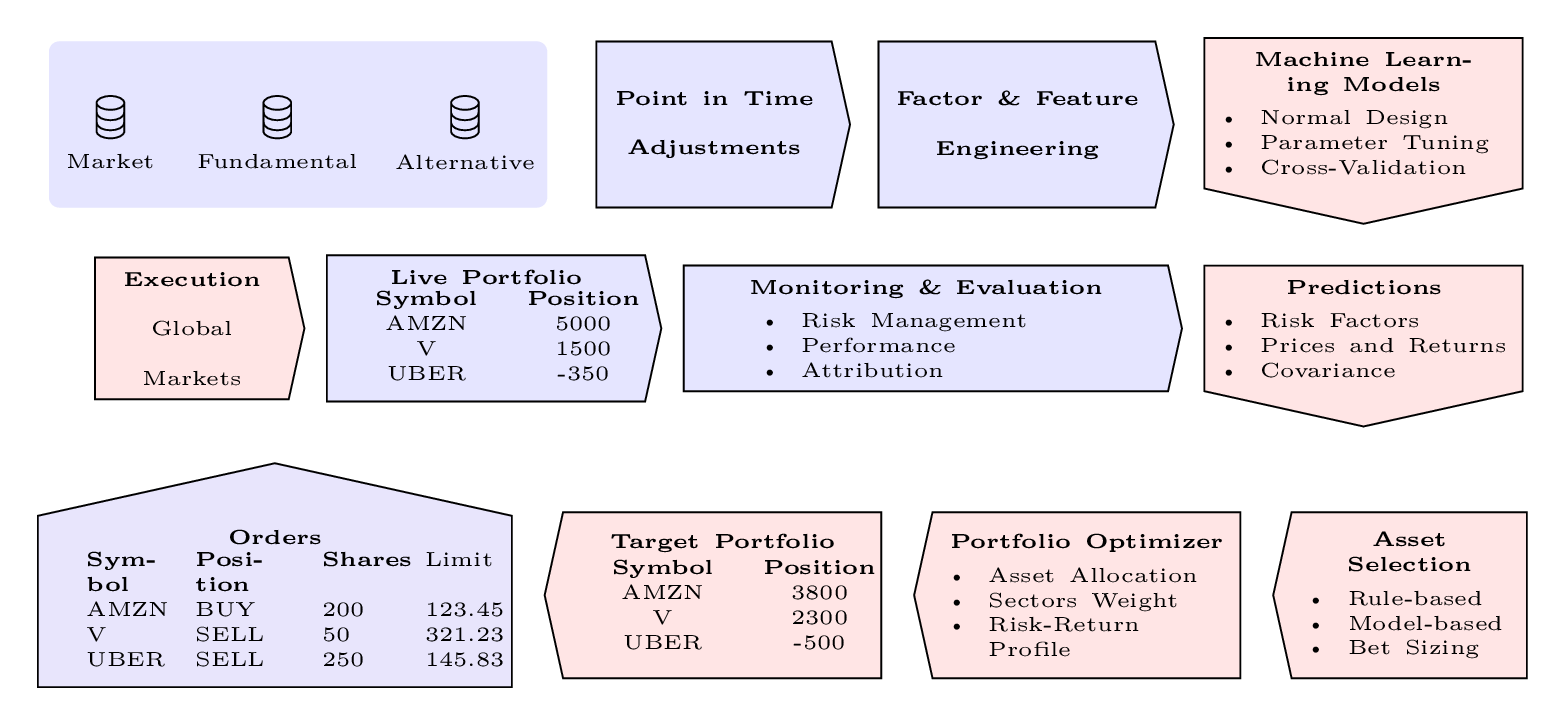
This repo contains all the diagrams I have generated for my academic career, for fun and referenced from stack overflow.
Willing to make custom diagrams for small fee, or even for free depending on the situation.
If you would like to motivate me to spend more time improving open source projects please consider donating.
For a list of links to files see dli-vue-docs created using the saber static site generator.
Table of contents generated with markdown-toc
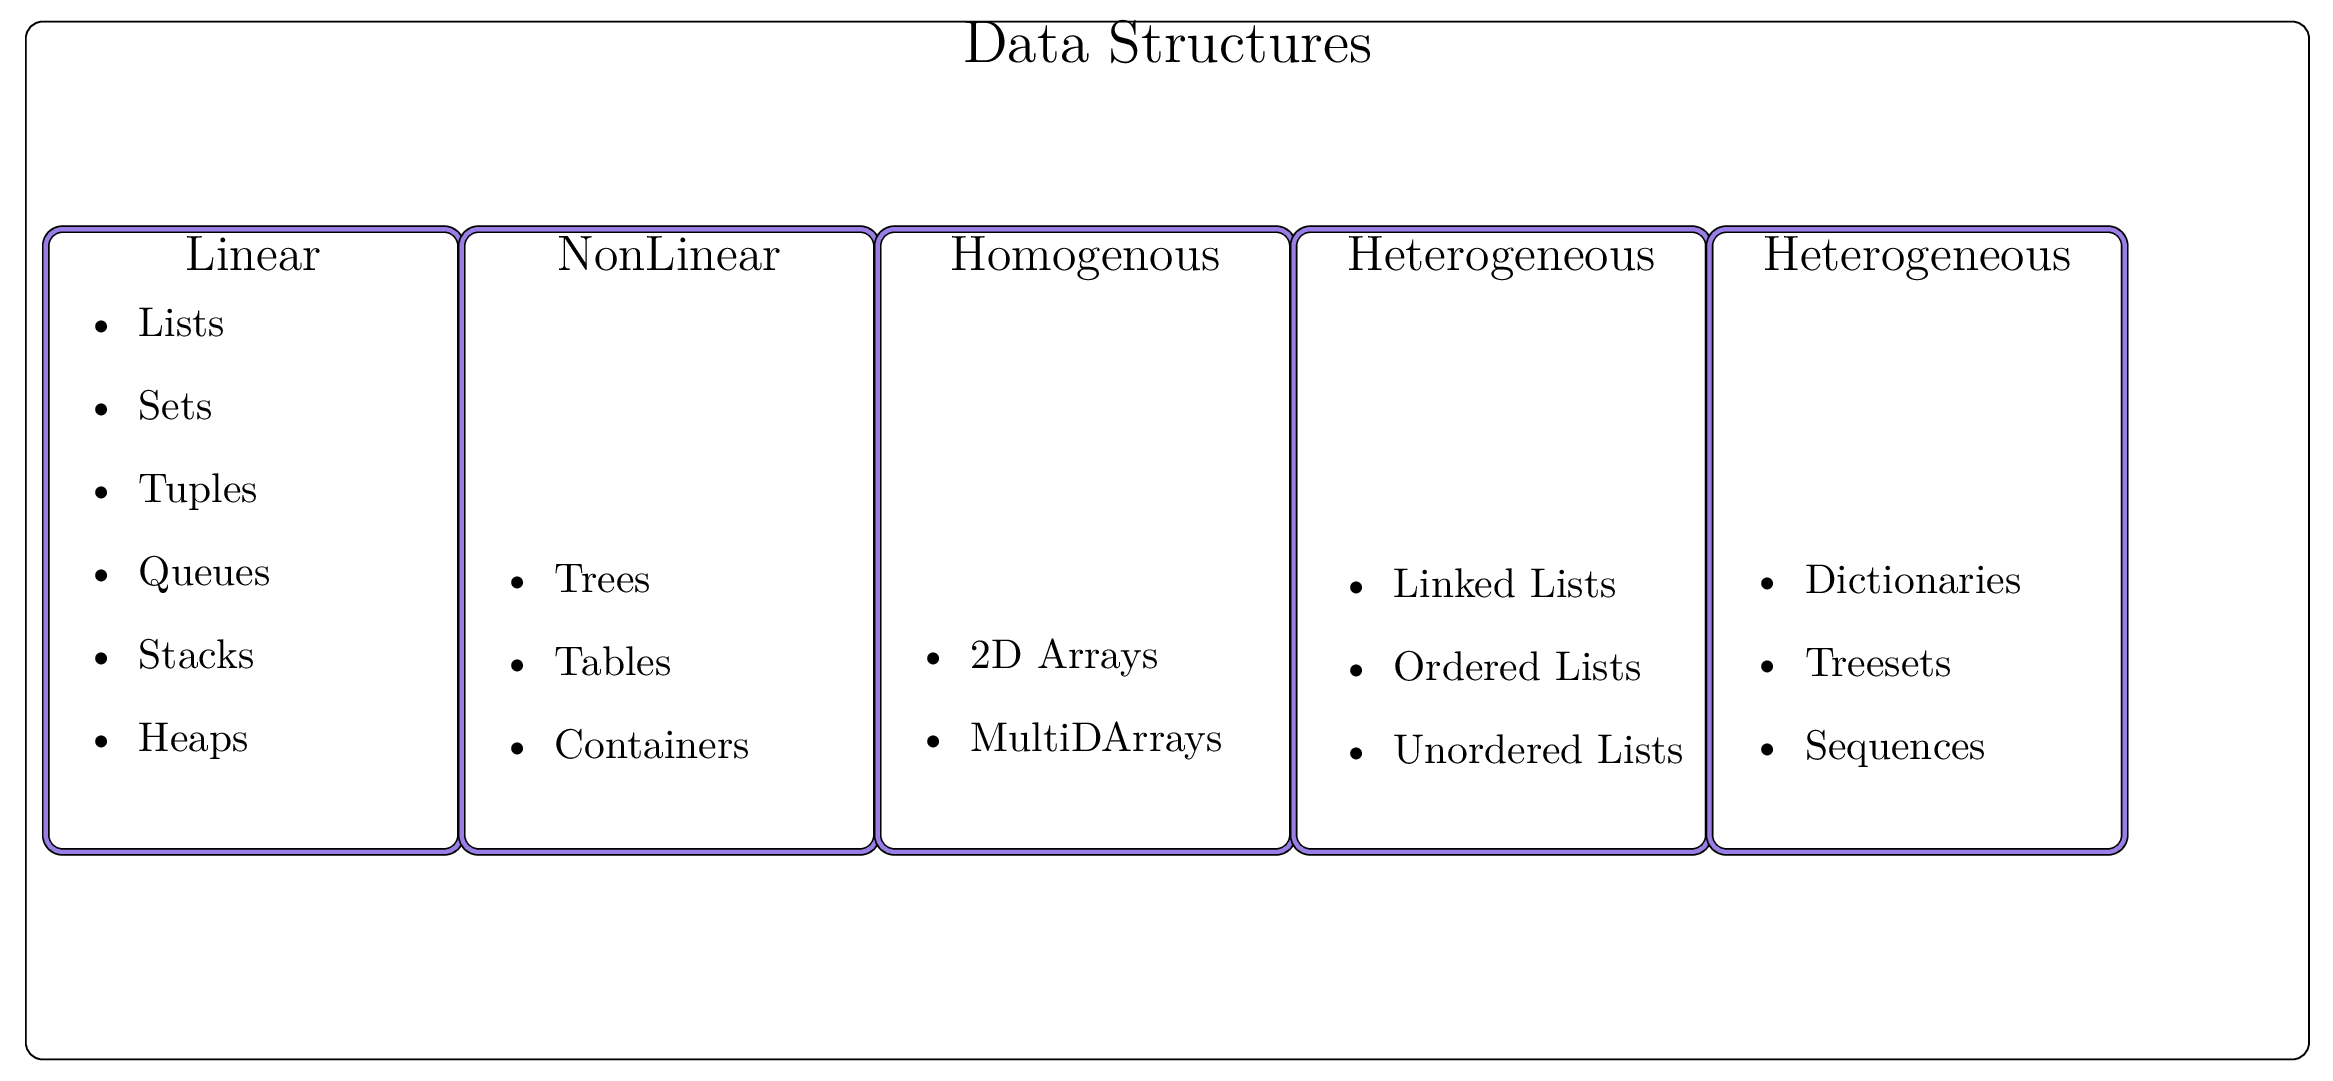
\documentclass[tikz,border=5pt, varwidth=false, preview=true]{standalone}
\usepackage{tikz}
\usepackage{enumerate}
\usepackage{enumitem}
\usetikzlibrary{positioning, calc, arrows}
\definecolor{purpleVue}{rgb}{0.6,0.5,0.9}
\usepackage{varwidth}
\begin{document}
\begin{tikzpicture}[text height=1.5ex,text depth=.25ex]
% Root Node
\node[draw, rounded corners, rectangle, minimum height= 25em, minimum width=55em, label={[anchor=north]north:{\Large Data Structures}}] (DS) {};

% Linear Node
\node[rounded corners, %fill=black,
text depth = 5em, minimum width=10em,
draw,
double=purpleVue, %% here
double distance =1pt,    %% here
%font=\Large,
minimum height= 15em,
text=purpleVue, label={[anchor=north]north:{\large Linear}}] at ([xshift=5.5em, yshift=0em]
% See https://tex.stackexchange.com/questions/27843/level-of-boldness-changeable
DS.west) (L){};
\node[draw=none] at ([xshift=17em, yshift=-6em] L.west) {{\vbox {
\begin{itemize}
\item Lists
\item Sets
\item Tuples
\item Queues
\item Stacks
\item Heaps
\end{itemize}}
}};

% % Non Linear Node
\node[rounded corners, %fill=black,
text depth = 5em, minimum width=10em,
draw,
double=purpleVue, %% here
double distance =1pt,    %% here
%font=\Large,
minimum height= 15em,
text=purpleVue, label={[anchor=north]north:{\large NonLinear}}] at ([xshift=5em, yshift=0em]
% See https://tex.stackexchange.com/questions/27843/level-of-boldness-changeable
L.east) (NL){};
\node[draw=none] at ([xshift=17em, yshift=-6em] NL.west) {{\vbox {
\begin{itemize}
\item Trees
\item Tables
\item Containers
\end{itemize}}
}};

% Homogenous Node
\node[rounded corners, %fill=black,
text depth = 5em, minimum width=10em,
draw,
double=purpleVue, %% here
double distance =1pt,    %% here
%font=\Large,
minimum height= 15em,
text=purpleVue, label={[anchor=north]north:{\large Homogenous}}] at ([xshift=5em, yshift=0em]
% See https://tex.stackexchange.com/questions/27843/level-of-boldness-changeable
NL.east) (Ho){};
\node[draw=none] at ([xshift=17em, yshift=-6em] Ho.west) {{\vbox {
\begin{itemize}
\item 2D Arrays
\item MultiDArrays
\end{itemize}}
}};

% Heterogeneous
\node[rounded corners, %fill=black,
text depth = 5em, minimum width=10em,
draw,
double=purpleVue, %% here
double distance =1pt,    %% here
%font=\Large,
minimum height= 15em,
text=purpleVue, label={[anchor=north]north:{\large Heterogeneous}}] at ([xshift=5em, yshift=0em]
Ho.east) (He){};
\node[draw=none] at ([xshift=4.5em, yshift=-3em] He.west) {
{
\setlength{\fboxsep}{0pt}%
  \setlength{\fboxrule}{0pt}%
\framebox{\begin{varwidth}{\linewidth}
\begin{itemize}
\item Linked Lists
\item Ordered Lists
\item Unordered Lists
\end{itemize}\end{varwidth}}
}};

% % Heterogeneous
\node[rounded corners, %fill=black,
text depth = 5em, minimum width=10em,
draw,
double=purpleVue, %% here
double distance =1pt,    %% here
%font=\Large,
minimum height= 15em,
text=purpleVue, label={[anchor=north]north:{\large Heterogeneous}}] at ([xshift=5em, yshift=0em]
He.east) (Dy){};
\node[draw=none] at ([xshift=3.5em, yshift=-3em] Dy.west)  {
{
% This is a better way to set items in a list, such that it doesn't impact the size of the tikzpicture
\setlength{\fboxsep}{0pt}%
  \setlength{\fboxrule}{0pt}%
\framebox{\begin{varwidth}{\linewidth}
\begin{itemize}
\item Dictionaries
\item Treesets
\item Sequences
\end{itemize}\end{varwidth}}
}};
\end{tikzpicture}
\end{document}\documentclass[tikz]{standalone}
\usepackage{ifthen}
\usepackage{fontawesome}
\usetikzlibrary{positioning}
\usetikzlibrary{chains}
\usetikzlibrary{shapes.multipart}
% SEE https://tex.stackexchange.com/questions/198813/how-to-make-a-boat-symbol-in-latex
\newcommand*{\myboatleft}{%
\protect\raisebox{-0.0000165em}{%
\protect\begin{tikzpicture}[ x=0.08em, y=0.08em, xscale=0.05, yscale=-0.05, inner
sep=0pt, outer sep=0pt, rotate=90]
\protect\path[fill=cyan!40] (99.9880,49.1240) .. controls (97.9470,49.1240) and (95.9760,48.6600) ..
(94.2380,47.8720) .. controls (92.4520,47.0370) and (90.4350,46.5500) ..
(88.3470,46.5500) .. controls (86.2380,46.5500) and (84.2200,47.0370) ..
(82.4350,47.8720) .. controls (80.6720,48.6600) and (78.7240,49.1240) ..
(76.6840,49.1240) .. controls (74.6660,49.1240) and (72.6950,48.6600) ..
(70.9560,47.8720) .. controls (69.1710,47.0370) and (67.1530,46.5500) ..
(65.0430,46.5500) .. controls (62.9560,46.5500) and (60.9390,47.0370) ..
(59.1530,47.8720) .. controls (57.3910,48.6600) and (55.4430,49.1240) ..
(53.4030,49.1240) .. controls (51.3620,49.1240) and (49.4140,48.6600) ..
(47.6740,47.8720) .. controls (45.8890,47.0370) and (43.8710,46.5500) ..
(41.7620,46.5500) .. controls (39.6520,46.5500) and (37.6570,47.0370) ..
(35.8720,47.8720) .. controls (34.1100,48.6600) and (32.1620,49.1240) ..
(30.1220,49.1240) .. controls (28.0820,49.1240) and (26.1570,48.6600) ..
(24.4170,47.8720) .. controls (22.6080,47.0370) and (20.6140,46.5500) ..
(18.5040,46.5500) .. controls (16.3940,46.5500) and (14.4000,47.0370) ..
(12.5910,47.8720) .. controls (10.8520,48.6600) and (8.9040,49.1240) ..
(6.8630,49.1240) -- (6.8630,40.5210) .. controls (8.9040,40.5210) and
(10.8510,40.0570) .. (12.5910,39.2680) .. controls (14.4000,38.4570) and
(16.3940,37.9700) .. (18.5040,37.9700) .. controls (20.6140,37.9700) and
(22.6080,38.4570) .. (24.4170,39.2680) .. controls (26.1560,40.0570) and
(28.0810,40.5210) .. (30.1220,40.5210) .. controls (32.1630,40.5210) and
(34.1100,40.0570) .. (35.8720,39.2680) .. controls (37.6570,38.4570) and
(39.6520,37.9700) .. (41.7620,37.9700) .. controls (43.8710,37.9700) and
(45.8890,38.4570) .. (47.6740,39.2680) .. controls (49.4130,40.0570) and
(51.3620,40.5210) .. (53.4030,40.5210) .. controls (55.4430,40.5210) and
(57.3910,40.0570) .. (59.1530,39.2680) .. controls (60.9380,38.4570) and
(62.9560,37.9700) .. (65.0430,37.9700) .. controls (67.1530,37.9700) and
(69.1710,38.4570) .. (70.9560,39.2680) .. controls (72.6940,40.0570) and
(74.6660,40.5210) .. (76.6840,40.5210) .. controls (78.7240,40.5210) and
(80.6720,40.0570) .. (82.4350,39.2680) .. controls (84.2200,38.4570) and
(86.2380,37.9700) .. (88.3470,37.9700) .. controls (90.4350,37.9700) and
(92.4510,38.4570) .. (94.2380,39.2680) .. controls (95.9760,40.0570) and
(97.9470,40.5210) .. (99.9880,40.5210) -- (99.9880,49.1240) -- cycle;
\protect\path[fill=gray!30] (76.5680,13.1940) -- (93.4960,14.5150) -- (92.2210,5.8660)
-- (79.7910,4.9850) .. controls (76.4300,4.8230) and (76.9160,8.1850) ..
(76.9160,8.1850) -- (76.5680,13.1940) -- cycle;
\protect\path[fill=gray!30] (45.1720,11.2230) .. controls (48.2790,11.2230) and
(50.7830,8.7190) .. (50.7830,5.6120) .. controls (50.7830,2.5050) and (48.2790,0.0000) .. (45.1720,0.0000) .. controls (42.0650,0.0000) and (39.5610,2.5050) ..
(39.5610,5.6120) .. controls (39.5610,8.7190) and (42.0640,11.2230) ..
(45.1720,11.2230) -- cycle;
\protect\path[fill=gray!30] (10.5290,32.8460) .. controls (11.2480,32.6380) and (11.9440,32.3600) ..
(12.5930,32.0580) .. controls (14.4020,31.2230) and (16.3960,30.7360) ..
(18.5060,30.7360) .. controls (20.6160,30.7360) and (22.6100,31.2230) ..
(24.4190,32.0580) .. controls (26.1580,32.8460) and (28.0830,33.3100) ..
(30.1240,33.3100) .. controls (32.1650,33.3100) and (34.1120,32.8460) ..
(35.8740,32.0580) .. controls (37.6590,31.2230) and (39.6540,30.7360) ..
(41.7640,30.7360) .. controls (43.8730,30.7360) and (45.8910,31.2230) ..
(47.6760,32.0580) .. controls (49.4150,32.8460) and (51.3640,33.3100) ..
(53.4050,33.3100) .. controls (55.4450,33.3100) and (57.3930,32.8460) ..
(59.1550,32.0580) .. controls (60.9400,31.2230) and (62.9580,30.7360) ..
(65.0450,30.7360) .. controls (67.1550,30.7360) and (69.1730,31.2230) ..
(70.9580,32.0580) .. controls (72.6960,32.8460) and (74.6680,33.3100) ..
(76.6860,33.3100) .. controls (78.7260,33.3100) and (80.6740,32.8460) ..
(82.4370,32.0580) .. controls (84.2220,31.2230) and (86.2400,30.7360) ..
(88.3490,30.7360) .. controls (90.4370,30.7360) and (92.4530,31.2230) ..
(94.2400,32.0580) .. controls (95.9780,32.8460) and (97.9270,33.3100) ..
(99.9670,33.3100) -- (98.0660,17.9710) -- (27.6910,12.0810) --
(38.3110,1.3680) -- (33.6500,0.9510) -- (23.0500,11.6870) -- (0.0010,9.7860)
.. controls (-0.1380,17.6460) and (8.6270,30.7130) .. (10.5290,32.8460) --
(10.5290,32.8460) -- cycle;
\protect\end{tikzpicture}}
~}
\newcommand*{\myboatright}{%
\protect\raisebox{-0.0000165em}{%
\protect\begin{tikzpicture}[draw=none, x=0.08em, y=0.08em, xscale=0.05, yscale=0.05, inner
sep=0pt, outer sep=0pt, rotate=90]
\protect\path[fill=cyan!40] (99.9880,49.1240) .. controls (97.9470,49.1240) and (95.9760,48.6600) ..
(94.2380,47.8720) .. controls (92.4520,47.0370) and (90.4350,46.5500) ..
(88.3470,46.5500) .. controls (86.2380,46.5500) and (84.2200,47.0370) ..
(82.4350,47.8720) .. controls (80.6720,48.6600) and (78.7240,49.1240) ..
(76.6840,49.1240) .. controls (74.6660,49.1240) and (72.6950,48.6600) ..
(70.9560,47.8720) .. controls (69.1710,47.0370) and (67.1530,46.5500) ..
(65.0430,46.5500) .. controls (62.9560,46.5500) and (60.9390,47.0370) ..
(59.1530,47.8720) .. controls (57.3910,48.6600) and (55.4430,49.1240) ..
(53.4030,49.1240) .. controls (51.3620,49.1240) and (49.4140,48.6600) ..
(47.6740,47.8720) .. controls (45.8890,47.0370) and (43.8710,46.5500) ..
(41.7620,46.5500) .. controls (39.6520,46.5500) and (37.6570,47.0370) ..
(35.8720,47.8720) .. controls (34.1100,48.6600) and (32.1620,49.1240) ..
(30.1220,49.1240) .. controls (28.0820,49.1240) and (26.1570,48.6600) ..
(24.4170,47.8720) .. controls (22.6080,47.0370) and (20.6140,46.5500) ..
(18.5040,46.5500) .. controls (16.3940,46.5500) and (14.4000,47.0370) ..
(12.5910,47.8720) .. controls (10.8520,48.6600) and (8.9040,49.1240) ..
(6.8630,49.1240) -- (6.8630,40.5210) .. controls (8.9040,40.5210) and
(10.8510,40.0570) .. (12.5910,39.2680) .. controls (14.4000,38.4570) and
(16.3940,37.9700) .. (18.5040,37.9700) .. controls (20.6140,37.9700) and
(22.6080,38.4570) .. (24.4170,39.2680) .. controls (26.1560,40.0570) and
(28.0810,40.5210) .. (30.1220,40.5210) .. controls (32.1630,40.5210) and
(34.1100,40.0570) .. (35.8720,39.2680) .. controls (37.6570,38.4570) and
(39.6520,37.9700) .. (41.7620,37.9700) .. controls (43.8710,37.9700) and
(45.8890,38.4570) .. (47.6740,39.2680) .. controls (49.4130,40.0570) and
(51.3620,40.5210) .. (53.4030,40.5210) .. controls (55.4430,40.5210) and
(57.3910,40.0570) .. (59.1530,39.2680) .. controls (60.9380,38.4570) and
(62.9560,37.9700) .. (65.0430,37.9700) .. controls (67.1530,37.9700) and
(69.1710,38.4570) .. (70.9560,39.2680) .. controls (72.6940,40.0570) and
(74.6660,40.5210) .. (76.6840,40.5210) .. controls (78.7240,40.5210) and
(80.6720,40.0570) .. (82.4350,39.2680) .. controls (84.2200,38.4570) and
(86.2380,37.9700) .. (88.3470,37.9700) .. controls (90.4350,37.9700) and
(92.4510,38.4570) .. (94.2380,39.2680) .. controls (95.9760,40.0570) and
(97.9470,40.5210) .. (99.9880,40.5210) -- (99.9880,49.1240) -- cycle;
\protect\path[fill=gray!30] (76.5680,13.1940) -- (93.4960,14.5150) -- (92.2210,5.8660)
-- (79.7910,4.9850) .. controls (76.4300,4.8230) and (76.9160,8.1850) ..
(76.9160,8.1850) -- (76.5680,13.1940) -- cycle;
\protect\path[fill=gray!30] (45.1720,11.2230) .. controls (48.2790,11.2230) and
(50.7830,8.7190) .. (50.7830,5.6120) .. controls (50.7830,2.5050) and (48.2790,0.0000) .. (45.1720,0.0000) .. controls (42.0650,0.0000) and (39.5610,2.5050) ..
(39.5610,5.6120) .. controls (39.5610,8.7190) and (42.0640,11.2230) ..
(45.1720,11.2230) -- cycle;
\protect\path[fill=gray!30] (10.5290,32.8460) .. controls (11.2480,32.6380) and (11.9440,32.3600) ..
(12.5930,32.0580) .. controls (14.4020,31.2230) and (16.3960,30.7360) ..
(18.5060,30.7360) .. controls (20.6160,30.7360) and (22.6100,31.2230) ..
(24.4190,32.0580) .. controls (26.1580,32.8460) and (28.0830,33.3100) ..
(30.1240,33.3100) .. controls (32.1650,33.3100) and (34.1120,32.8460) ..
(35.8740,32.0580) .. controls (37.6590,31.2230) and (39.6540,30.7360) ..
(41.7640,30.7360) .. controls (43.8730,30.7360) and (45.8910,31.2230) ..
(47.6760,32.0580) .. controls (49.4150,32.8460) and (51.3640,33.3100) ..
(53.4050,33.3100) .. controls (55.4450,33.3100) and (57.3930,32.8460) ..
(59.1550,32.0580) .. controls (60.9400,31.2230) and (62.9580,30.7360) ..
(65.0450,30.7360) .. controls (67.1550,30.7360) and (69.1730,31.2230) ..
(70.9580,32.0580) .. controls (72.6960,32.8460) and (74.6680,33.3100) ..
(76.6860,33.3100) .. controls (78.7260,33.3100) and (80.6740,32.8460) ..
(82.4370,32.0580) .. controls (84.2220,31.2230) and (86.2400,30.7360) ..
(88.3490,30.7360) .. controls (90.4370,30.7360) and (92.4530,31.2230) ..
(94.2400,32.0580) .. controls (95.9780,32.8460) and (97.9270,33.3100) ..
(99.9670,33.3100) -- (98.0660,17.9710) -- (27.6910,12.0810) --
(38.3110,1.3680) -- (33.6500,0.9510) -- (23.0500,11.6870) -- (0.0010,9.7860)
.. controls (-0.1380,17.6460) and (8.6270,30.7130) .. (10.5290,32.8460) --
(10.5290,32.8460) -- cycle;
\protect\end{tikzpicture}}
~}
\newcommand*\drawitem[6]%
{%
\ifnum#1=0
\edef\mylist{}
\else
\ifnum#1=1
\edef\mylist{0,1}
\else
\edef\mylist{1,...,#1}
\fi
\foreach \x in \mylist
{\draw[color=#4, xscale=0.5,yscale=0.5] (#2)
node[draw=none, xshift=-\x*0.20cm + #6, yshift=#5, font=\small] (s\x) {\tiny{#3}};}
\fi
}
% \usepackage{fontawesome5}
\begin{document}
\tikzset{
pics/can_mission/.style args={#1/#2/#3/#4/#5}{
code = {
\node[river,draw=none] (root) {
\nodepart{one}
\nodepart[color=blue, draw=none]{two}
\ifthenelse{\equal{\detokenize{#3}}{\detokenize{left}}}
{ {\myboatleft} }
{ {\myboatright} }
\nodepart{three}
};
% Cannibals left, implementation using ifthenelse, kept for reference
%\ifthenelse{\equal{#1}{0}}
%{\foreach \x in {}}
%{ \ifthenelse{\equal{#1}{1}}
% {\foreach \x in {0,1}}
% {\foreach \x in {1,...,#1}}
%}
% Cannibals left
\drawitem{#1}{root.one}{\faHandScissorsO}{red}{0.15cm}{0cm};
% Missionaries left
\drawitem{#2}{root.one}{\faHandPaperO}{green}{-0.15cm}{0cm};
% Cannibals right
\drawitem{#4}{root.three}{\faHandScissorsO}{red}{0.15cm}{0.45cm};
% Missionaries right
\drawitem{#5}{root.three}{\faHandPaperO}{green}{-0.15cm}{0.45cm};
}
},
% Adding cannibals and missionaries background
river/.style={rotate=90, rectangle split, minimum width= 1 cm, rectangle split parts=3,draw, anchor=center, rectangle split part fill={white!60,blue!60,white!60}},
}
\begin{tikzpicture}[draw=none]
\draw pic {can_mission=3/3/right/3/3};
\hfill \break
\end{tikzpicture}
\end{document}\documentclass{standalone}
\usepackage{tikz}
\usetikzlibrary{shapes.multipart}
\usetikzlibrary{positioning}
\tikzset{
chromosome/.style 2 args={
rectangle split ,
rectangle split parts=2,
rectangle split horizontal,
rectangle split part fill={#1,#2},
draw=black, very thick,
minimum height=2.5em,
text width=3.0cm,
inner sep=2pt,
text centered,
}
}
\begin{document}
\begin{tikzpicture}
%% Rectangles
% Set of Parents
\node [chromosome={blue!15}{red!20}] (a) { \nodepart{two} } ;
\node [chromosome={yellow!30}{green!20}, right = of a] (b) { \nodepart{two} } ;
% Set of Children
\node [chromosome={blue!15}{yellow!30}, below = 2 cm of a] (c) { \nodepart{two} } ;
\node [chromosome={red!20}{green!20}, right = of c] (d) { \nodepart{two} } ;
% Labels
\node[right = of b] () {\textbf{Set of Parents}};
\node[right = of d] () {\textbf{Set of Children}};
% Paths
\path [->, very thick] (a.one south) edge[] node {}(c.one north);
\path [->, very thick] (a.two south) edge[out=-90, in=90] node {}(d.one north);
\path [->, very thick] (b.one south) edge[out=-90, in=90] node {}(c.two north);
\path [->, very thick] (b.two south) edge[] node {}(d.two north);
\end{tikzpicture}
\end{document}\documentclass[margin=3pt]{standalone}
\usepackage[utf8]{inputenc}
\usepackage{tikz}
\usetikzlibrary{arrows,shadows,positioning}
\tikzset{
frame/.style={
rectangle, draw,
text width=6em, text centered,
minimum height=4em,drop shadow,fill=yellow!40,
rounded corners,
},
line/.style={
draw, -latex',rounded corners=3mm,
}
}
\begin{document}
\begin{tikzpicture}[font=\small\sffamily\bfseries,very thick,node distance = 4cm]
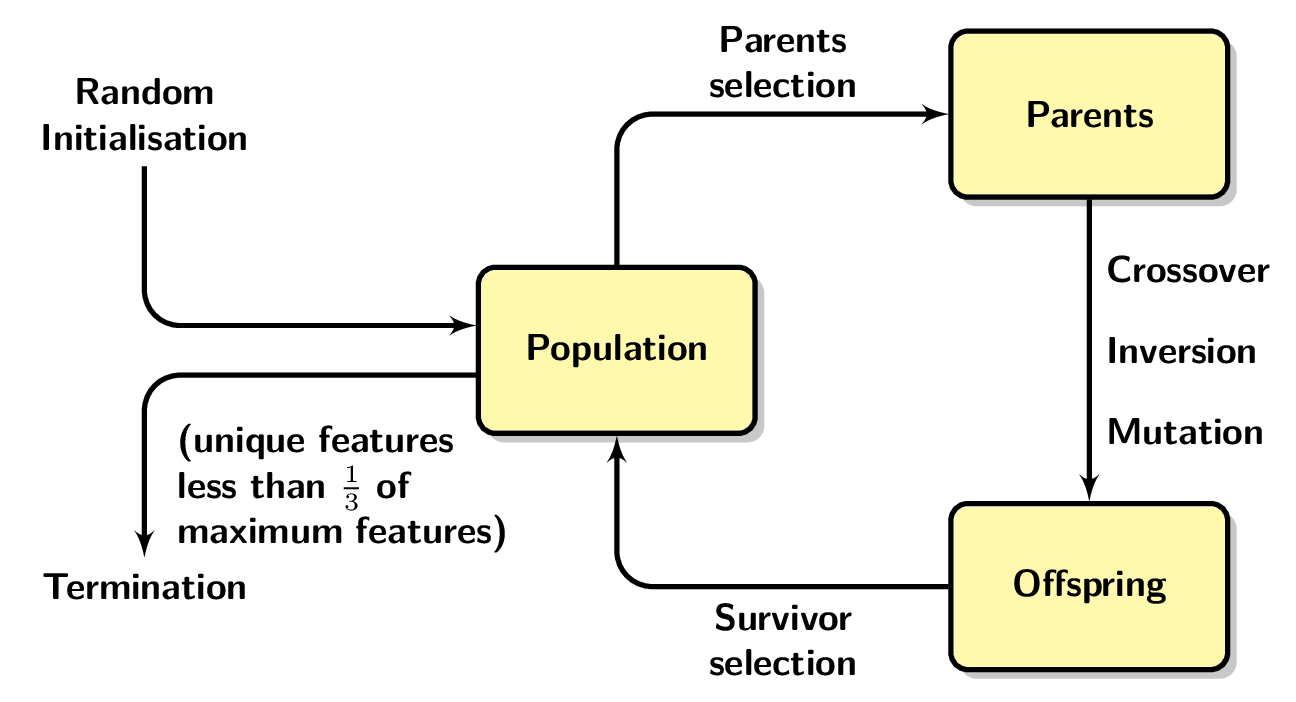
\node [frame] (pop) {Population};
\node [above=2cm, text width=2cm, align=center, left of=pop] (init) {Random \\ Initialisation};
\node [below=2cm, text width = 2cm, align = center, left of=pop] (term) {Termination};
\node [frame, above=2cm, right of=pop] (parents) {Parents};
\node [frame, below=2cm, right of=pop] (off) {Offspring};
% termination condition label
\node [draw=none, text width=3cm, above right = -0.1cm and -1cm of term ] () {(unique features \\ less than $\frac{1}{3}$ of \\ maximum features)};
\path [line] (parents)
-- node[right,align=left,pos=.5] {Crossover\\[3mm]Inversion\\[3mm]Mutation}
(off);
\path [line] (init) |- (pop.170);
\path [line] (pop.190) -| (term);
\path [line] (off) -| node[below,pos=.25, align=center] {Survivor\\ selection}(pop);
\path [line] (pop) |- node[above,pos=.75, align=center] {Parents\\ selection}(parents);
\end{tikzpicture}
\end{document}\documentclass{standalone}
\usepackage[margin=1.0in]{geometry}
\usepackage{tikz}
\usetikzlibrary{arrows,shapes,positioning}
\begin{document}
\tikzstyle{decision}=[diamond, draw, fill=yellow!20,
text width=4em, text badly centered, node distance=3cm,
inner sep=0pt]
\tikzstyle{block}=[rectangle, draw, fill=blue!20,
text width=8em, text badly centered, rounded corners,
minimum height=4em]
\tikzstyle{line}=[draw, very thick, color=black!75, -latex']
\tikzstyle{path}=[draw, very thick, color=black!75, -]
\begin{tikzpicture}[node distance=2cm, auto]
% Place nodes
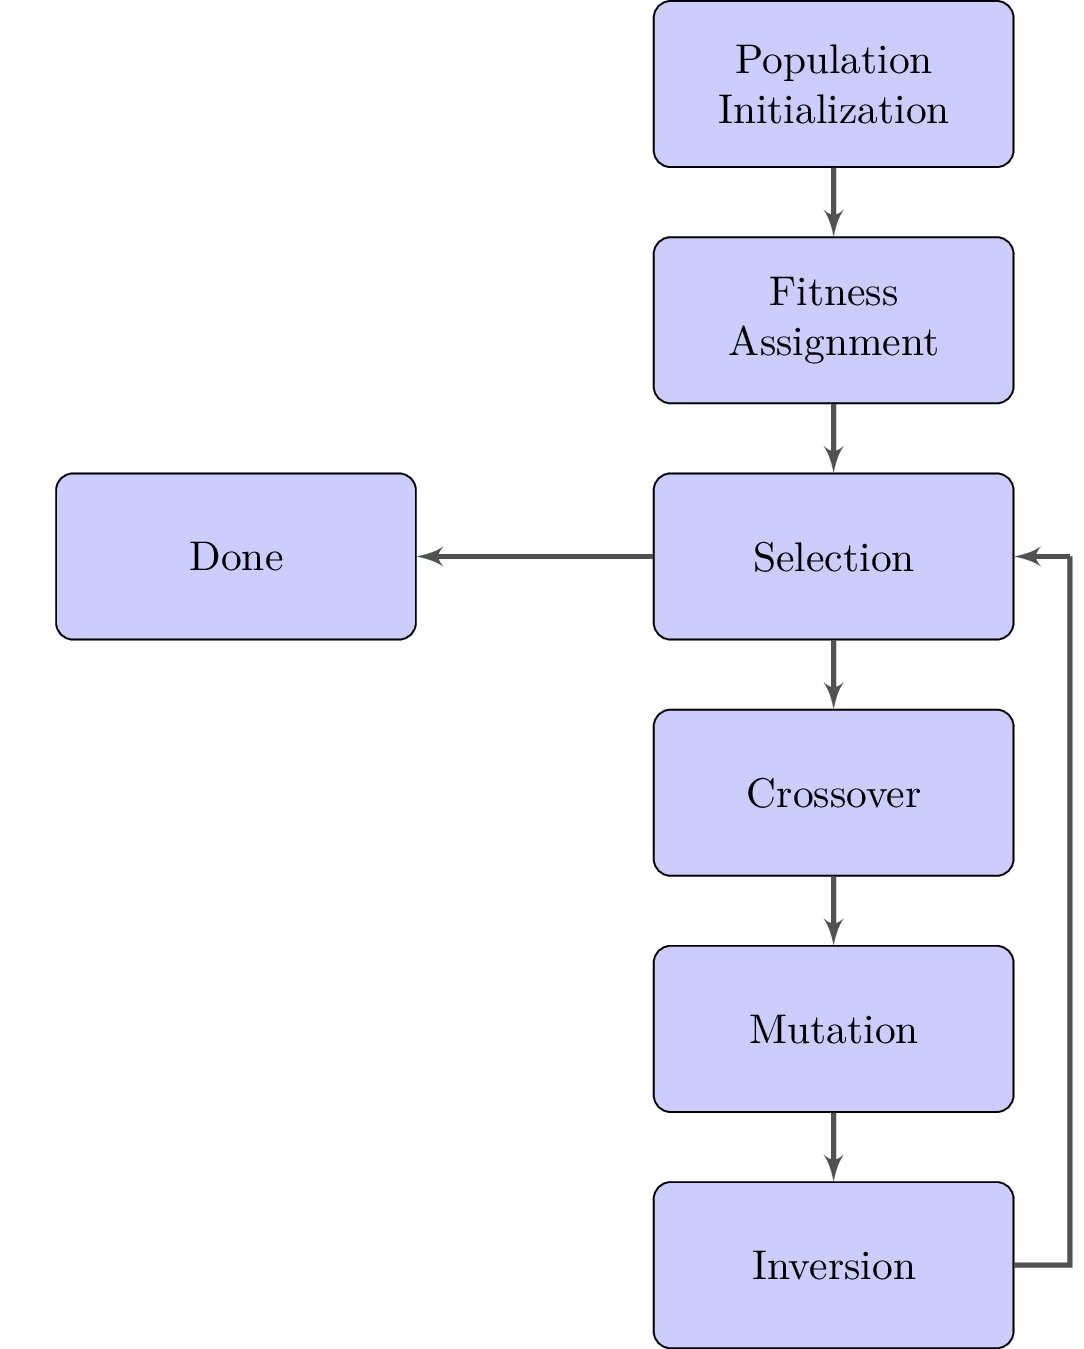
\node [block] (pop_init) {Population Initialization};
\node [block, below of=pop_init] (fit_ass)
{Fitness Assignment};
\node [block, below of=fit_ass] (selection)
{Selection};
\node [draw=none, right of=selection] (pointer)
{};
\node [block, below of=selection] (crossover)
{Crossover};
\node [block, below of=crossover] (mutation)
{Mutation};
\node [block, below of=mutation] (inversion)
{Inversion};
\node [block, left = 2cm of selection] (done)
{Done};
% Draw edges
\path [line] (pop_init) -- (fit_ass);
\path [line] (fit_ass) -- (selection);
\path [line] (selection) -- (crossover);
\path [line] (crossover) -- (mutation);
\path [line] (mutation) -- (inversion);
\path [path] (inversion) -| (pointer.center);
\path [line] (pointer.center) -- (selection);
\path [line] (selection) -- (done);
\end{tikzpicture}
\end{document}\documentclass[tikz]{standalone}
\usepackage[T1]{fontenc}
\usepackage{lmodern}
\usepackage{microtype}
\begin{document}
\begin{tikzpicture}
\node[draw=none, text width=3.5cm] at (0, 0) (start) {Parent 1: \textls[100]{1324421} \hfill \newline Parent 2: \textls[100]{2751421}};
\draw[thick,dashed] (0.45,0.5) -- (0.45,-0.5);
\draw[->] (1.5, 0) -- (3, 0) node[below,midway] {crossover};
\node[draw=none, text width=3.5cm] at (4.9, 0) (start) {Parent 1: \textls[100]{1321421} \hfill \newline Parent 2: \textls[100]{2754421}};
\draw[thick,dashed] (5.35,0.5) -- (5.35,-0.5);
% \node[draw=none, text width=3cm] at (3.5, 0) (start) {Parent 2: 2754421};
\end{tikzpicture}
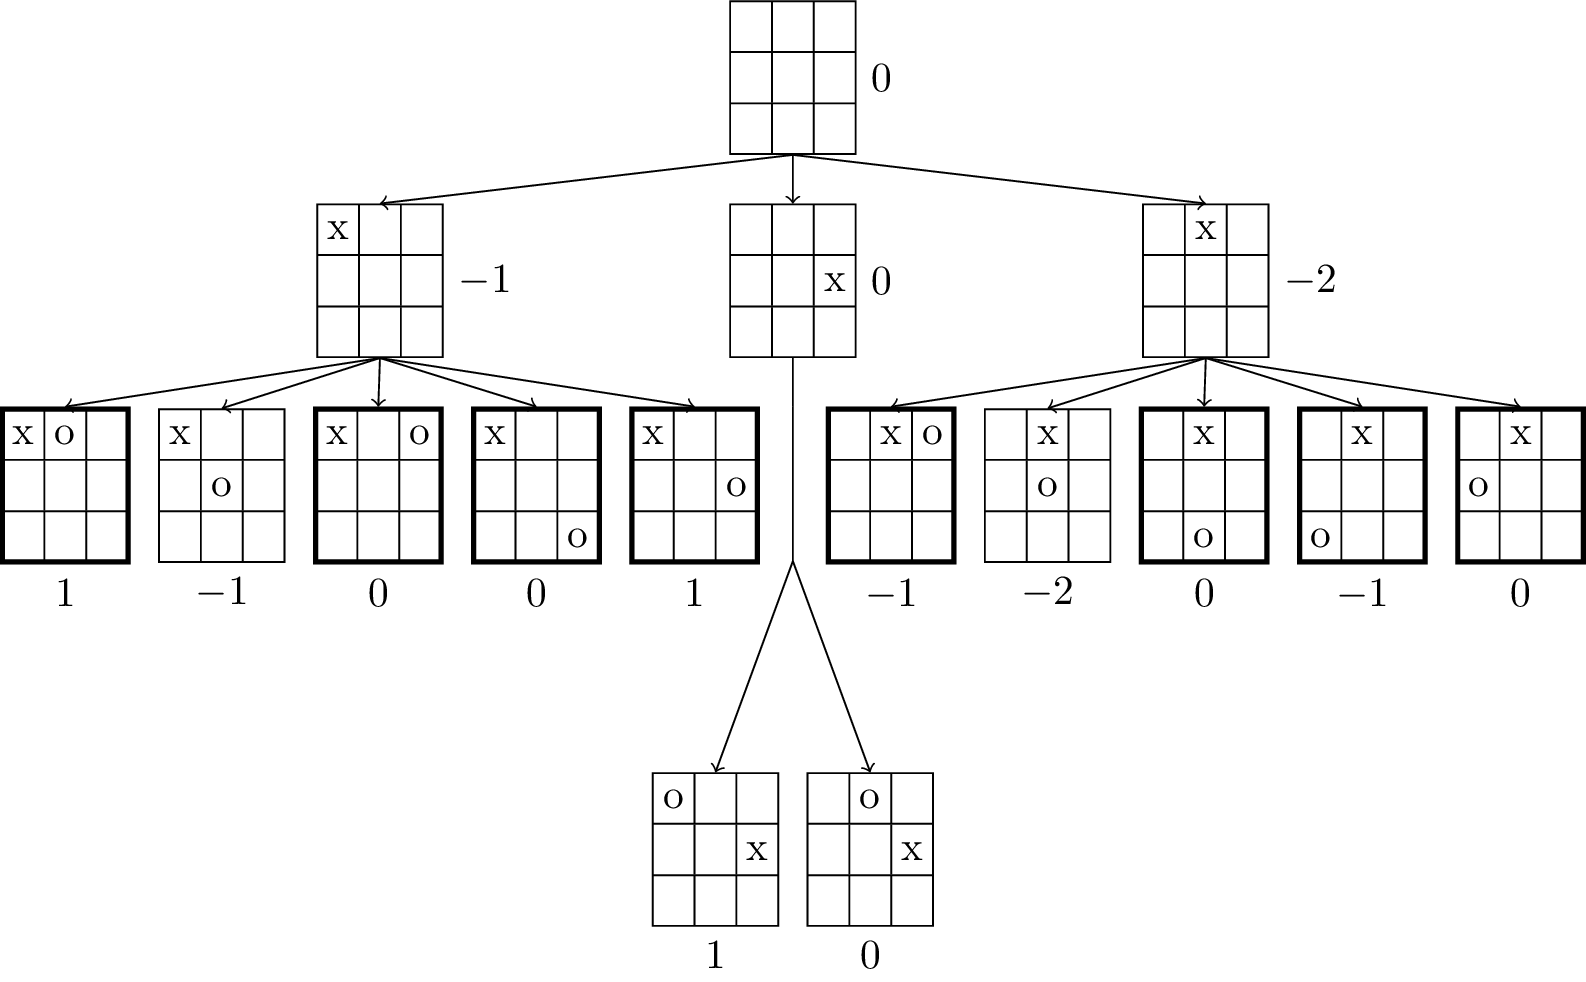
\end{document}\documentclass[tikz]{standalone}
\usepackage{forest,calc}
\forestset{
make tab/.style args={#1:#2:#3/#4:#5:#6/#7:#8:#9}{%
content={%
\tabcolsep=.4\tabcolsep
\begin{tabular}{p{\widthof{x}}|p{\widthof{x}}|p{\widthof{x}}}
#1 & #2 & #3\\\hline#4\\\hline#7	
\end{tabular}}},
label position r/.initial=right,
label position b/.initial=below
}
\begin{document}
\begin{forest}
TTT/.style args={#1:#2}{
make tab/.expanded=\forestove{content},
label={\pgfkeysvalueof{/forest/label position #1}:$#2$},
edge={->}
},
TTT*/.style={
make tab=::/::/::,
content/.expand once=%
\expandafter\vphantom\expandafter{\romannumeral-`0\forestov{content}},
draw=none,
append after command={(\tikzlastnode.north) edge (\tikzlastnode.south)},
for descendants={before computing xy={l*=1.8}},
},
th/.style=very thick,
for tree={node options=draw, inner sep=+0pt, parent anchor=south, child anchor=north}
%
[::/::/::, TTT=r:0
[x::/::/::, TTT=r:-1
[x:o:/::/::, TTT=b: 1, th]
[x::/:o:/::, TTT=b:-1]
[x::o/::/::, TTT=b: 0, th]
[x::/::/::o, TTT=b: 0, th]
[x::/::o/::, TTT=b: 1, th]
]
[::/::x/::, TTT=r:0,
[,TTT* % this is just cheating :(
[o::/::x/::, TTT=b:1]
[:o:/::x/::, TTT=b:0]
]
]
[:x:/::/::, TTT=r:-2
[:x:o/::/::, TTT=b:-1, th]
[:x:/:o:/::, TTT=b:-2]
[:x:/::/:o:, TTT=b: 0, th]
[:x:/::/o::, TTT=b:-1, th]
[:x:/o::/::, TTT=b: 0, th]
]
]
\end{forest}
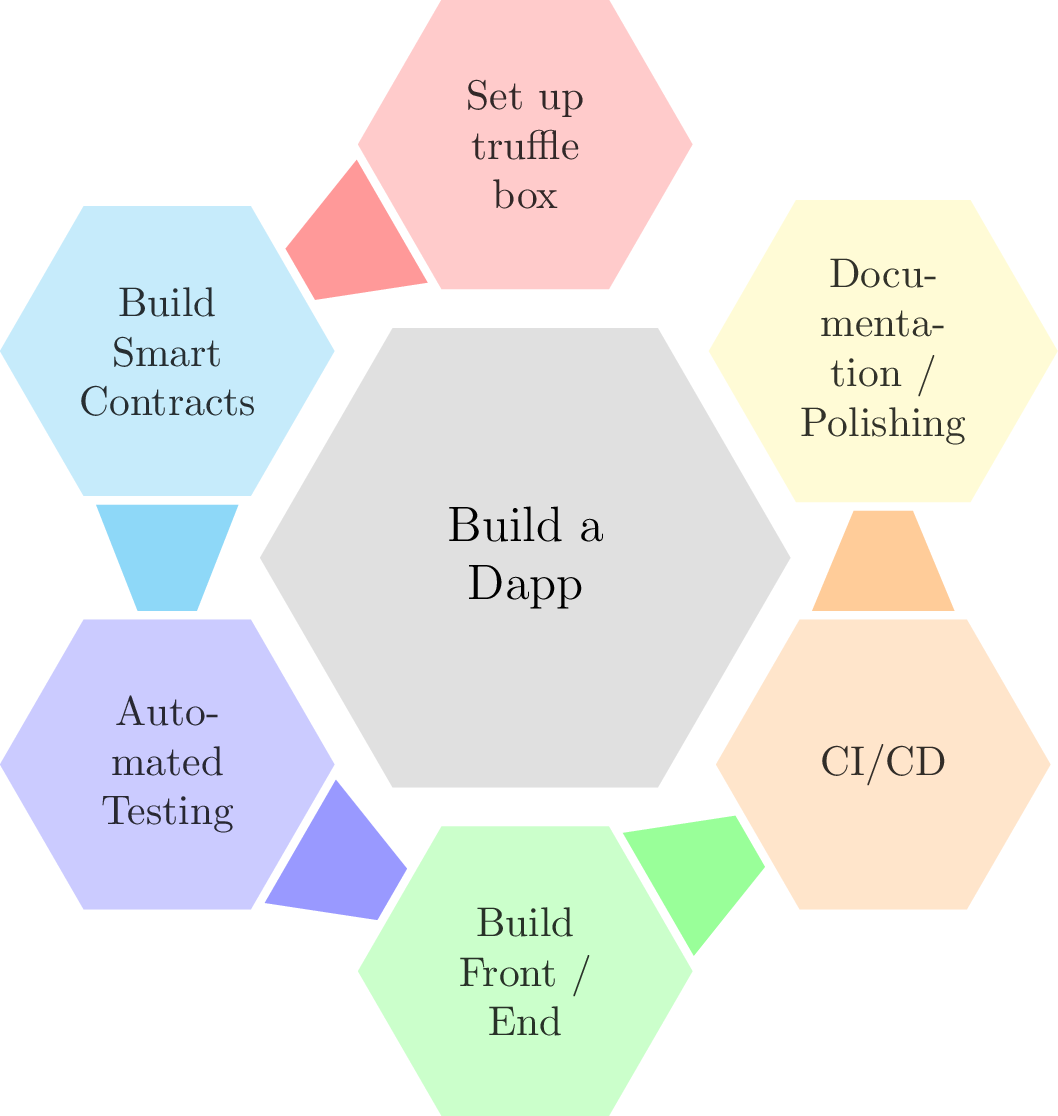
\end{document}\documentclass[tikz]{standalone}
\usepackage{smartdiagram}
\usetikzlibrary{shapes.geometric,calc}
\begin{document}
\tikzset{
planet/.append style={regular polygon, regular polygon sides=6},
satellite/.append style={regular polygon, regular polygon sides=6},
every picture/.append style={rotate=30},
connection planet satellite/.style={
bend right/.style=,
every edge/.style={fill=\col},
to path={
\pgfextra
\path[draw=none, fill=none] (\tikztostart)
-- coordinate[at start] (@start@) coordinate[at end] (@target@) (\tikztotarget);
\endpgfextra
\ifnum\xi<\maxsmitem % to disable the last arrow
($(@start@)!.6cm!90:(@target@)$) -- ($(@target@)!.25cm!-90:(@start@)$)
-- ($(@target@)!.25cm!90:(@start@)$) -- ($(@start@)!.6cm!-90:(@target@)$)
-- cycle
\fi}}}
\smartdiagram[connected constellation diagram]{
Build a Dapp,
Set up truffle box,
Build Smart Contracts,
Automated Testing,
Build Front /\\ End,
CI/CD,
Documentation / \\ Polishing}
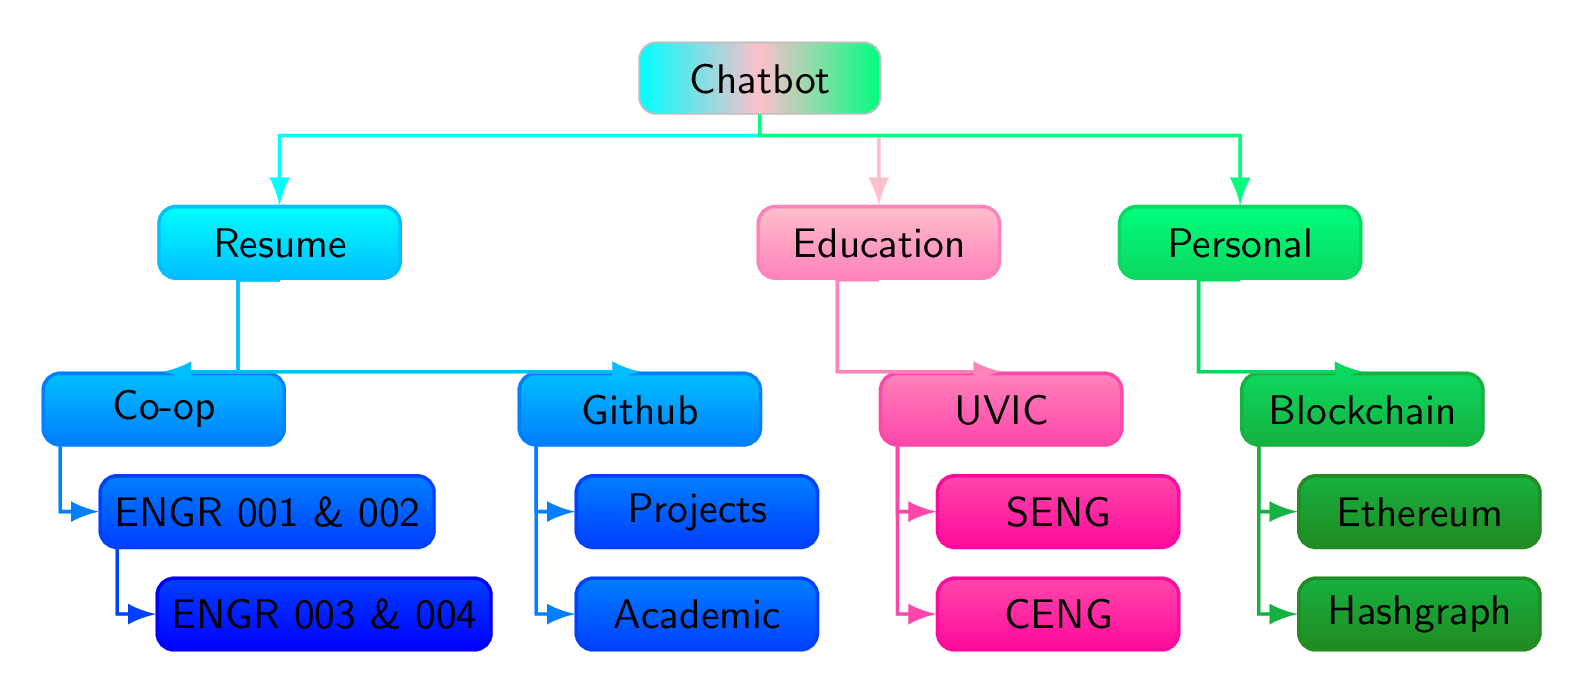
\end{document}% Decision Tree for conversation
\documentclass[border=10pt,multi,tikz,dvipsnames,svgnames,rgb]{standalone}
\usepackage[edges]{forest}
\usetikzlibrary{arrows.meta}
\forestset{
declare dimen register=gap,
gap'=10mm,
declare count register=twist,
twist'=2,
family tree/.style={
forked edges,
for tree={
rounded corners,
minimum width/.wrap pgfmath arg={##1}{(\textwidth-6*(gap))/3},
minimum height=4ex,
edge={-Latex},
font=\sffamily,
text centered,
% blur shadow,
edge=thick,
},
where={level()<(twist)}{%
parent anchor=children,
l sep+=10pt,
s sep'+=10pt,
}{%
folder,
grow'=0,
l sep'+=2pt,
if={level()==(twist)}{%
before typesetting nodes={child anchor=north},
!u.s sep'+=10pt,
edge path'={%
(!u.parent anchor) -- ++(0,-10pt) -| (.child anchor)
},
}{},
},
},
branch shade/.style args={from #1 to #2}{
before typesetting nodes={
tempcountc/.max={level}{current,tree},
tempcountb/.option=level,
tempcounta=(tempcountc)-(tempcountb)+1,
temptoksa/.option=name,
TeX/.wrap pgfmath arg={
\colorlet{##1col1}{#1}
\colorlet{##1col2}{#2}
}{name()},
for tree={
rounded corners,
top color/.wrap 2 pgfmath args={##2col2!##1!##2col1}{100*((level()-(tempcountb))/(tempcounta))}{(temptoksa)},
+edge/.wrap 2 pgfmath args={##2col2!##1!##2col1}{100*((level()-(tempcountb))/(tempcounta))}{(temptoksa)},
bottom color/.wrap 2 pgfmath args={##2col2!##1!##2col1}{100*((level()-(tempcountb)+1)/(tempcounta))}{(temptoksa)},
draw/.wrap 2 pgfmath args={##2col2!##1!##2col1}{100*((level()-(tempcountb)+1)/(tempcounta))}{(temptoksa)},
thick,
},
}
},
}
\begin{document}
\begin{forest}
family tree,
[Chatbot, left color=cyan, right color=SpringGreen, middle color=Pink, draw=Silver
[Resume, branch shade=from cyan to blue
[Co-op
[ENGR 001 \& 002
[ENGR 003 \& 004]
]
]
[Github
[Projects]
[Academic]
]
]
[Education, branch shade=from Pink to WildStrawberry
[UVIC
[SENG]
[CENG]
]
]
[Personal, branch shade=from SpringGreen to ForestGreen
[Blockchain
[Ethereum]
[Hashgraph]
]
]
]
\end{forest}
%\begin{forest}
% family tree,
% [Grandparent, fill=darkgray, text=Silver, double=Silver, draw=darkgray
% [Parent 1, branch shade=from blue!80 to blue!20
% [Child 1
% [Grandchild 1]
% ]
% ]
% [Parent 2, branch shade=from WildStrawberry!80 to WildStrawberry!20
% [Child 2
% [Grandchild 2]
% ]
% ]
% [Parent 3, branch shade=from ForestGreen!80 to ForestGreen!20
% [Child 3
% [Grandchild 3]
% ]
% ]
% ]
%\end{forest}
\end{document}
%%%%%%%%%%%%%%%%%%%%%%%%%%%%%%%%%%%%%%%%%%%%%%%
%\documentclass[border=10pt]{standalone}
%\usepackage{tikz}
%\usepackage{forest}
%\begin{document}
%\begin{forest}
% roundish filling/.style={%
% draw=#1,
% inner color=#1!25,
% outer color=#1,
% },
% for tree={%
% double,
% rounded corners,
% },
% where level=0{% for the root node
% minimum size=20pt,
% roundish filling=red,
% ultra thick,
% }{%
% if level=1{% middle nodes
% minimum size=15pt,
% semithick,
% roundish filling=blue!50!cyan,
% }
% {% remaining nodes
% delay={%
% if n children=0{%
% label/.wrap pgfmath arg={-90:#1}{content},
% !u.s sep'+=5pt,
% !uu.s sep'+=10pt,
% content=,
% }{},
% },
% green!75!black,
% circle,
% fill,
% fill opacity=.5,
% draw opacity=1,
% draw,
% minimum size=5pt,
% inner sep=0pt,
% },
% },
% [ChatBot
% [B [C][Ch]]
% [D [Dd][E][F][Ff [black]]]
% ]
%\end{forest}
%\end{document}
%%%%%%%%%%%%%%%%%%%%%%%%%%%%%%%%%%%%%%%%%%%
% Reference Decision tree
% Author: Stefan Kottwitz
% https://www.packtpub.com/hardware-and-creative/latex-cookbook
%\documentclass[border=10pt]{standalone}
%\usepackage{tikz}
%\tikzset{
% treenode/.style = {shape=rectangle, rounded corners,
% draw, align=center,
% top color=white, bottom color=blue!20},
% root/.style = {treenode, font=\Large, bottom color=red!30},
% env/.style = {treenode, font=\ttfamily\normalsize},
% dummy/.style = {circle,draw}
%}
%\begin{document}
%\begin{tikzpicture}
% [
% grow = down,
% sibling distance = 6em,
% level distance = 10em,
% edge from parent/.style = {draw, -latex},
% every node/.style = {font=\footnotesize},
% sloped
% ]
% \node [root] {Formula}
% child { node [env] {equation}
% edge from parent node [below] {single-line?} }
% child { node [dummy] {}
% child { node [dummy] {}
% child { node [env] {align\\flalign}
% edge from parent node [above] {at relation sign?} }
% child { node [env] {alignat}
% edge from parent node [above] {at several}
% node [below] {places?} }
% child { node [env] {gather}
% edge from parent node [above] {centered?} }
% edge from parent node [below] {aligned?} }
% child { node [env] {multline}
% edge from parent node [above, align=center]
% {first left,\\centered,}
% node [below] {last right}}
% edge from parent node [above] {multi-line?} };
%\end{tikzpicture}
%\end{document}\documentclass{standalone}
\usepackage{xcolor}
\usepackage{tabu}
\usepackage{colortbl}
\begin{document}
\taburowcolors[2]{orange .. black!20}
\sffamily\footnotesize
\tabulinesep=6pt
\begin{tabu}{|>{\cellcolor{orange!60}\color{black}}r|X[cm]|X[cm]|X[cm]|}
\hline
\rowcolor{black!80}\strut & \color{black}Travis CI & \color{black} GitLab CI & \color{black} CircleCI \\
Docker Images & \color{black}No & \color{black}Yes & \color{black}Yes \\
Private Builds & Yes (Education) & Yes & Yes \\
Easy To Use & \color{black}Yes & \color{black}Yes & \color{black}Yes \\
\hline
\end{tabu}
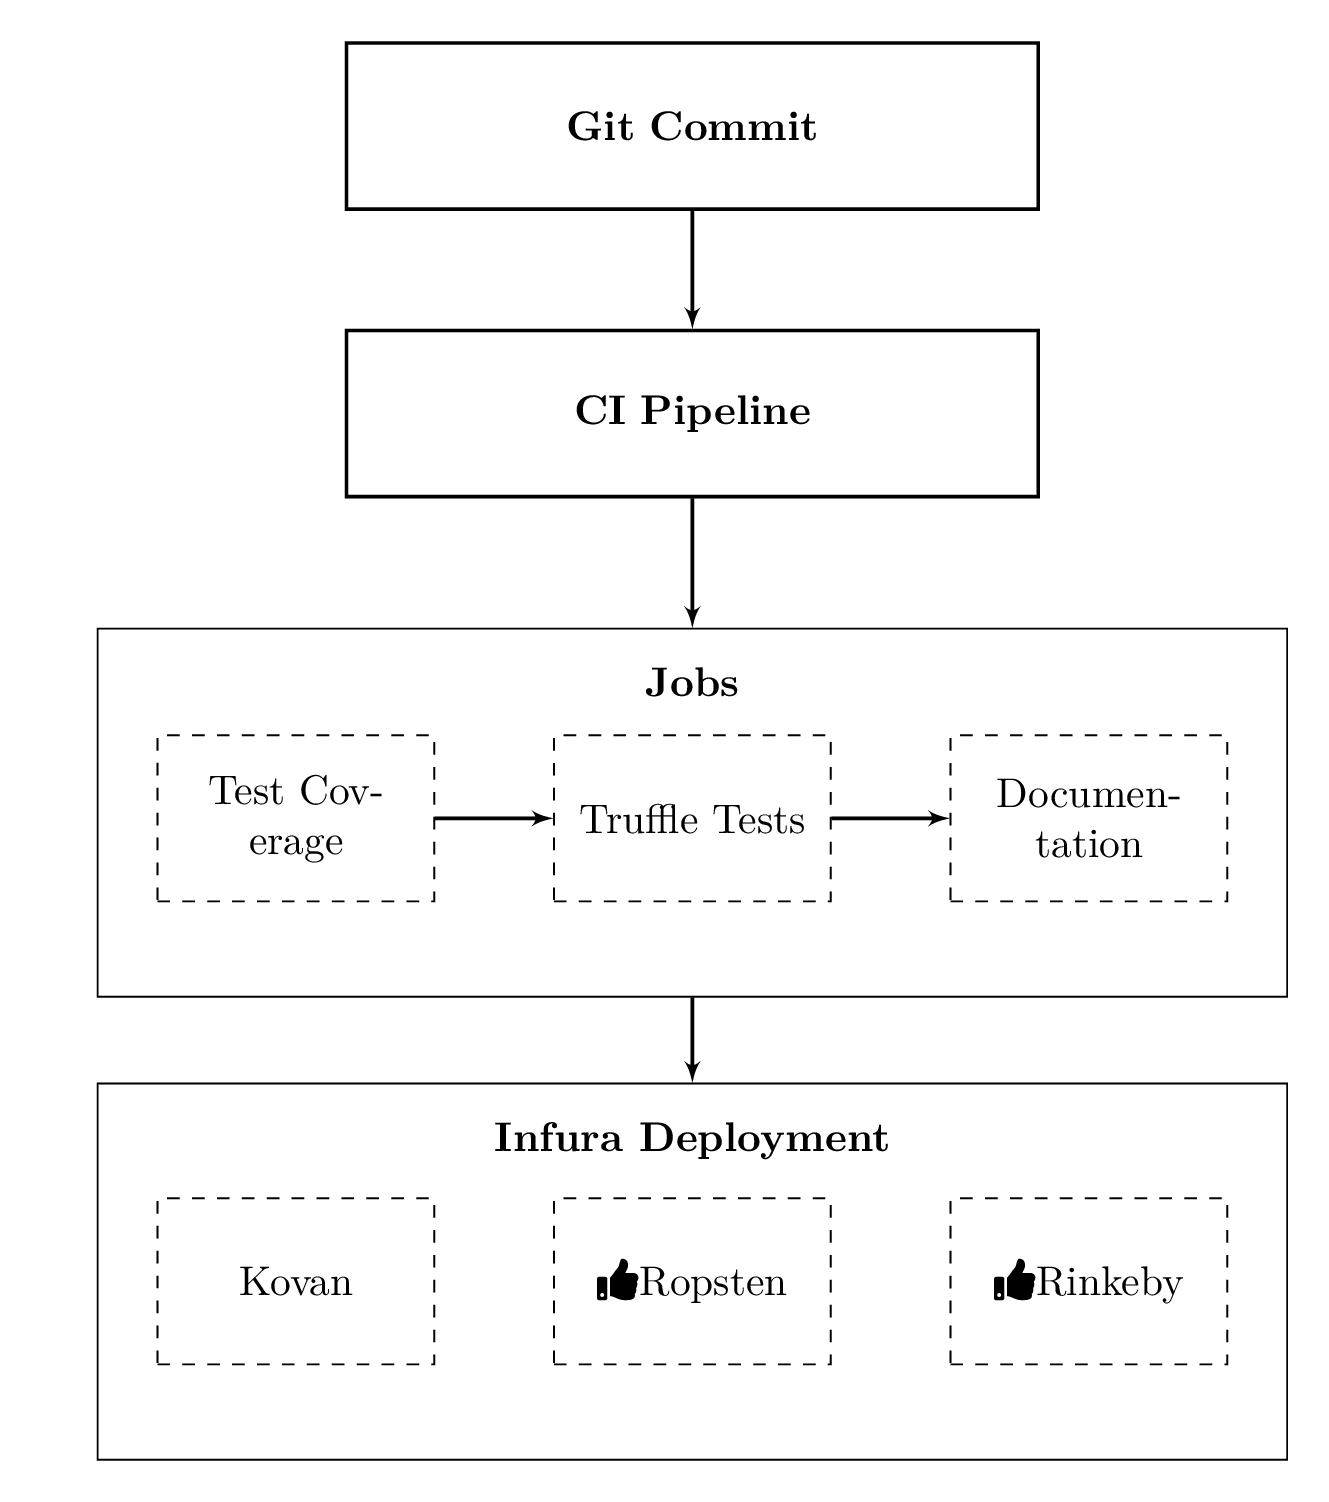
\end{document}\documentclass[border=10pt]{standalone}
\usepackage{fontawesome5}
\usepackage{tikz}
\usetikzlibrary{fit,arrows,calc,positioning}
\begin{document}
\tikzstyle{block} = [rectangle, draw, fill=white,text width=16em, text centered, minimum height=4em, thick]
\tikzstyle{blks} = [rectangle, draw, fill=white, text width=6em, text centered, minimum height=4em, dashed]
\tikzstyle{big} = [rectangle, draw, inner sep=0.5cm]
\tikzstyle{line} = [draw, -latex',thick]
\begin{tikzpicture}[auto]
\node [block](exe) {\textbf{Git Commit}};
\node [block, below=of exe] (mgm) {\textbf{CI Pipeline}};
\node [blks, below=2cm of mgm] (fin) {Truffle Tests};
\node [blks, right=of fin] (prod) {Documentation};
\node [blks, left=of fin] (resch) {Test Coverage};
\node[above =0.2cm of fin] (A) {\textbf{Jobs}};
\node [below = 0.3 of mgm, big,fit=(fin) (prod)(resch)(A), inner sep=0.5cm] (dept) {};
\node [blks, below=2.5cm of fin] (ropsten) {\faThumbsUp Ropsten};
\node [blks, right=of ropsten] (rinkeby) {\faThumbsUp Rinkeby};
\node [blks, left=of ropsten] (kovan) {Kovan};
\node[above =0.2cm of ropsten] (B) {\textbf{Infura Deployment}};
\node [below = 0.3 of mgm, big,fit=(ropsten) (rinkeby)(kovan)(B), inner sep=0.5cm] (infura) {};
\path [line] (exe)--(mgm);
\path [line] (mgm) -- (dept);
\path [line] (resch)--(fin);
\path [line] (fin)--(prod);
\path [line] (dept) -- (infura);
\end{tikzpicture}
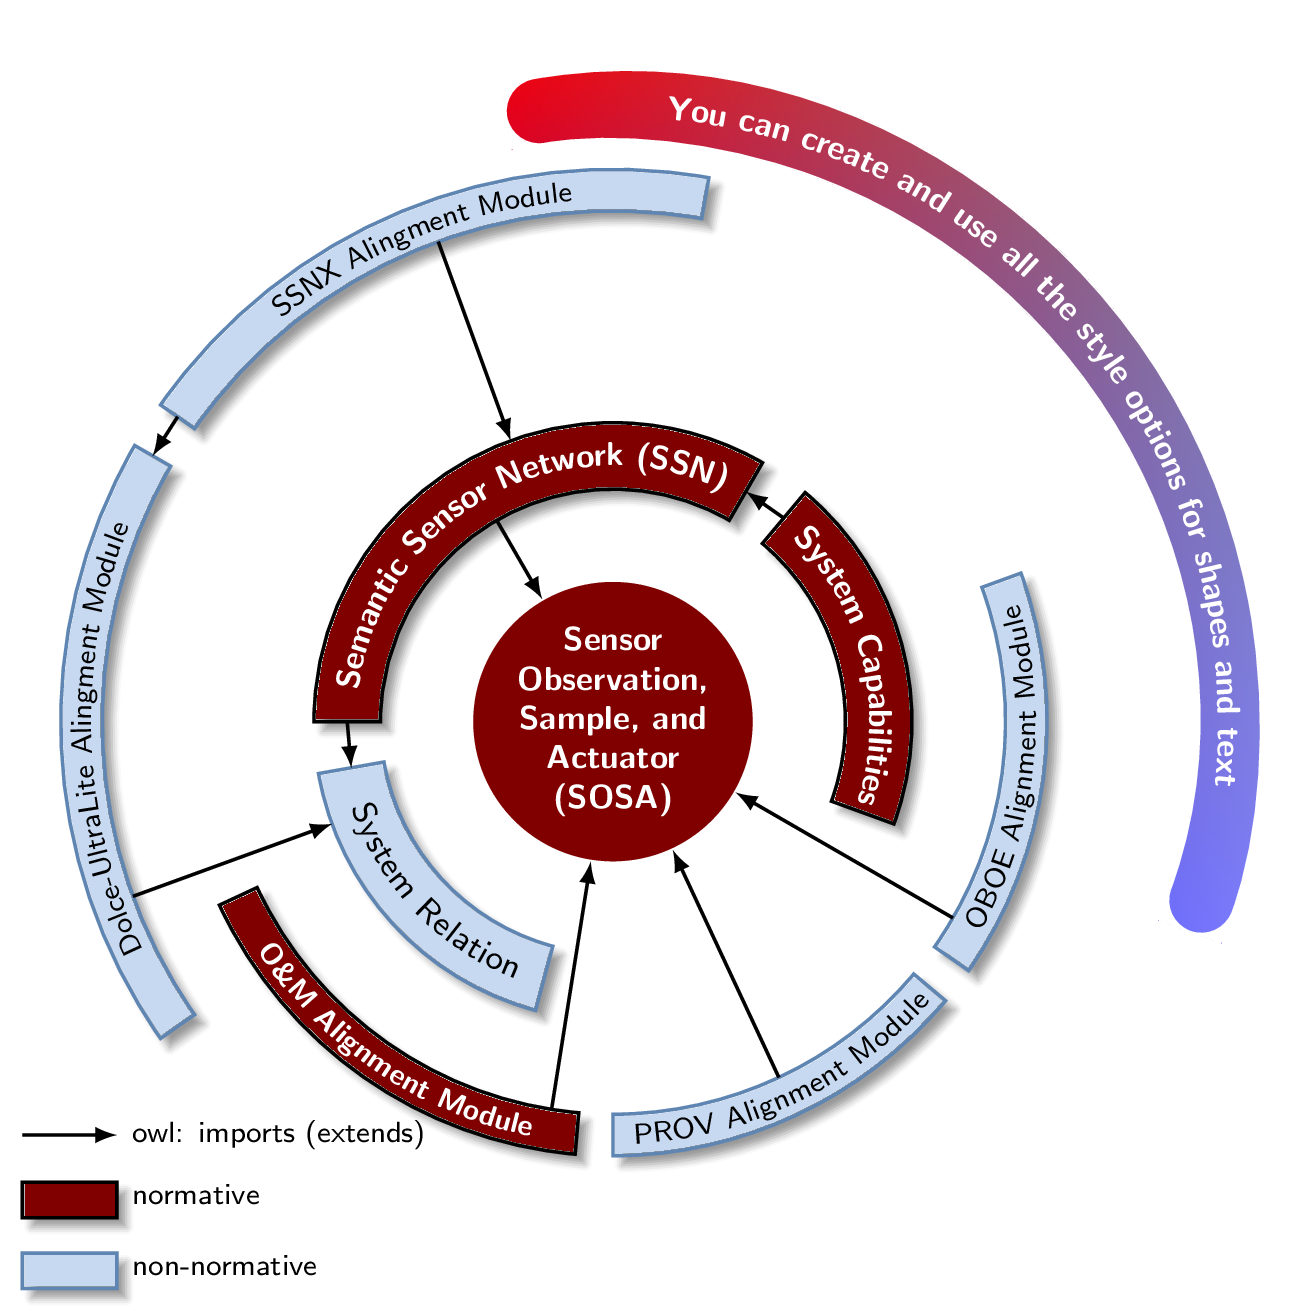
\end{document}\documentclass[border=5pt]{standalone}
\usepackage{xcolor}
\definecolor{ocre}{HTML}{800000}
\definecolor{sky}{HTML}{C6D9F1}
\definecolor{skybox}{HTML}{5F86B3}
\usepackage{tikz}
\usepackage{pgfmath}
\usetikzlibrary{decorations.text, arrows.meta,calc,shadows.blur,shadings}
\renewcommand*\familydefault{\sfdefault} % Set font to serif family
% arctext from Andrew code with modifications:
%Variables: 1: ID, 2:Style 3:box height 4: Radious 5:start-angl 6:end-angl 7:text {format along path}
\def\arctext[#1][#2][#3](#4)(#5)(#6)#7{
\draw[#2] (#5:#4cm+#3) coordinate (above #1) arc (#5:#6:#4cm+#3)
-- (#6:#4) coordinate (right #1) -- (#6:#4cm-#3) coordinate (below right #1) arc (#6:#5:#4cm-#3) coordinate (below #1)
-- (#5:#4) coordinate (left #1) -- cycle;
\def\a#1{#4cm+#3}
\def\b#1{#4cm-#3}
\path[
decoration={
raise = -0.5ex, % Controls relavite text height position.
text along path,
text = {#7},
text align = center,
},
decorate
]
(#5:#4) arc (#5:#6:#4);
}
%arcarrow, this is mine, for beerware purpose...
%Function: Draw an arrow from arctex coordinate specific nodes to another
%Arrow start at the start of arctext box and could be shifted to change the position
%to avoid go over another box.
%Var: 1:Start coordinate 2:End coordinate 3:angle to shift from acrtext box
\def\arcarrow(#1)(#2)[#3]{
\draw[thick,->,>=latex]
let \p1 = (#1), \p2 = (#2), % To access cartesian coordinates x, and y.
\n1 = {veclen(\x1,\y1)}, % Distance from the origin
\n2 = {veclen(\x2,\y2)}, % Distance from the origin
\n3 = {atan2(\y1,\x1)} % Angle where acrtext starts.
in (\n3-#3: \n1) -- (\n3-#3: \n2); % Draw the arrow.
}
\begin{document}
\begin{tikzpicture}[
% Environment Cfg
font=\sf \scriptsize,
% Styles
myarrow/.style={
thick,
-latex,
},
Center/.style ={
circle,
fill=ocre,
text=white,
align=center,
font =\footnotesize\bf,
inner sep=1pt,
},
RedArc/.style ={
color=black,
thick,
fill=ocre,
blur shadow, %Tikzedt not suport online view
},
SkyArc/.style ={
color=skybox,
thick,
fill=sky,
blur shadow, %Tikzedt not suport online view
},
]
% Drawing the center
\node[Center](SOSA) at (0,0) { Sensor \\ Observation, \\ Sample, and \\ Actuator \\(SOSA)};
\coordinate (SOSA-R) at (0:1.2); % To make compatible with \arcarrow macro.
% Drawing the Tex Arcs
% \Arctext[ID][box-style][box-height](radious)(start-angl)(end-angl){|text-styles| Text}
\arctext[SSN][RedArc][8pt](2.25)(180)(60){|\footnotesize\bf\color{white}| Semantic Sensor Network (SSN)};
\arctext[SCap][RedArc][8pt](2.25)(50)(-20){|\footnotesize\bf\color{white}| System Capabilities};
\arctext[SRel][SkyArc][8pt](2.25)(190)(255){|\footnotesize\color{black}| System Relation};
\arctext[OMAM][RedArc][5pt](3.5)(205)(265){|\scriptsize\bf\color{white}| O{\&}M Alignment Module};
\arctext[PROV][SkyArc][5pt](3.5)(270)(320){|\scriptsize| PROV Alignment Module};
\arctext[OBOE][SkyArc][5pt](3.5)(-35)(20){|\scriptsize| OBOE Alignment Module};
\arctext[DUAM][SkyArc][5pt](4.5)(215)(150){|\scriptsize| Dolce-UltraLite Alingment Module};
\arctext[SSNX][SkyArc][5pt](4.5)(145)(80){|\scriptsize| SSNX Alingment Module};
%ADITIONAL
\arctext[NEW][
color=white,
shade,
upper left=red,
upper right=black!50,
lower left=blue,
lower right=blue!50,
rounded corners = 8pt
][8pt](5.2)(100)(-20){|\footnotesize\bf\color{white}| You can create and use all the style options for shapes and text};
%Drawing the Arrows
%\arcarrow(above/below ID)(abobe/below ID)[shift]
\arcarrow(below DUAM)(above SRel)[15];
\arcarrow(below SSNX)(above SSN)[35];
\arcarrow(below SSN)(SOSA-R)[60];
\arcarrow(below right OMAM)(SOSA-R)[4];
\arcarrow(below right PROV)(SOSA-R)[25];
\arcarrow(below OBOE)(SOSA-R)[-5];
%Same level Arrows
\draw[myarrow] (left SSNX) -- (right DUAM);
\draw[myarrow] (left SSN) -- (left SRel);
\draw[myarrow] (left SCap) -- (right SSN);
\draw[myarrow] (-5,-3.5) coordinate (legend) -- ++(.8,0) node[anchor=west] {owl: imports (extends)};
\draw[RedArc] (legend)++(0,-0.4) rectangle ++(.8,-.3)++(0,.2) node[anchor=west] {normative};
\draw[SkyArc] (legend)++(0,-1) rectangle ++(.8,-.3)++(0,.2) node[anchor=west, color=black] {non-normative};
\end{tikzpicture}
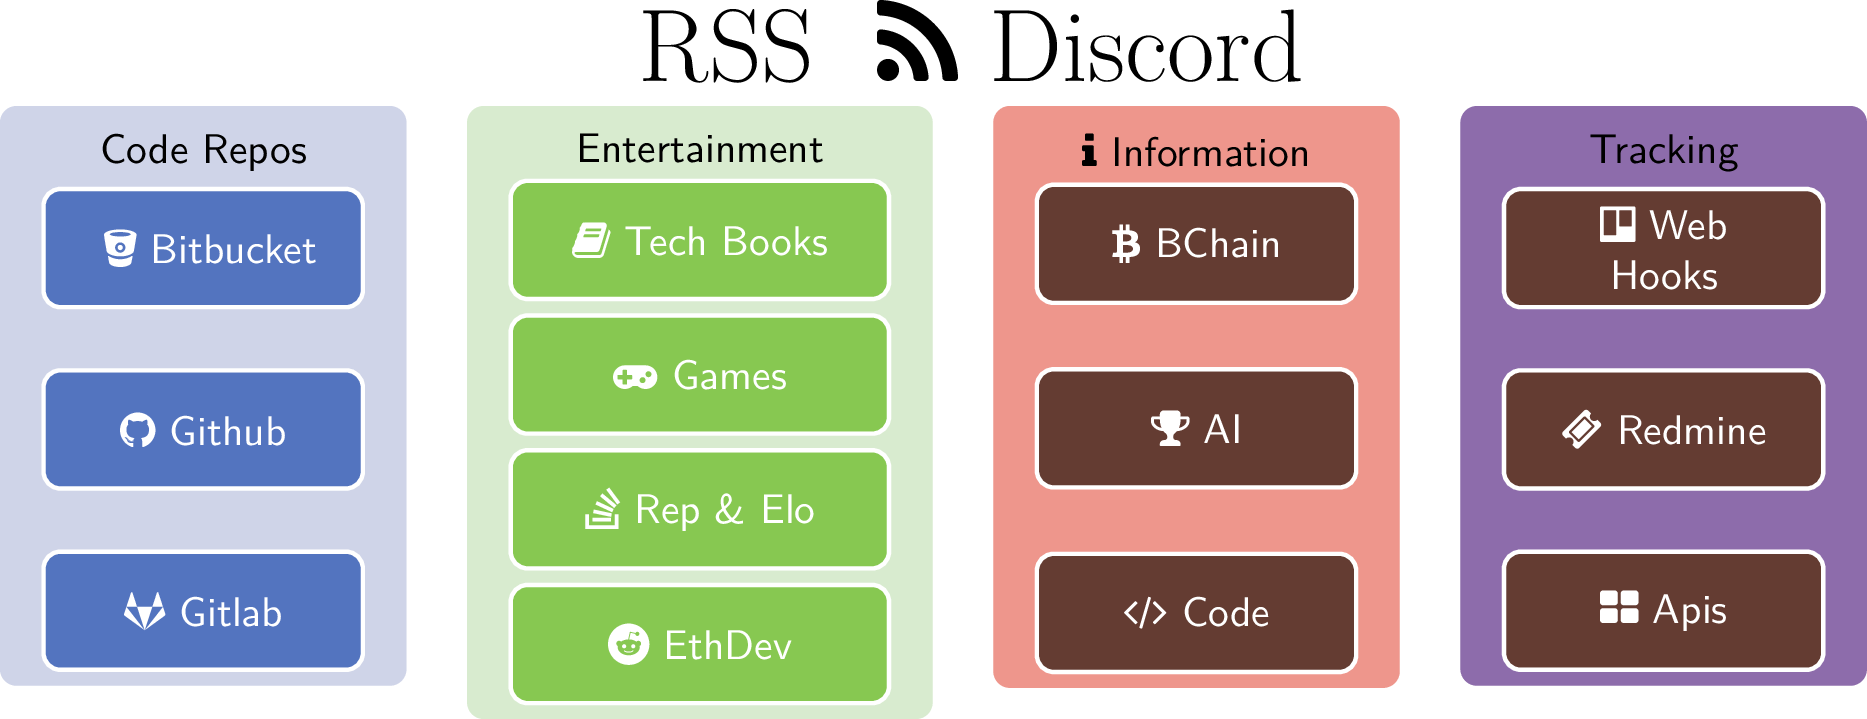
\end{document}\documentclass{standalone}
\usepackage{fontawesome}
\usepackage{tikz}
\usetikzlibrary{matrix, positioning}
\definecolor{bluei}{RGB}{83,116,191}
\definecolor{blueii}{RGB}{207,212,232}
\definecolor{greeni}{RGB}{135,200,81}
\definecolor{greenii}{RGB}{216,235,207}
\definecolor{redi}{RGB}{238, 150, 140}
\definecolor{redii}{RGB}{100,60,50}
\definecolor{purpi}{RGB}{141, 108, 171}
\definecolor{purpii}{RGB}{100,60,50}
\tikzset{
myiblock/.style 2 args={
draw=white,
fill=#1,
line width=1pt,
rounded corners,
minimum height=1cm,
align=center,
text=white,
font=\sffamily,
text width=#2
},
myoblock/.style={
matrix of nodes,
fill=#1,
rounded corners,
align=center,
inner xsep=10pt,
draw=none,
row sep=0.5cm
},
mylabel/.style={
black,
minimum height=0pt
}
}
\begin{document}
%\resizebox{14cm}{3cm}{%
\begin{tikzpicture}
\node[inner sep=0pt] (russell) at (6.5,3)
{ {\Huge RSS \ \faRss \ Discord }};
\matrix (A) [myoblock={blueii}, nodes={myiblock={bluei}{2cm}}]
{|[label={[mylabel]Code Repos}]|{ \faBitbucket \ Bitbucket }\\
\faGithub \ Github \\
\faGitlab \ Gitlab \\
};
\matrix (B) [myoblock={greenii}, nodes={myiblock={greeni}{2.5cm}},
row sep=3pt, right=5mm of A.north east, anchor=north west]
{|[label={[mylabel]Entertainment}]|
\faBook \ Tech Books \\
\faGamepad \ Games\\
\faStackOverflow \ Rep \& Elo \\
\faReddit \ EthDev \\
};
\matrix (C) [myoblock={redi}, nodes={myiblock={redii}{2cm}},
row sep=15pt, right=5mm of B.north east, anchor=north west]
{|[label={[mylabel]\faInfo \ Information}]|
\faBitcoin \ BChain \\
\faTrophy \ AI \\
\faCode \ Code \\
};
\matrix (D) [myoblock={purpi}, nodes={myiblock={purpii}{2cm}},
right=5mm of C.north east, anchor=north west]
{|[label={[mylabel] Tracking}]|
\faTrello \ Web Hooks \\
\faTicket \ Redmine \\
\faThLarge \ Apis \\
};
\end{tikzpicture}
%}
\end{document}\documentclass[border=10pt]{standalone}
\usepackage{forest}
\definecolor{fblue}{RGB}{92,144,192}
\definecolor{fgreen}{RGB}{34,162,70}
\newcommand\myfolder[2][fblue]{%
\begin{tikzpicture}[overlay]
\begin{scope}[xshift=20pt]
\filldraw[rounded corners=1pt,fill=#1,draw=white,double=black]
(-23pt,10pt) -- ++(3pt,5pt) -- ++(18pt,0pt) -- ++(40:3pt) -- ++(9pt,0pt) -- ++(-40:3pt)
-- (20pt,15pt) -- (23pt,10pt) -- cycle;
\filldraw[rounded corners,draw=white,double=black,top color=#1,bottom color=#1!30]
(-22pt,-12pt) -- ++(44pt,0pt) -- (25pt,12pt) coordinate (topr) -- ++(-50pt,0pt) coordinate (topl) -- cycle;
\end{scope}
\end{tikzpicture}%
\makebox[35pt]{\raisebox{-3pt}{{\ttfamily/#2}}}%
}
\begin{document}
\begin{forest}
for tree={
font=\sffamily,
minimum height=0.75cm,
rounded corners=4pt,
grow'=0,
inner ysep=8pt,
child anchor=west,
parent anchor=south,
anchor=west,
calign=first,
edge={rounded corners},
edge path={
\noexpand\path [draw, \forestoption{edge}]
(!u.south west) +(12.5pt,0) |- (.child anchor)\forestoption{edge label};
},
before typesetting nodes={
if n=1
{insert before={[,phantom,minimum height=18pt]}}
{}
},
fit=band,
s sep=12pt,
before computing xy={l=25pt},
}
[\myfolder{}
[\myfolder{jhunt}]
[\myfolder{dev}
[{\myfolder[fgreen]{bchain}}]
[{\myfolder[fgreen]{other}}]
]
[{\myfolder[fgreen]{games}}
[{\myfolder[fgreen]{vns}}]
[{\myfolder[fgreen]{other}}]
]
[\myfolder{music}]
[\myfolder{other}]
]
\end{forest}
\end{document}\documentclass[tikz,table,border=2mm]{standalone}
% \usepackage{PTSansNarrow}
% \usepackage[T1]{fontenc}
\usepackage{array,tabularx}
\usepackage[most]{tcolorbox}
\begin{document}
\rowcolors{1}{blue!15}{white}
\begin{tcolorbox}[enhanced, notitle, clip upper, fontupper=\sffamily,%
tabularx={>{\centering\arraybackslash}X%
>{\centering\arraybackslash}X%
>{\centering\arraybackslash}X}]
\cellcolor{orange!40} \color{black} \textbf{Traditional} &\cellcolor{orange!40}\color{black} \textbf{Chosen} &\cellcolor{orange!40}\color{black} \textbf{Other} \\
cell1 & cell2 & cell3 \\
cell4 & cell5 & cell6 \\
cell7 & cell8 & cell9 \\
cell10 & cell11 & cell12 \\
cell13 & cell14 & cell15 \\
cell16 & cell17 & cell18 \\
\end{tcolorbox}
\end{document}\documentclass[border=3mm]{standalone}
\usepackage{tikz}
\usetikzlibrary{backgrounds,shadows,positioning,fit,matrix,shapes.geometric, shapes.arrows} % add shadows #1
% a way to cut shadows in a cell #2
%https://tex.stackexchange.com/questions/129318/remove-drop-shadow-from-one-node
\makeatletter
\tikzset{no shadows/.code=\let\tikz@preactions\pgfutil@empty}
\makeatother
\tikzset{background/.style={rectangle, fill=red!10, inner sep=0.2cm},
backgroundN/.style={rectangle, fill=white, inner sep=0.3cm},
backgroundNN/.style={rectangle, fill=red!10, inner sep=0.2cm}}
\tikzset{back/.style={rectangle, fill=blue!10, inner sep=0.2cm},
backgroundN/.style={rectangle, fill=white, inner sep=0.3cm},
backgroundNN/.style={rectangle, fill=red!10, inner sep=0.2cm}}
\definecolor{mybluei}{RGB}{124,156,205}
\definecolor{myblueii}{RGB}{73,121,193}
\definecolor{mygreen}{RGB}{202,217,126}
\definecolor{mypink}{RGB}{233,198,235}
\definecolor{rinkeby}{HTML}{F6C343}
\definecolor{kovan}{HTML}{7057ff}
\definecolor{ropsten}{HTML}{FF4A8D}
\definecolor{mainnet}{HTML}{29B6AF}
\definecolor{antiquefuchsia}{rgb}{0.57, 0.36, 0.51}
\definecolor{byzantium}{rgb}{0.44, 0.16, 0.39}
\definecolor{darkcandyapplered}{rgb}{0.64, 0.0, 0.0}
\definecolor{darkbyzantium}{rgb}{0.36, 0.22, 0.33}
\definecolor{jasper}{rgb}{0.84, 0.23, 0.24}
\definecolor{pastelred}{rgb}{1.0, 0.41, 0.38}
\definecolor{pinkpearl}{rgb}{0.91, 0.67, 0.81}
\definecolor{blue(pigment)}{rgb}{0.2, 0.2, 0.6}
\newcommand\widernode[5][widebox]{
\node[
#1,
fit={(#2) (#3)},
label=center:{\sffamily\bfseries\color{black}#4}] (#5) {};
}
\begin{document}
\begin{tikzpicture}[node distance=2pt,outer sep=0pt, % just do nothing after modification
boxstyle/.style={
draw=white,
fill=#1,
rounded corners, drop shadow, %to get a shadow in below a node
font={\sffamily\bfseries\color{white}},
align=center,
minimum height=30pt
},
box/.style={
boxstyle=#1,
text width=2.5cm},
box/.default=mybluei,
title/.style={font={\sffamily\bfseries\color{black}}},
widebox/.style={draw=white,inner sep=0pt, rounded corners,fill=#1,drop shadow},
widebox/.default=mybluei,
mylabel/.style={font={\sffamily\bfseries\color{black}}},
database/.style={
cylinder,
cylinder uses custom fill,
cylinder body fill=yellow!50,
cylinder end fill=yellow!50,
shape border rotate=90,
aspect=0.25,
draw
}
]
\matrix (stack) [% boxstyle=mybluei!40,%will overpaint blocks with background
column sep=10pt, row sep=10pt, inner sep=4mm,%
matrix of nodes,
nodes={box, outer sep=0pt, anchor=center, inner sep=3pt},%
nodes in empty cells=false,% #3
row 1/.style={nodes={fill=none,draw=none,minimum height=3mm}},
]
{
|[no shadows]| & & & [1cm] & & |[no shadows]| \\ % #5
%RCP main & Authoring & Browsing & Publishing & Search&|[no shadows]| \\
|[no shadows]| & & |[no shadows]| & |[no shadows]|& &|[no shadows]| \\
|[no shadows]| & |[no shadows]| & |[no shadows]| &|[no shadows]| & |[no shadows]|& |[box=blue(pigment)]| Web3 \\
|[no shadows]|& |[no shadows]| &|[no shadows]| & |[no shadows]| &|[no shadows]| & |[box=blue(pigment)]| Truffle \\
||[no shadows]| & |[no shadows]| & |[no shadows]| & |[no shadows]| & |[no shadows]| & |[box=blue(pigment)]| React \\};
\widernode[]{stack-1-1}{stack-1-6}{File track Dapp Architecture Architecture}{EPF} %#5
\widernode[widebox=mygreen]{stack-2-1}{stack-2-3}{Blockchain Stack}{SM}
\widernode[widebox=pastelred]{stack-2-4}{stack-2-6}{Front End Stack}{FE}
\widernode[widebox=mainnet]{stack-3-1}{stack-3-3}{Infura}{Ethereum}
\widernode{stack-3-4}{stack-3-5}{Metamask}{MM}
% \widernode{stack-3-6}{stack-3-6}{Web3}{AA}
\widernode[widebox=rinkeby]{stack-4-1}{stack-4-3}{Solidity}{Solidity}
\widernode{stack-4-4}{stack-4-5}{Webpack}{BB}
% \widernode{stack-4-6}{stack-4-6}{Truffle}{CC}
\widernode[widebox=kovan]{stack-5-1}{stack-5-3}{IPFS}{IPFS}
\widernode{stack-5-4}{stack-5-5}{Drizzle}{DC}
% \widernode{stack-5-6}{stack-5-6}{React}{MC23}
%\widernode[widebox=pinkpearl]{stack-4-1}{stack-4-1}{Exchanger}{UMA23}
%\widernode[widebox=pinkpearl]{stack-4-2}{stack-4-3}{StoreFront}{UMA}
%\widernode{stack-4-4}{stack-4-5}{Export/Import}{ExImp}
%\widernode[widebox=pinkpearl]{stack-5-2}{stack-5-3}{ERC721}{EMF}
%\widernode[widebox=mygreen]{stack-6-1}{stack-6-5}{RCP Runtime}{RCPrun}
% \widernode[widebox, text width=1.5cm, align=center]{stack-2-6}{stack-3-6}{Normal text works}{NTWorks}
%
%\node [fit={(stack.south west)(stack.south east)},boxstyle=myblueii,draw=black,inner sep=0pt,below=3pt of stack.south,anchor=north,label={[mylabel]center:Java Runtime}] (JavaR) {};
%
%
%
\begin{pgfonlayer}{background}
\coordinate (aux) at ([xshift=1mm]stack-5-6.east);
\node [back,
fit=(stack-1-1) (stack-5-1) (aux), draw, drop shadow,
] {};
%\node [backgroundN,
% fit=(stack-3-5) ] {};
%\node [backgroundNN,draw, drop shadow,
% fit=(stack-3-5) ] {};
\end{pgfonlayer}
% % smth to create an arbitrary block with a border and shadow
%Background for smart contracts
\begin{pgfonlayer}{background}
\coordinate (aux) at ([xshift=1mm]stack-5-3.east);
\node [background,
fit=(stack-2-1) (stack-5-1) (aux), draw, drop shadow,
] {};
%\node [backgroundN,
% fit=(stack-3-5) ] {};
%\node [backgroundNN,draw, drop shadow,
% fit=(stack-3-5) ] {};
\end{pgfonlayer}
\begin{pgfonlayer}{background}
\coordinate (aux) at ([xshift=1mm]stack-5-6.east);
\node [background,
fit=(stack-2-4) (stack-5-4) (aux), draw, drop shadow,
] {};
%\node [backgroundN,
% fit=(stack-3-5) ] {};
%\node [backgroundNN,draw, drop shadow,
% fit=(stack-3-5) ] {};
\end{pgfonlayer}
\end{tikzpicture}
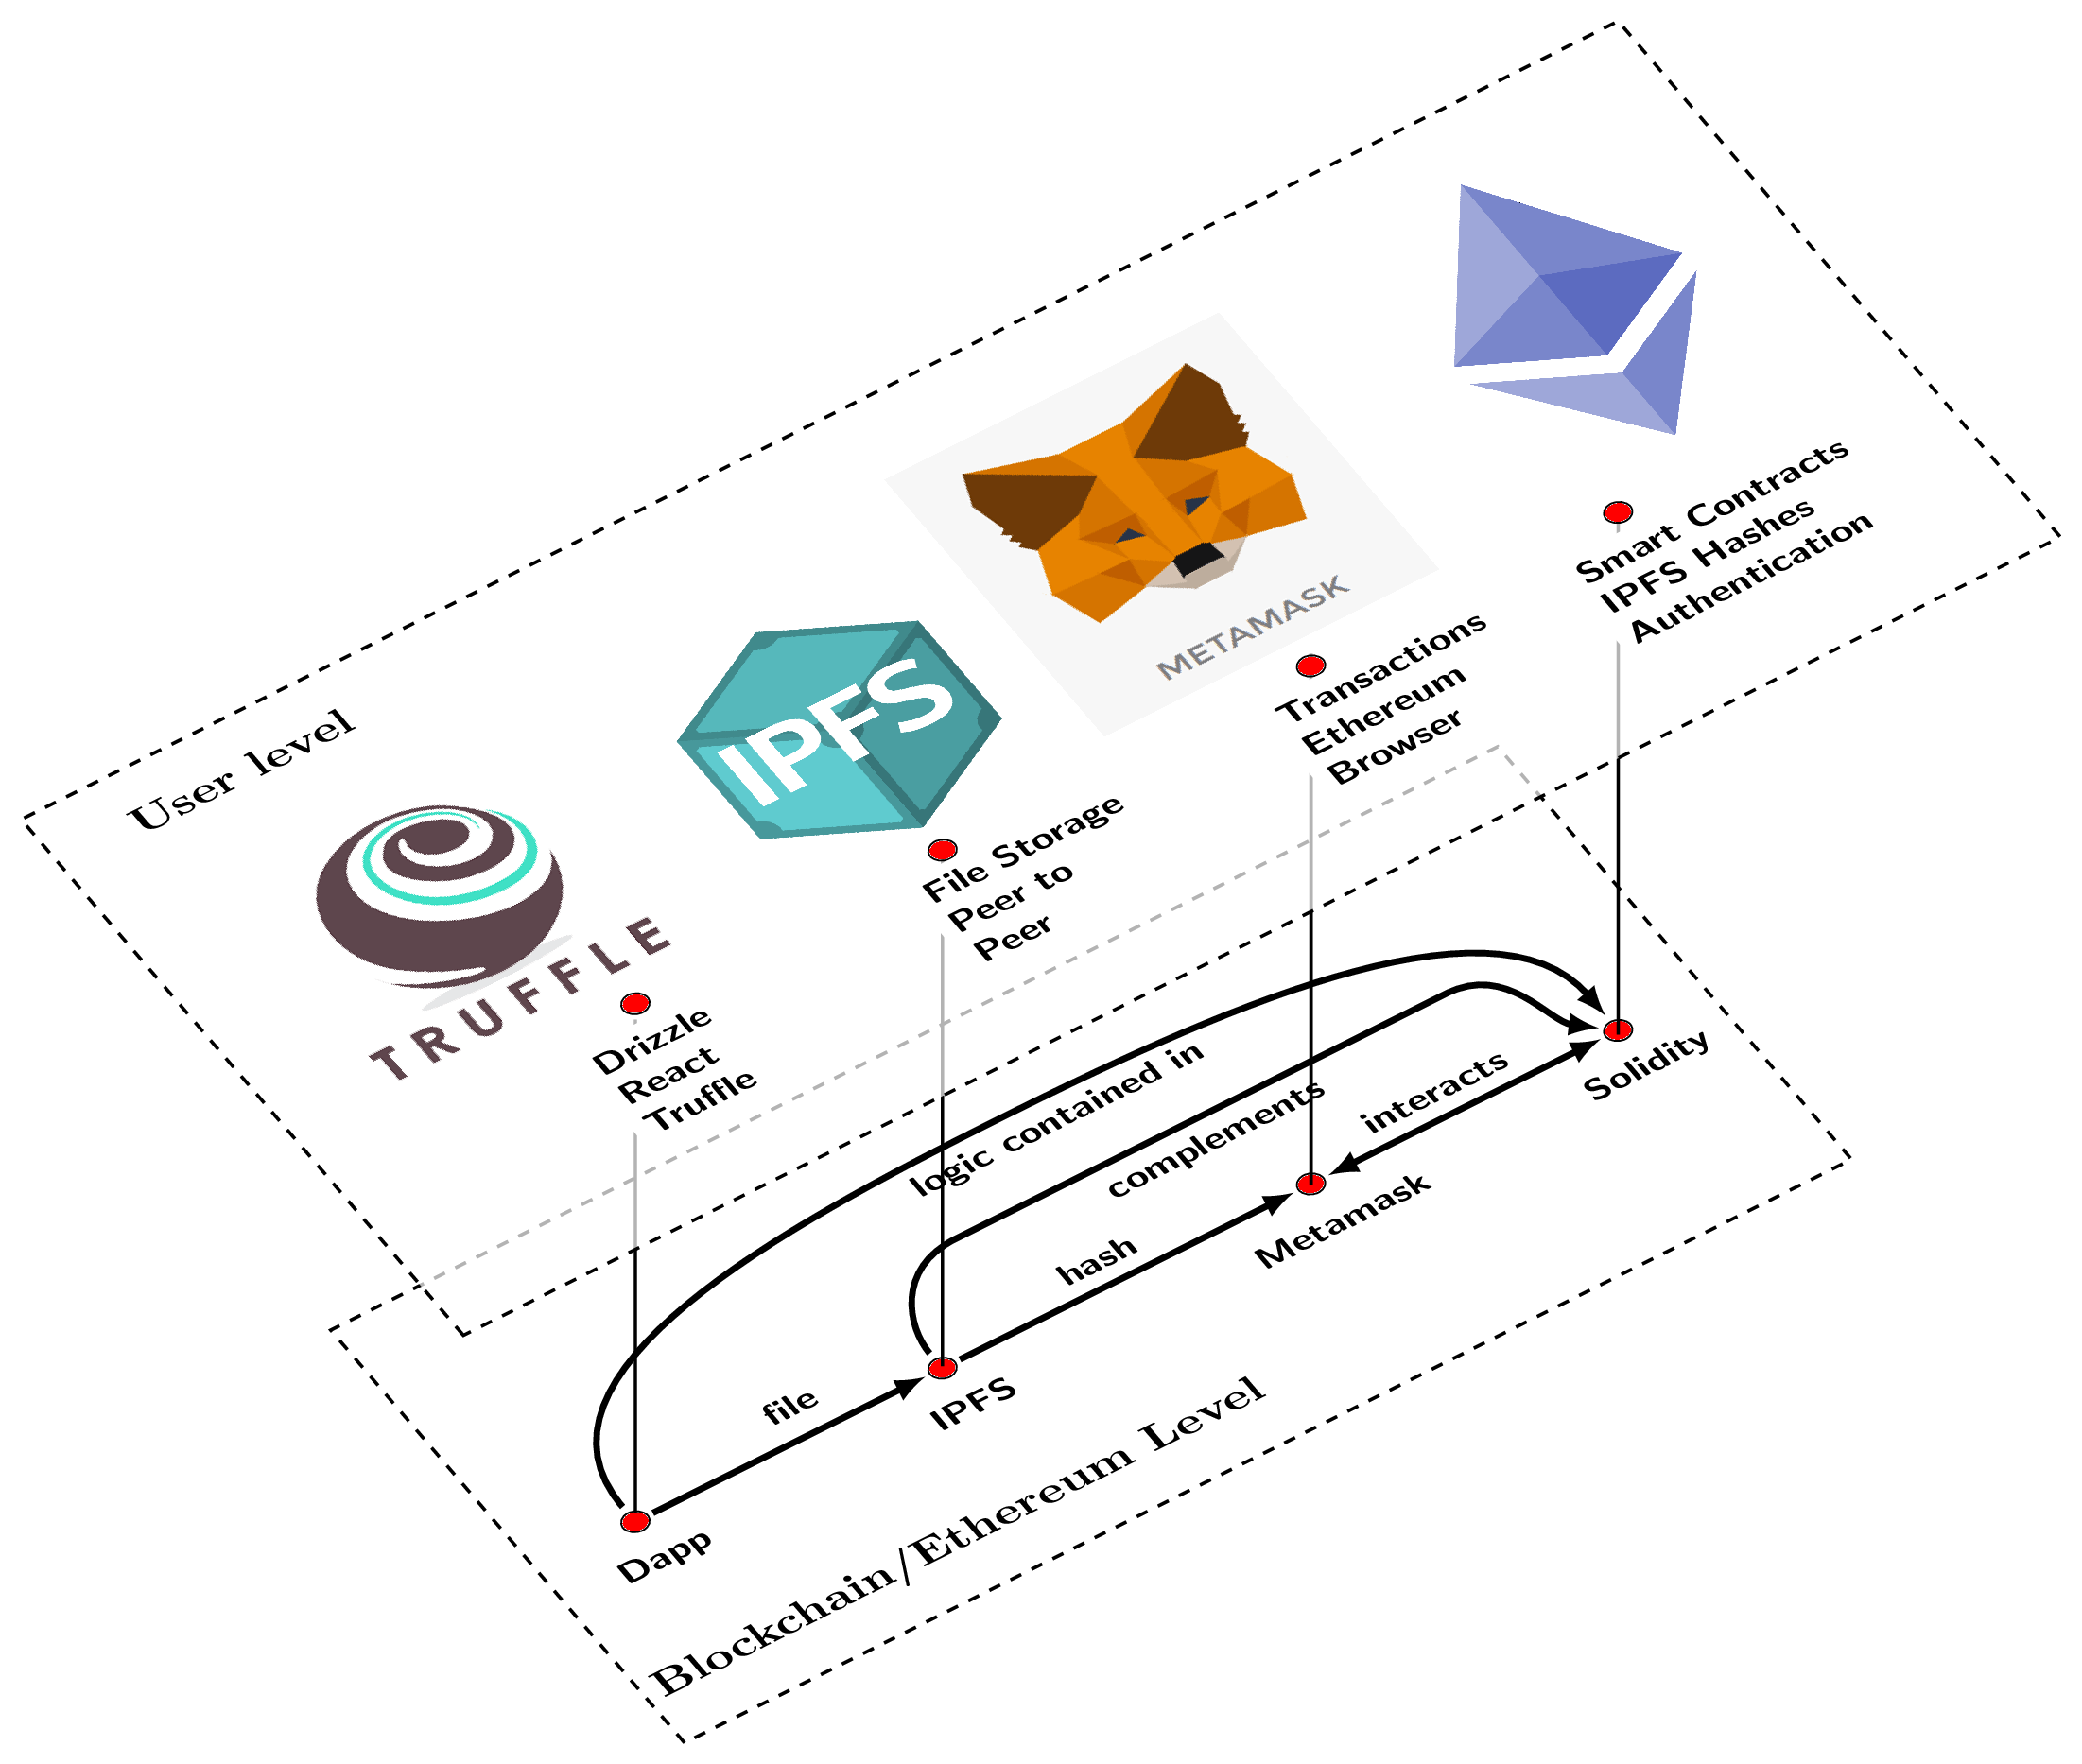
\end{document}% Interaction diagram, LaTeX user level and TeX system software level
% Author: Agostino De Marco
% Based on diagram from Marco Miani and Pascal Seppecher.
\documentclass{article}
\usepackage{tikz}
%%%<
\usepackage{verbatim}
\usepackage[active,tightpage]{preview}
\PreviewEnvironment{tikzpicture}
\setlength\PreviewBorder{5pt}%
%%%>
\usetikzlibrary{positioning}
\newcommand{\yslant}{0.5}
\newcommand{\xslant}{-0.6}
\begin{document}
\begin{tikzpicture}[scale=1.1,every node/.style={minimum size=1cm},on grid]
% Software level
\begin{scope}[
yshift=-120,
every node/.append style={yslant=\yslant,xslant=\xslant},
yslant=\yslant,xslant=\xslant
]
% The lower frame:
\draw[black, dashed, thick] (-1.3,0) rectangle (8.2,4.8);
% Agents:
\draw[fill=red]
(7.5,2) circle (.1) % .pdf file
(5,2) circle (.1) % .ps file
(2,2) circle (.1) % .dvi file
(-0.5,2) circle (.1); % .tex file
% Flows:
\draw[-latex,ultra thick,shorten <=5pt,shorten >=5pt]
(-0.5,2) to[out=0,in=-180] (2,2); % latex
\draw[-latex,ultra thick,shorten <=5pt,shorten >=5pt]
(2,2) to[out=0,in=-180] (5,2); % dvi2ps
\draw[latex-latex,ultra thick,shorten <=5pt,shorten >=5pt]
(5,2) to[out=0,in=-180] (7.5,2); % ps2pdf, pdf2ps
\draw[-latex,ultra thick,shorten <=5pt,shorten >=5pt]
(-0.5,2) to[out=90,in=-180] (3.5,3.8) to[out=0,in=90] (7.5,2); % pdflatex
\draw[-latex,ultra thick,shorten <=5pt,shorten >=5pt]
(2,2) to[out=90,in=-180] (2.7,3.0) to[out=0,in=-180] (6.7,3.0) to[out=0,in=135] (7.5,2); % ps2pdfm
% Labels:
\fill[black]
(1.0,2) node[above=-3pt, scale=0.9] {\textsf{\bfseries file}}
(3.5,2) node[above=-5pt, scale=0.9] {\textsf{\bfseries hash}}
(6.25,2) node[above=-5pt, scale=0.9] {\textsf{\bfseries interacts}}
%(6.25,2) node[xshift=-1ex,below=-5pt, scale=0.9] {\textsf{\bfseries pdf2ps}}
(3.5,3.8) node[xshift=2ex,below=-5pt, scale=0.9] {\textsf{\bfseries logic contained in}}
(4.3,3.0) node[xshift=2ex,below=-5pt, scale=0.9] {\textsf{\bfseries complements}}
(1.3,0.1) node[above=-2pt, scale=1.1] {\textbf{Blockchain/Ethereum Level}}
(-0.5,2) node[below,scale=.9]{\textsf{\bfseries Dapp} }
(2,2) node[below,scale=.9]{\textsf{\bfseries IPFS}}
(5,2) node[below,scale=.9]{\textsf{\bfseries Metamask}}
(7.5,2) node[below,scale=.9]{\textsf{\bfseries Solidity}};
\end{scope}
% vertical lines for linking agents on the 2 levels
\draw[thick](6.3,5.1) to (6.3,0.9);
\draw[thick](3.8,4) to (3.8,-0.32);
\draw[thick](0.8,2.4) to (.8,-1.8);
\draw[thick](-1.70,1.02) to (-1.70,-3);
% User level
\begin{scope}[
yshift=0,
every node/.append style={yslant=\yslant,xslant=\xslant},
yslant=\yslant,xslant=\xslant
]
% The upper frame:
\fill[white,fill opacity=.70] (-3.1,0) rectangle (9.9,6); % Opacity
\draw[black, dashed, thick] (-3.1,0) rectangle (9.9,6);
% Agents:
\draw [fill=red]
(7.5,2) circle (.1) % .pdf file
(5,2) circle (.1) % .ps
(2,2) circle (.1) % .dvi
(-0.5,2) circle (.1); % .tex file
% the icons
\node[anchor=south,inner sep=0,xshift=-20pt,yshift=10pt,fill=white] at (-0.5,2)
{\includegraphics[width=2.5cm]{truffle.png}};
\node[anchor=south,inner sep=0,xshift=0pt,yshift=8pt] at (2,2)
{\includegraphics[width=2.5cm]{ipfs-logo.png}};
\node[anchor=south,inner sep=0,xshift=-5pt,yshift=8pt] at (5,2)
{\includegraphics[width=3.0cm]{metamask.png}};
\node[anchor=south,inner sep=0,xshift=20pt,yshift=8pt] at (7.5,2)
{\includegraphics[width=3.5cm]{ethereum.png}};
\fill[black]
(7.5,2) node[below right,,xshift=-20pt,yshift=-5pt,scale=.9,text width=2.5cm,align=left,fill=white]
{\textsf{\bfseries \mbox{Smart Contracts}}\\ \textsf{\bfseries IPFS Hashes}
\\ \textsf{\bfseries Authentication}}
(-2.5,5.5) node[anchor=west,inner sep=0, scale=1.1] {\textbf{User level}}
(5.1,1.9) node[below right,xshift=-20pt,scale=.9,text width=2cm,align=left,fill=white]
{\textsf{\bfseries Transactions}\\ \textsf{\bfseries Ethereum Browser} }
(1.9,1.9) node[below right,xshift=-10pt,scale=.9,text width=2cm,align=left,fill=white]
{\textsf{\bfseries File Storage}\\ \textsf{\bfseries Peer to Peer}}
(-0.5,2) node[below right,xshift=-20pt,yshift=-5pt,scale=.9,text width=2.5cm,align=left,fill=white]
{\textsf{\bfseries Drizzle}\\ \textsf{\bfseries React}\\
\textsf{\bfseries Truffle}}
;
\end{scope}
\end{tikzpicture}
\end{document}\documentclass[border=2mm]{standalone}
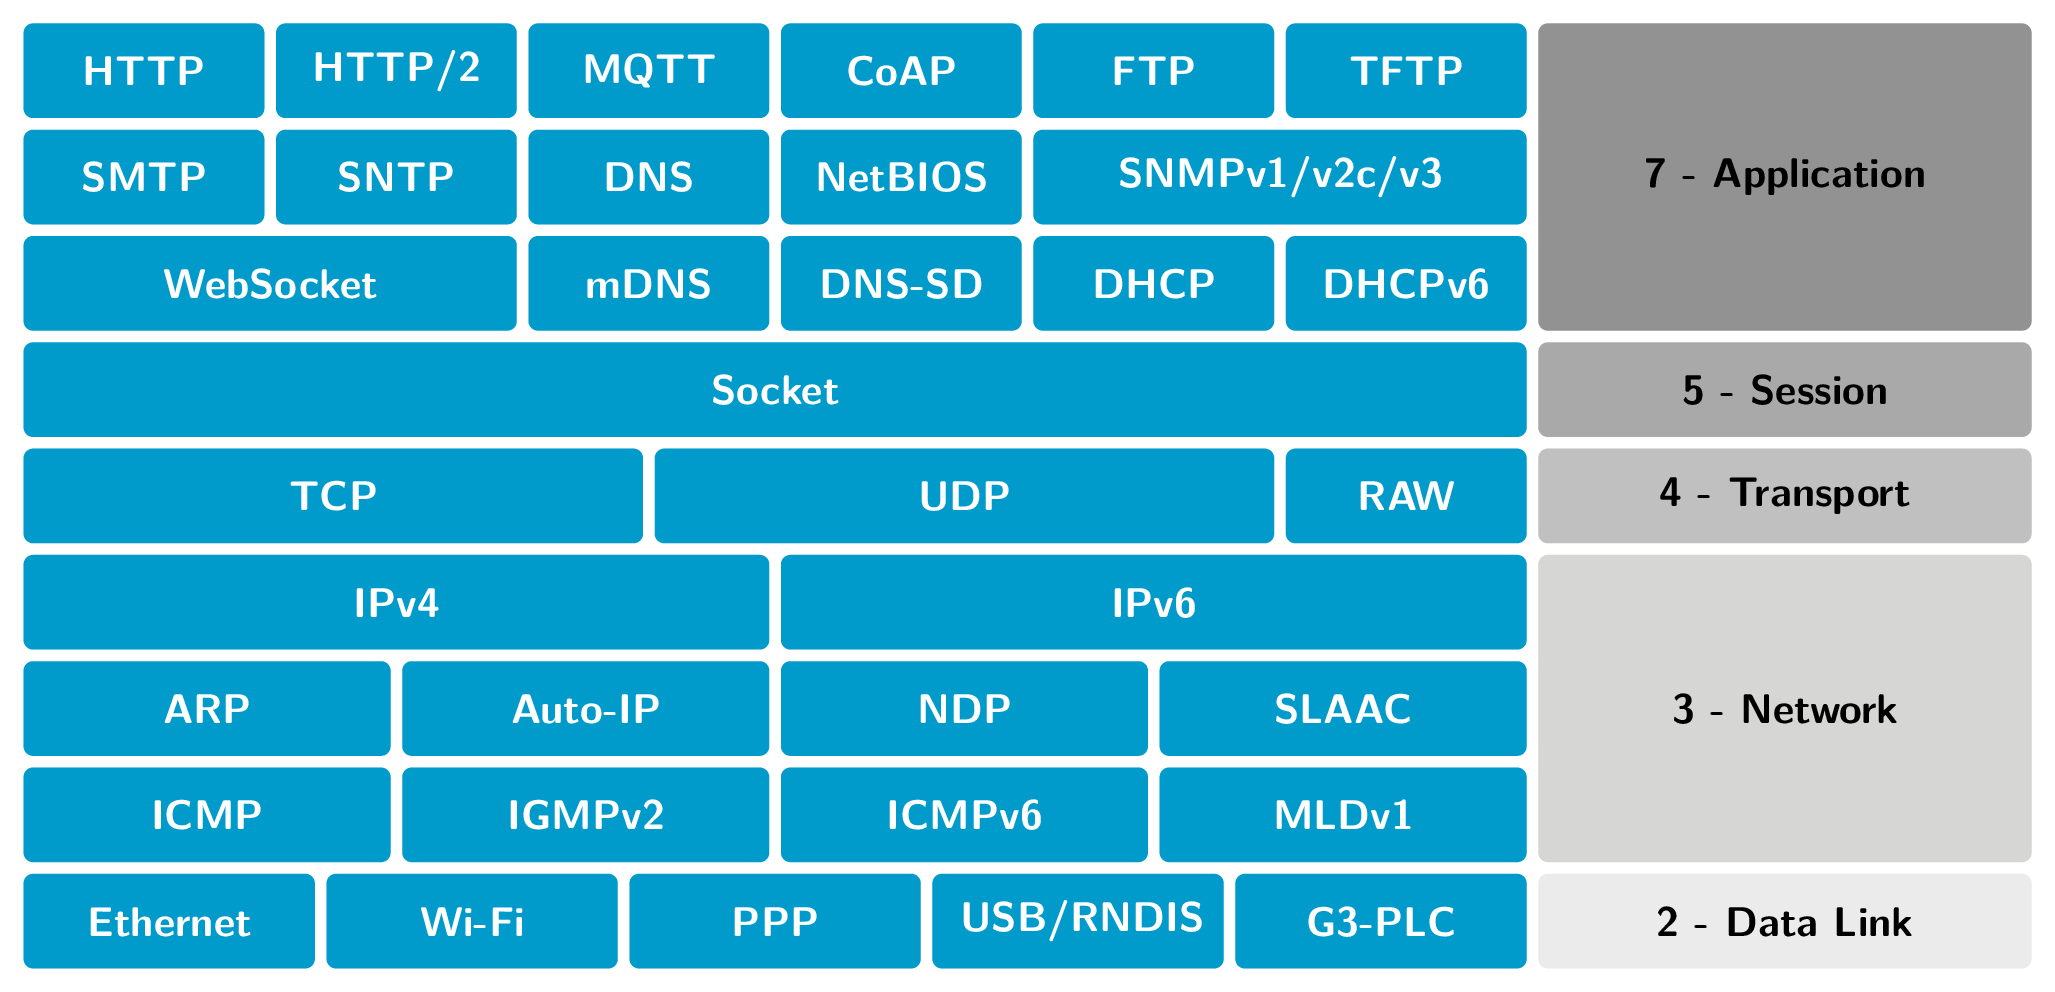
\usepackage[most]{tcolorbox}
\usepackage{lmodern}
\usepackage{lipsum}
%\usepackage{geometry}
\standaloneenv{tcbposter}
%\pagestyle{empty}
\begin{document}
\begin{tcbposter}[%
poster = {columns=8, rows=9, width=17cm, height=8cm, spacing=1mm},% showframe},
boxes = {colback=cyan!80!black,
boxrule=0pt, arc=2mm,
colframe=cyan!80!black,
halign=center, valign=center,
colupper=white,
fontupper=\sffamily\bfseries, size=small}
]
%1st row
\posterbox{column=1, row=1}{HTTP}
\posterbox{column=2, row=1}{HTTP/2}
\posterbox{column=3, row=1}{MQTT}
\posterbox{column=4, row=1}{CoAP}
\posterbox{column=5, row=1}{FTP}
\posterbox{column=6, row=1}{TFTP}
%2nd row
\posterbox{column=1, row=2}{SMTP}
\posterbox{column=2, row=2}{SNTP}
\posterbox{column=3, row=2}{DNS}
\posterbox{column=4, row=2}{NetBIOS}
\posterbox{column=5, row=2, span=2}{SNMPv1/v2c/v3}
%3rd row
\posterbox{column=1, row=3, span=2}{WebSocket}
\posterbox{column=3, row=3}{mDNS}
\posterbox{column=4, row=3}{DNS-SD}
\posterbox{column=5, row=3}{DHCP}
\posterbox{column=6, row=3}{DHCPv6}
%4th row
\posterbox{column=1, row=4,span=6}{Socket}
%5th row
\posterbox{column=1, row=5, span=2.5}{TCP}
\posterbox{column*=5, row=5, span=2.5}{UDP}
\posterbox{column=6, row=5}{RAW}
%6th row
\posterbox{column=1, row=6, span=3}{IPv4}
\posterbox{column=4, row=6, span=3}{IPv6}
%7th row
\posterbox{column=1, row=7, span=1.5}{ARP}
\posterbox{column*=3, row=7, span=1.5}{Auto-IP}
\posterbox{column=4, row=7, span=1.5}{NDP}
\posterbox{column*=6, row=7, span=1.5}{SLAAC}
%8th row
\posterbox{column=1, row=8, span=1.5}{ICMP}
\posterbox{column*=3, row=8, span=1.5}{IGMPv2}
\posterbox{column=4, row=8, span=1.5}{ICMPv6}
\posterbox{column*=6, row=8, span=1.5}{MLDv1}
%9th row
%5 boxes and 4 separations should use
%equivalent to 6 original boxes plus 5
%separations
\newlength{\mylength}
\pgfmathsetlength{\mylength}{(6*\tcbpostercolwidth+\tcbpostercolspacing)/5}%
%Use `width` instead of `span` to fix box size
\posterbox[width=\mylength]{name=91, column=1, row=9}{Ethernet}
\posterbox[width=\mylength]{name=92, column=1, row=9, xshift=\mylength+\tcbpostercolspacing}{Wi-Fi}
\posterbox[width=\mylength]{name=92, column=1, row=9, xshift=2*\mylength+2*\tcbpostercolspacing}{PPP}
\posterbox[width=\mylength]{name=92, column=1, row=9, xshift=3*\mylength+3*\tcbpostercolspacing}{USB/RNDIS}
\posterbox[width=\mylength]{column*=6, row=9}{G3-PLC}
%Right column
\posterbox[colback=gray, colframe=gray, colupper=black]{column=7, row=1, span=2, rowspan=3}{7 - Application}
\posterbox[colback=gray!80, colframe=gray!80, colupper=black]{column=7, row=4, span=2}{5 - Session}
\posterbox[colback=gray!60, colframe=gray!60, colupper=black]{column=7, row=5, span=2}{4 - Transport}
\posterbox[colback=gray!40, colframe=gray!40, colupper=black]{column=7, row=6, span=2, rowspan=3}{3 - Network}
\posterbox[colback=gray!20, colframe=gray!20, colupper=black]{column=7, row=9, span=2}{2 - Data Link}
\end{tcbposter}
\end{document}% ateb: https://tex.stackexchange.com/a/271349/ addaswyd o gwestiwn OOzy Pal: https://tex.stackexchange.com/q/271170/
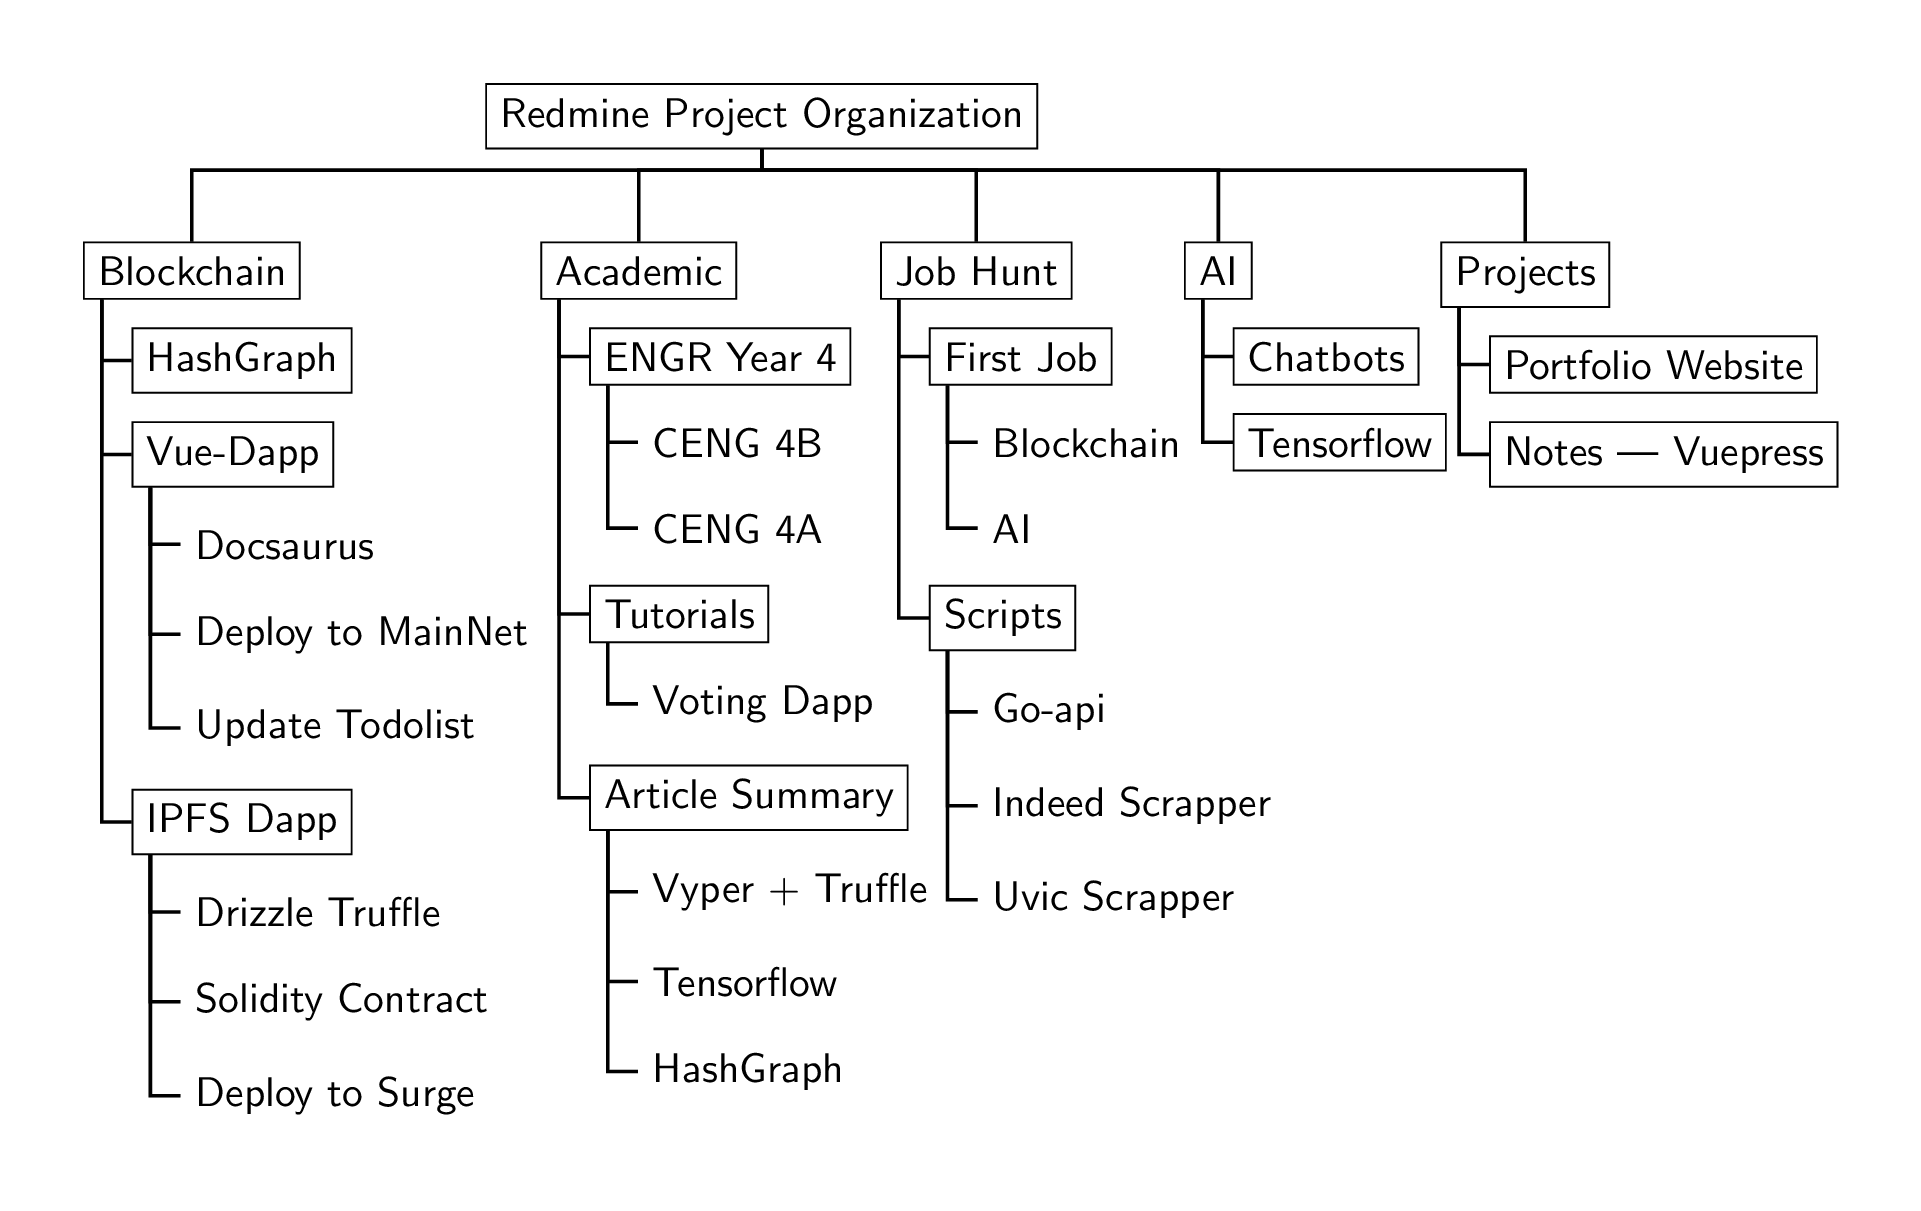
\documentclass[border=20pt,tikz]{standalone}
\usepackage[edges]{forest}
\forestset{
direction switch/.style={
for tree={edge+=thick, font=\sffamily},
where level>=1{folder, grow'=0}{for children=forked edge},
where level=3{}{draw},
},
}
\begin{document}
\begin{forest}
% forest preamble: determine layout and format of tree
direction switch
[Redmine Project Organization
[Blockchain
[HashGraph
]
[Vue-Dapp
[Docsaurus]
[Deploy to MainNet]
[Update Todolist]
]
[IPFS Dapp
[Drizzle Truffle]
[Solidity Contract]
[Deploy to Surge]
]
]
[Academic
[ENGR Year 4
[CENG 4B]
[CENG 4A]
]
[Tutorials
[Voting Dapp]
]
[Article Summary
[Vyper + Truffle]
[Tensorflow]
[HashGraph]
]
]
[Job Hunt
[First Job
[Blockchain]
[AI]
]
[Scripts
[Go-api]
[Indeed Scrapper]
[Uvic Scrapper]
]
]
[AI
[Chatbots]
[Tensorflow]
]
[Projects
[Portfolio Website]
[Notes --- Vuepress]
]
]
\end{forest}
\end{document}
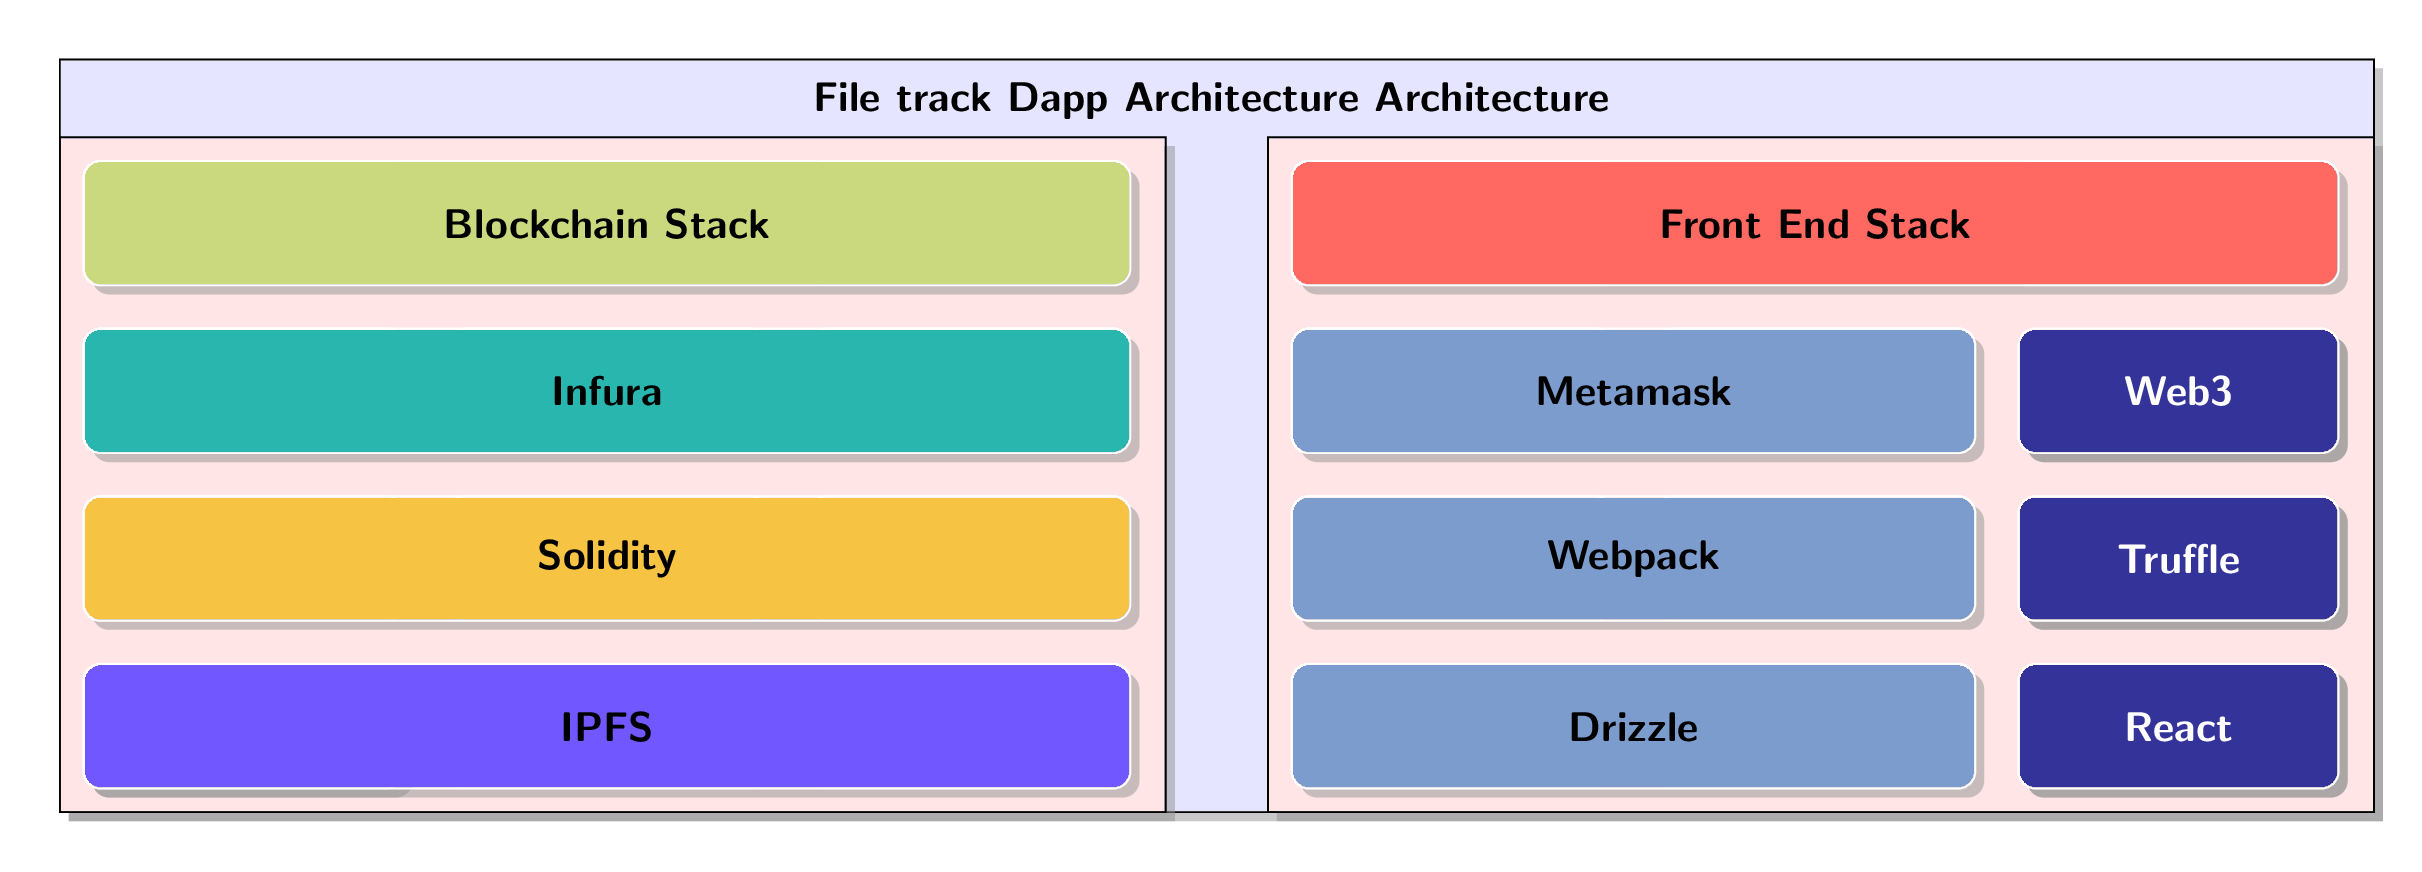
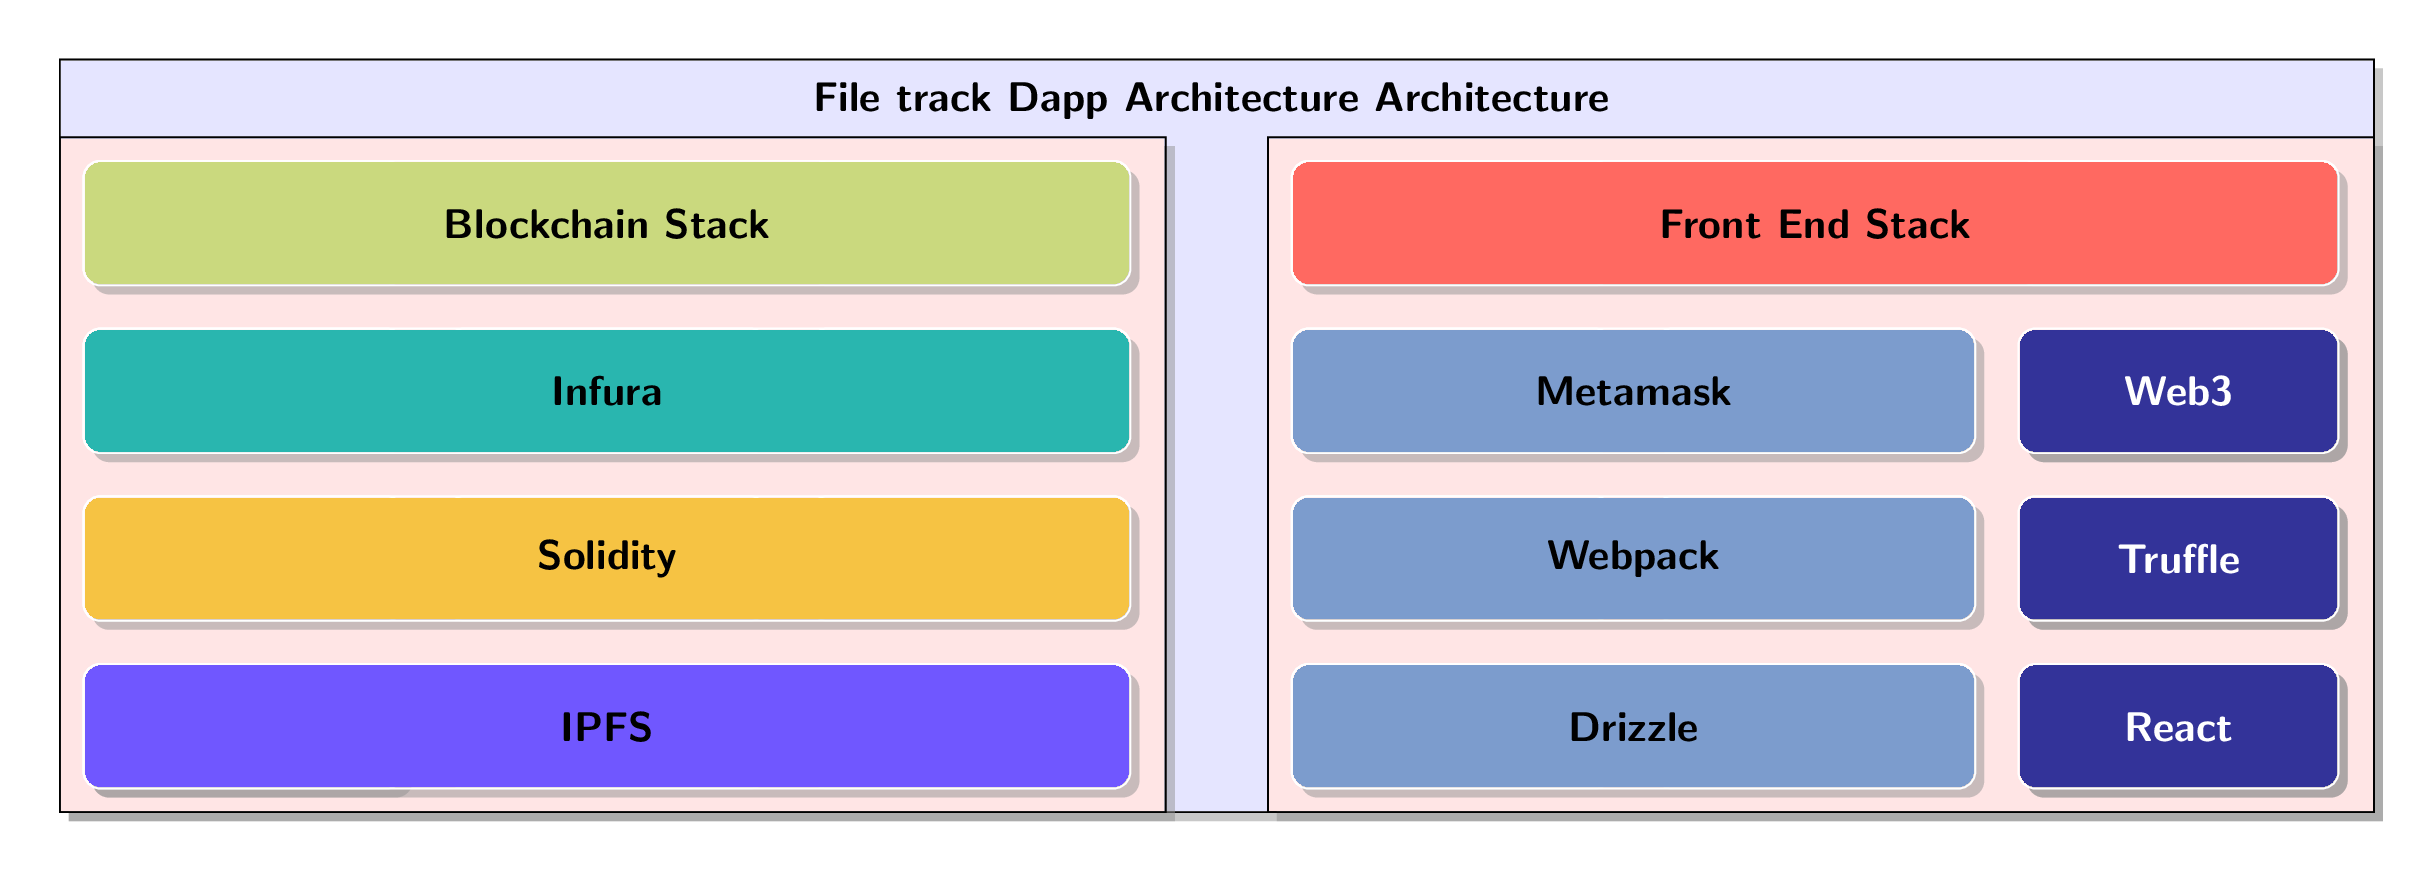
\documentclass[border=3mm]{standalone}
    \usepackage{tikz}
    \usetikzlibrary{backgrounds,shadows,positioning,fit,matrix,shapes.geometric, shapes.arrows} % add shadows #1

    % a way to cut shadows in a cell #2
    %https://tex.stackexchange.com/questions/129318/remove-drop-shadow-from-one-node
    \makeatletter
    \tikzset{no shadows/.code=\let\tikz@preactions\pgfutil@empty}
    \makeatother

    \tikzset{background/.style={rectangle, fill=red!10, inner sep=0.2cm},
              backgroundN/.style={rectangle, fill=white, inner sep=0.3cm},
              backgroundNN/.style={rectangle, fill=red!10, inner sep=0.2cm}}

	\tikzset{back/.style={rectangle, fill=blue!10, inner sep=0.2cm},
	              backgroundN/.style={rectangle, fill=white, inner sep=0.3cm},
	              backgroundNN/.style={rectangle, fill=red!10, inner sep=0.2cm}}

    \definecolor{mybluei}{RGB}{124,156,205}
    \definecolor{myblueii}{RGB}{73,121,193}
    \definecolor{mygreen}{RGB}{202,217,126}
    \definecolor{mypink}{RGB}{233,198,235}
    \definecolor{rinkeby}{HTML}{F6C343}
    \definecolor{kovan}{HTML}{7057ff}
    \definecolor{ropsten}{HTML}{FF4A8D}
    \definecolor{mainnet}{HTML}{29B6AF}
\definecolor{antiquefuchsia}{rgb}{0.57, 0.36, 0.51}
\definecolor{byzantium}{rgb}{0.44, 0.16, 0.39}
\definecolor{darkcandyapplered}{rgb}{0.64, 0.0, 0.0}
\definecolor{darkbyzantium}{rgb}{0.36, 0.22, 0.33}
\definecolor{jasper}{rgb}{0.84, 0.23, 0.24}
\definecolor{pastelred}{rgb}{1.0, 0.41, 0.38}
\definecolor{pinkpearl}{rgb}{0.91, 0.67, 0.81}
\definecolor{blue(pigment)}{rgb}{0.2, 0.2, 0.6}

    \newcommand\widernode[5][widebox]{
    \node[
        #1,
        fit={(#2) (#3)},
        label=center:{\sffamily\bfseries\color{black}#4}] (#5) {};
    }

    \begin{document}

    \begin{tikzpicture}[node distance=2pt,outer sep=0pt, % just do nothing after modification
    boxstyle/.style={
    draw=white,
    fill=#1,
    rounded corners, drop shadow, %to get a shadow in below a node
    font={\sffamily\bfseries\color{white}},
    align=center,
    minimum height=30pt
    },
    box/.style={
    boxstyle=#1,
    text width=2.5cm},
    box/.default=mybluei,
    title/.style={font={\sffamily\bfseries\color{black}}},
    widebox/.style={draw=white,inner sep=0pt, rounded corners,fill=#1,drop shadow},
    widebox/.default=mybluei,
    mylabel/.style={font={\sffamily\bfseries\color{black}}},
    database/.style={
      cylinder,
      cylinder uses custom fill,
      cylinder body fill=yellow!50,
      cylinder end fill=yellow!50,
      shape border rotate=90,
      aspect=0.25,
      draw
    }
    ]


    \matrix (stack) [%  boxstyle=mybluei!40,%will overpaint blocks with background
    column sep=10pt, row sep=10pt, inner sep=4mm,%
        matrix of nodes,
            nodes={box, outer sep=0pt, anchor=center, inner sep=3pt},%
            nodes in empty cells=false,% #3
        row 1/.style={nodes={fill=none,draw=none,minimum height=3mm}},
    ]
    {
    |[no shadows]| & & & [1cm] & & |[no shadows]| \\ % #5
    %RCP main & Authoring & Browsing & Publishing & Search&|[no shadows]| \\
    |[no shadows]| & & |[no shadows]| & |[no shadows]|&  &|[no shadows]| \\
     |[no shadows]|  &  |[no shadows]|  &  |[no shadows]|  &|[no shadows]| & |[no shadows]|& |[box=blue(pigment)]| Web3 \\
     |[no shadows]|& |[no shadows]| &|[no shadows]| & |[no shadows]| &|[no shadows]| & |[box=blue(pigment)]| Truffle \\
    ||[no shadows]| & |[no shadows]| & |[no shadows]| & |[no shadows]| & |[no shadows]| & |[box=blue(pigment)]| React \\};


    \widernode[]{stack-1-1}{stack-1-6}{File track Dapp Architecture Architecture}{EPF} %#5

	\widernode[widebox=mygreen]{stack-2-1}{stack-2-3}{Blockchain Stack}{SM}

	\widernode[widebox=pastelred]{stack-2-4}{stack-2-6}{Front End Stack}{FE}
	\widernode[widebox=mainnet]{stack-3-1}{stack-3-3}{Infura}{Ethereum}

    \widernode{stack-3-4}{stack-3-5}{Metamask}{MM}
  % \widernode{stack-3-6}{stack-3-6}{Web3}{AA}
  	\widernode[widebox=rinkeby]{stack-4-1}{stack-4-3}{Solidity}{Solidity}
    \widernode{stack-4-4}{stack-4-5}{Webpack}{BB}
  %  \widernode{stack-4-6}{stack-4-6}{Truffle}{CC}

    \widernode[widebox=kovan]{stack-5-1}{stack-5-3}{IPFS}{IPFS}
    \widernode{stack-5-4}{stack-5-5}{Drizzle}{DC}
  %  \widernode{stack-5-6}{stack-5-6}{React}{MC23}

    %\widernode[widebox=pinkpearl]{stack-4-1}{stack-4-1}{Exchanger}{UMA23}
    %\widernode[widebox=pinkpearl]{stack-4-2}{stack-4-3}{StoreFront}{UMA}
    %\widernode{stack-4-4}{stack-4-5}{Export/Import}{ExImp}
    %\widernode[widebox=pinkpearl]{stack-5-2}{stack-5-3}{ERC721}{EMF}
    %\widernode[widebox=mygreen]{stack-6-1}{stack-6-5}{RCP Runtime}{RCPrun}


%    \widernode[widebox, text width=1.5cm, align=center]{stack-2-6}{stack-3-6}{Normal text works}{NTWorks}
%

    %\node [fit={(stack.south west)(stack.south east)},boxstyle=myblueii,draw=black,inner sep=0pt,below=3pt of stack.south,anchor=north,label={[mylabel]center:Java Runtime}] (JavaR) {};

%
%

%

		\begin{pgfonlayer}{background}
		        \coordinate (aux) at ([xshift=1mm]stack-5-6.east);
		            \node [back,
		                fit=(stack-1-1) (stack-5-1) (aux), draw, drop shadow,
		            ] {};
		            %\node [backgroundN,
		            %    fit=(stack-3-5) ] {};
		            %\node [backgroundNN,draw, drop shadow,
		            %    fit=(stack-3-5) ] {};
	   \end{pgfonlayer}

	   %    % smth to create an arbitrary block with a border and shadow
	   %Background for smart contracts
	           \begin{pgfonlayer}{background}
	           \coordinate (aux) at ([xshift=1mm]stack-5-3.east);
	               \node [background,
	                   fit=(stack-2-1) (stack-5-1) (aux), draw, drop shadow,
	               ] {};
	               %\node [backgroundN,
	               %    fit=(stack-3-5) ] {};
	               %\node [backgroundNN,draw, drop shadow,
	               %    fit=(stack-3-5) ] {};
	           \end{pgfonlayer}

       \begin{pgfonlayer}{background}
       \coordinate (aux) at ([xshift=1mm]stack-5-6.east);
           \node [background,
               fit=(stack-2-4) (stack-5-4) (aux), draw, drop shadow,
           ] {};
           %\node [backgroundN,
           %    fit=(stack-3-5) ] {};
           %\node [backgroundNN,draw, drop shadow,
           %    fit=(stack-3-5) ] {};
       \end{pgfonlayer}
    \end{tikzpicture}

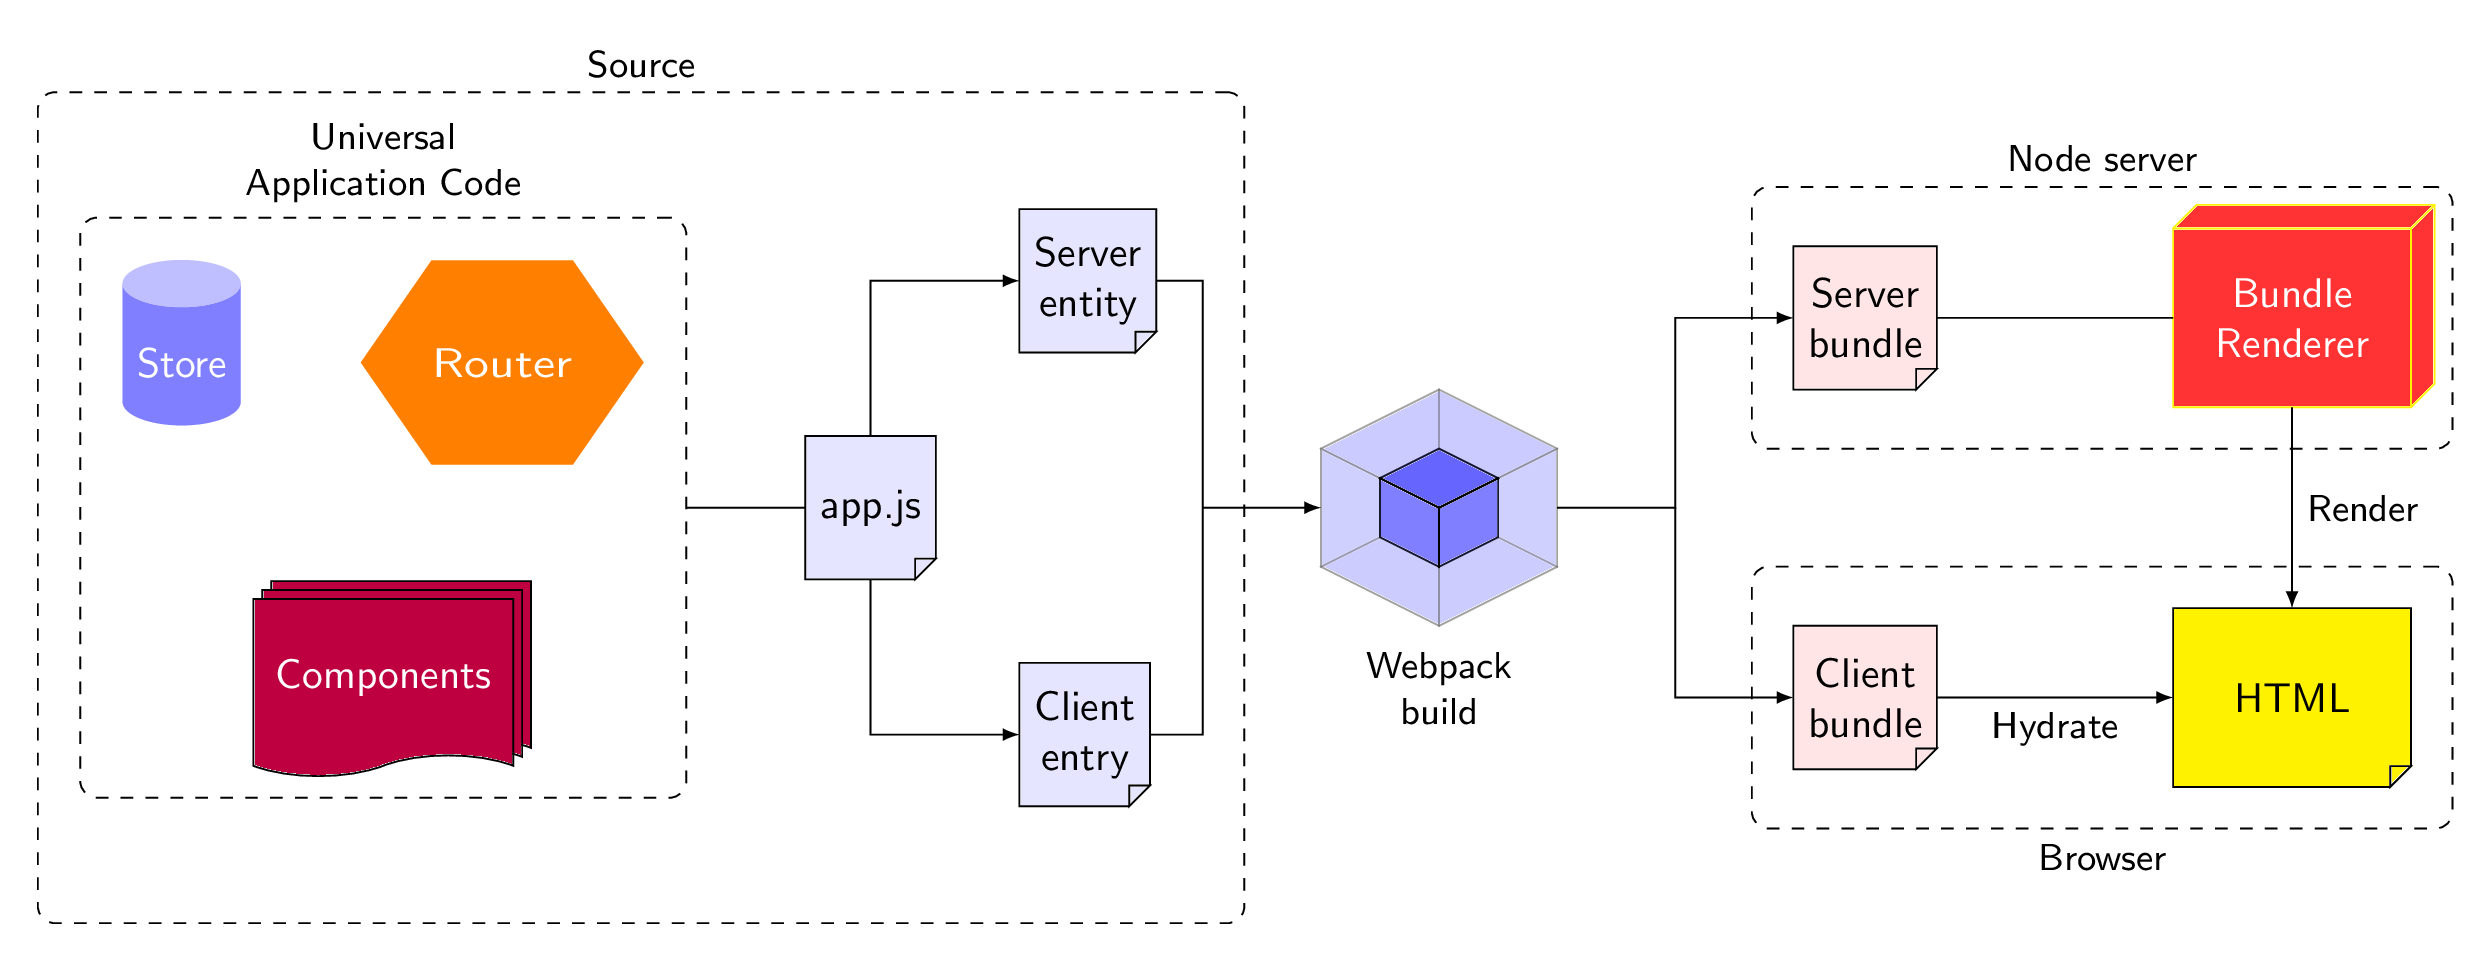
\end{document}\documentclass[tikz,border=3.14mm]{standalone}
\usetikzlibrary{shapes.geometric,shapes.symbols,fit,positioning,shadows}
% https://tex.stackexchange.com/a/12039/121799
\makeatletter
\pgfkeys{/pgf/.cd,
parallelepiped offset x/.initial=2mm,
parallelepiped offset y/.initial=2mm
}
\pgfdeclareshape{parallelepiped}
{
\inheritsavedanchors[from=rectangle] % this is nearly a rectangle
\inheritanchorborder[from=rectangle]
\inheritanchor[from=rectangle]{north}
\inheritanchor[from=rectangle]{north west}
\inheritanchor[from=rectangle]{north east}
\inheritanchor[from=rectangle]{center}
\inheritanchor[from=rectangle]{west}
\inheritanchor[from=rectangle]{east}
\inheritanchor[from=rectangle]{mid}
\inheritanchor[from=rectangle]{mid west}
\inheritanchor[from=rectangle]{mid east}
\inheritanchor[from=rectangle]{base}
\inheritanchor[from=rectangle]{base west}
\inheritanchor[from=rectangle]{base east}
\inheritanchor[from=rectangle]{south}
\inheritanchor[from=rectangle]{south west}
\inheritanchor[from=rectangle]{south east}
\backgroundpath{
% store lower right in xa/ya and upper right in xb/yb
\southwest \pgf@xa=\pgf@x \pgf@ya=\pgf@y
\northeast \pgf@xb=\pgf@x \pgf@yb=\pgf@y
\pgfmathsetlength\pgfutil@tempdima{\pgfkeysvalueof{/pgf/parallelepiped offset x}}
\pgfmathsetlength\pgfutil@tempdimb{\pgfkeysvalueof{/pgf/parallelepiped offset y}}
\def\ppd@offset{\pgfpoint{\pgfutil@tempdima}{\pgfutil@tempdimb}}
\pgfpathmoveto{\pgfqpoint{\pgf@xa}{\pgf@ya}}
\pgfpathlineto{\pgfqpoint{\pgf@xb}{\pgf@ya}}
\pgfpathlineto{\pgfqpoint{\pgf@xb}{\pgf@yb}}
\pgfpathlineto{\pgfqpoint{\pgf@xa}{\pgf@yb}}
\pgfpathclose
\pgfpathmoveto{\pgfqpoint{\pgf@xb}{\pgf@ya}}
\pgfpathlineto{\pgfpointadd{\pgfpoint{\pgf@xb}{\pgf@ya}}{\ppd@offset}}
\pgfpathlineto{\pgfpointadd{\pgfpoint{\pgf@xb}{\pgf@yb}}{\ppd@offset}}
\pgfpathlineto{\pgfpointadd{\pgfpoint{\pgf@xa}{\pgf@yb}}{\ppd@offset}}
\pgfpathlineto{\pgfqpoint{\pgf@xa}{\pgf@yb}}
\pgfpathmoveto{\pgfqpoint{\pgf@xb}{\pgf@yb}}
\pgfpathlineto{\pgfpointadd{\pgfpoint{\pgf@xb}{\pgf@yb}}{\ppd@offset}}
}
}
% https://tex.stackexchange.com/a/103691/121799
\pgfdeclareshape{document}{
\inheritsavedanchors[from=rectangle] % this is nearly a rectangle
\inheritanchorborder[from=rectangle]
\inheritanchor[from=rectangle]{center}
\inheritanchor[from=rectangle]{north}
\inheritanchor[from=rectangle]{north east}
\inheritanchor[from=rectangle]{north west}
\inheritanchor[from=rectangle]{south}
\inheritanchor[from=rectangle]{south east}
\inheritanchor[from=rectangle]{south west}
\inheritanchor[from=rectangle]{west}
\inheritanchor[from=rectangle]{east}
\backgroundpath{%
\southwest \pgf@xa=\pgf@x \pgf@ya=\pgf@y
\northeast \pgf@xb=\pgf@x \pgf@yb=\pgf@y
\pgf@xc=\pgf@xb \advance\pgf@xc by-5pt % this should be a parameter
\pgf@yc=\pgf@ya \advance\pgf@yc by5pt
\pgfpathmoveto{\pgfpoint{\pgf@xa}{\pgf@ya}}
\pgfpathlineto{\pgfpoint{\pgf@xa}{\pgf@yb}}
\pgfpathlineto{\pgfpoint{\pgf@xb}{\pgf@yb}}
\pgfpathlineto{\pgfpoint{\pgf@xb}{\pgf@yc}}
\pgfpathlineto{\pgfpoint{\pgf@xc}{\pgf@ya}}
\pgfpathclose
% add little corner
\pgfpathmoveto{\pgfpoint{\pgf@xc}{\pgf@ya}}
\pgfpathlineto{\pgfpoint{\pgf@xc}{\pgf@yc}}
\pgfpathlineto{\pgfpoint{\pgf@xb}{\pgf@yc}}
\pgfpathclose
}
}
\makeatother
\begin{document}
\tikzset{doc/.style={document,fill=blue!10,draw,thin,minimum
height=1.2cm,align=center},
pics/.cd,
pack/.style={code={%
\draw[fill=blue!50,opacity=0.2] (0,0) -- (0.5,-0.25) -- (0.5,0.25) -- (0,0.5) -- cycle;
\draw[fill=blue!50,opacity=0.2] (0,0) -- (-0.5,-0.25) -- (-0.5,0.25) -- (0,0.5) -- cycle;
\draw[fill=blue!60,opacity=0.2] (0,0) -- (-0.5,-0.25) -- (0,-0.5) -- (0.5,-0.25) -- cycle;
\draw[fill=blue!60] (0,0) -- (0.25,0.125) -- (0,0.25) -- (-0.25,0.125) -- cycle;
\draw[fill=blue!50] (0,0) -- (0.25,0.125) -- (0.25,-0.125) -- (0,-0.25) -- cycle;
\draw[fill=blue!50] (0,0) -- (-0.25,0.125) -- (-0.25,-0.125) -- (0,-0.25) -- cycle;
\draw[fill=blue!50,opacity=0.2] (0,-0.5) -- (0.5,-0.25) -- (0.5,0.25) -- (0,0) -- cycle;
\draw[fill=blue!50,opacity=0.2] (0,-0.5) -- (-0.5,-0.25) -- (-0.5,0.25) -- (0,0) -- cycle;
\draw[fill=blue!60,opacity=0.2] (0,0.5) -- (-0.5,0.25) -- (0,0) -- (0.5,0.25) -- cycle;
}}}
\begin{tikzpicture}[font=\sffamily,every label/.append
style={font=\small\sffamily,align=center}]
\node[cylinder, cylinder uses custom fill, cylinder end fill=blue!25,
cylinder body fill=blue!50,shape border rotate=90,text=white,
aspect=0.4,minimum width=1cm,minimum height=1.4cm](Store){Store};
\node[right=1cm of Store,regular polygon,regular polygon sides=6,fill=orange,
xscale=1.2,text=white] (Router) {Router};
\node[fit=(Store) (Router)](fit1){};
\node[below=1cm of fit1,tape, draw,thin, tape bend top=none,fill=purple,
text=white,minimum width=2.2cm,double copy shadow,minimum height=1.5cm]
(Components) {Components};
\node[draw,dashed,rounded corners,fit=(Store) (Router) (Components),inner
sep=10pt,label={above:{Universal\\ Application Code}}](fit2){};
\node[right=1cm of fit2,doc] (js) {app.js};
\node[above right=1cm of js,doc] (Server) {Server\\ entity};
\node[below right=1cm of js,doc] (Client) {Client\\ entry};
\draw(fit2.east) -- (js);
\draw[-latex] (js) |- (Server);
\draw[-latex] (js) |- (Client);
\draw[-] (Client) -- ++ (1,0) |- (Server) coordinate[pos=0.25] (aux1);
\node[draw,dashed,rounded corners,fit=(fit2) (aux1),inner
xsep=10pt,inner ysep=30pt,label={above:{Source}}](fit3){};
%
\pic[right=2cm of aux1,local bounding box=Webpack,scale=2] (Webpack) {pack};
\node[below=1mm of Webpack,font=\small\sffamily,align=center]{Webpack\\ build};
%
\node[above right=1cm and 2cm of Webpack.east,doc,fill=red!10] (ServerBundle)
{Server\\ bundle};
\node[below right=1cm and 2cm of Webpack.east,doc,fill=red!10] (ClientBundle) {Client\\
bundle};
\node[right=2cm of ServerBundle,parallelepiped,draw=yellow,fill=red!80,
minimum width=2cm,minimum height=1.5cm,align=center,text=white]
(BundleRenderer) {Bundle\\ Renderer};
\node[right=2cm of ClientBundle,doc,fill=yellow,minimum width=2cm,minimum height=1.5cm] (HTML) {HTML};
\draw[-latex] (aux1) -- (Webpack);
\draw[-latex] (Webpack) -- ++ (2,0) coordinate(aux2) |- (ServerBundle);
\draw[-latex] (aux2) |- (ClientBundle);
\draw[-latex] (ClientBundle) -- (HTML) node[midway,below,font=\small\sffamily]{Hydrate};
\draw (ServerBundle) -- (BundleRenderer);
\draw[-latex] (BundleRenderer) -- (HTML) node[midway,right,font=\small\sffamily]{Render};
%
\node[draw,dashed,rounded corners,fit=(ServerBundle) (BundleRenderer),inner
sep=10pt,label={above:{Node server}}](fit4){};
\node[draw,dashed,rounded corners,fit=(ClientBundle) (HTML),inner
sep=10pt,label={below:{Browser}}](fit5){};
\end{tikzpicture}
\end{document}\documentclass{standalone}
\usepackage{blox}
\usepackage{tikz}
\usetikzlibrary{positioning}
\begin{document}
\begin{tikzpicture}
%\bXLineStyle{red, dotted}
\bXLineStyle{very thick}
\bXInput{A}
\bXComp{B}{A}
\bXLink[R]{A}{B}
\bXCompa{C}{B}
\bXLink{B}{C}
\bXSumb{D}{C}
\bXLink{C}{D}
\bXBloc[2]{E}{$G_1$}{D}
\bXLink{D}{E}
\bXBloc[2]{F}{$G_2$}{E}
\bXLink{E}{F}
\bXBranchx[5]{F}{FX1}
\bXBranchy[5]{FX1}{FDown1}
\draw[-,very thick] (F) -- (FX1.center);
\draw[-,very thick] (FX1.center) -- (FDown1.center);
\bXBranchx[-5.5]{FDown1}{FRight1}
\draw[->,very thick] (FDown1.center) -- (FRight1.center);
\bXBloc[-3.5]{H1}{$H_1$}{FRight1}
\bXBranchy[5]{D}{DDown1}
\draw[->,very thick] (DDown1.center) -- (D);
\draw[-,very thick] (H1) -- (DDown1.center);
\bXBloc[2]{G}{$G_3$}{FX1}
%\draw[-,very thick] (F) -- (FX1);
\draw[->,very thick] (F) -- (G);
\bXBranchx[3]{G}{GX1}
\bXBranchx[3]{GX1}{GX2}
\draw[-,very thick] (G) -- (GX2);
\bXBranchx[3]{GX2}{GX3}
\bXBranchy[-5]{GX2}{GUp1}
\bXBranchx[1.5]{GX2}{GX4}
\bXBranchy[7.5]{GX4}{GDown1}
%\draw[-,very thick] (G) -- (GX1.center);
%\draw[-,very thick] (G) -- (GX1.center);
%\draw[-,very thick] (GX1.center) -- (GUp1.center);
%\bXLinkxy{GX1}{GUp1}
\draw[-,very thick] (GX1.center) -- (GX2.center);
\draw[-,very thick] (GX2.center) -- (GUp1.center);
\draw[->,very thick] (GX2.center) -- (GX3.center);
\node[right = 0.05cm of GX3] (end) {$C$};
\draw[-,very thick] (GX4.center) -- (GDown1.center);
\bXBranchy[7.5]{B}{BDown1}
\bXLink{BDown1.center}{B}
\draw[-,very thick] (GDown1.center) -- (BDown1.center);
%% Top Part
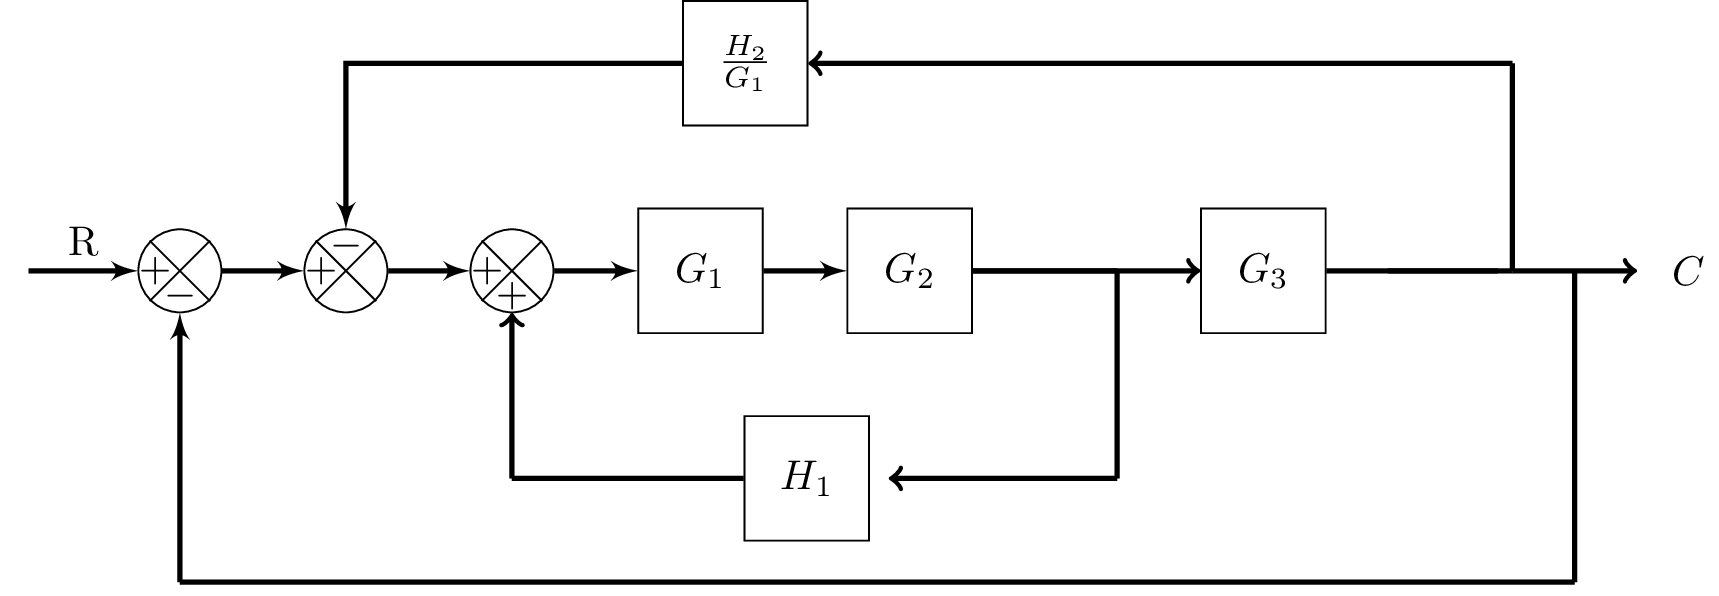
\bXBranchx[-20]{GUp1}{GLUp1}
\bXBloc[-0]{BlockHG}{$\frac{H_2}{G_1}$}{GLUp1}
\draw[->,very thick] (GUp1.center) -- (BlockHG);
\bXLinkxy{BlockHG}{C}
\end{tikzpicture}
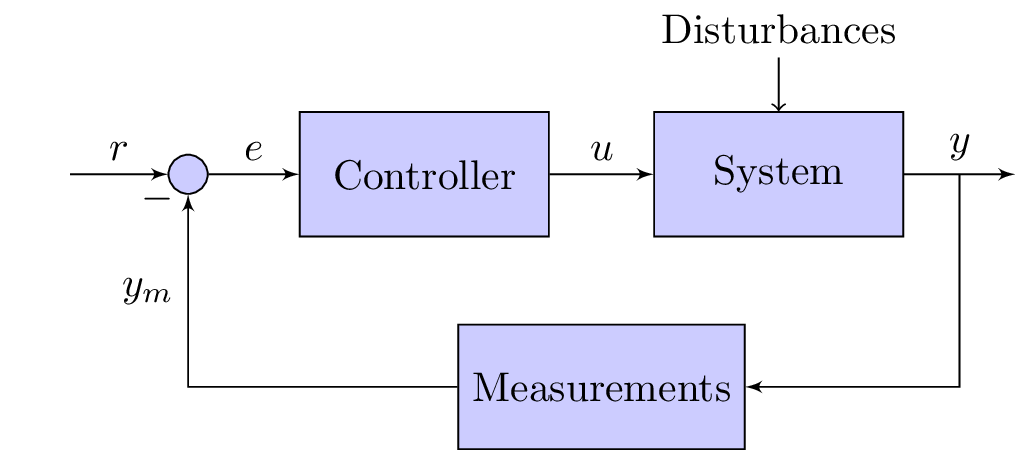
\end{document}\documentclass{standalone}
\usepackage{tikz}
\usetikzlibrary{shapes,arrows}
\begin{document}
\tikzstyle{block} = [draw, fill=blue!20, rectangle,
minimum height=3em, minimum width=6em]
\tikzstyle{sum} = [draw, fill=blue!20, circle, node distance=1cm]
\tikzstyle{input} = [coordinate]
\tikzstyle{output} = [coordinate]
\tikzstyle{pinstyle} = [pin edge={to-,thin,black}]
% The block diagram code is probably more verbose than necessary
\begin{tikzpicture}[auto, node distance=2cm,>=latex']
% We start by placing the blocks
\node [input, name=input] {};
\node [sum, right of=input] (sum) {};
\node [block, right of=sum] (controller) {Controller};
\node [block, right of=controller, pin={[pinstyle]above:Disturbances},
node distance=3cm] (system) {System};
% We draw an edge between the controller and system block to
% calculate the coordinate u. We need it to place the measurement block.
\draw [->] (controller) -- node[name=u] {$u$} (system);
\node [output, right of=system] (output) {};
\node [block, below of=u] (measurements) {Measurements};
% Once the nodes are placed, connecting them is easy.
\draw [draw,->] (input) -- node {$r$} (sum);
\draw [->] (sum) -- node {$e$} (controller);
\draw [->] (system) -- node [name=y] {$y$}(output);
\draw [->] (y) |- (measurements);
\draw [->] (measurements) -| node[pos=0.99] {$-$}
node [near end] {$y_m$} (sum);
\end{tikzpicture}
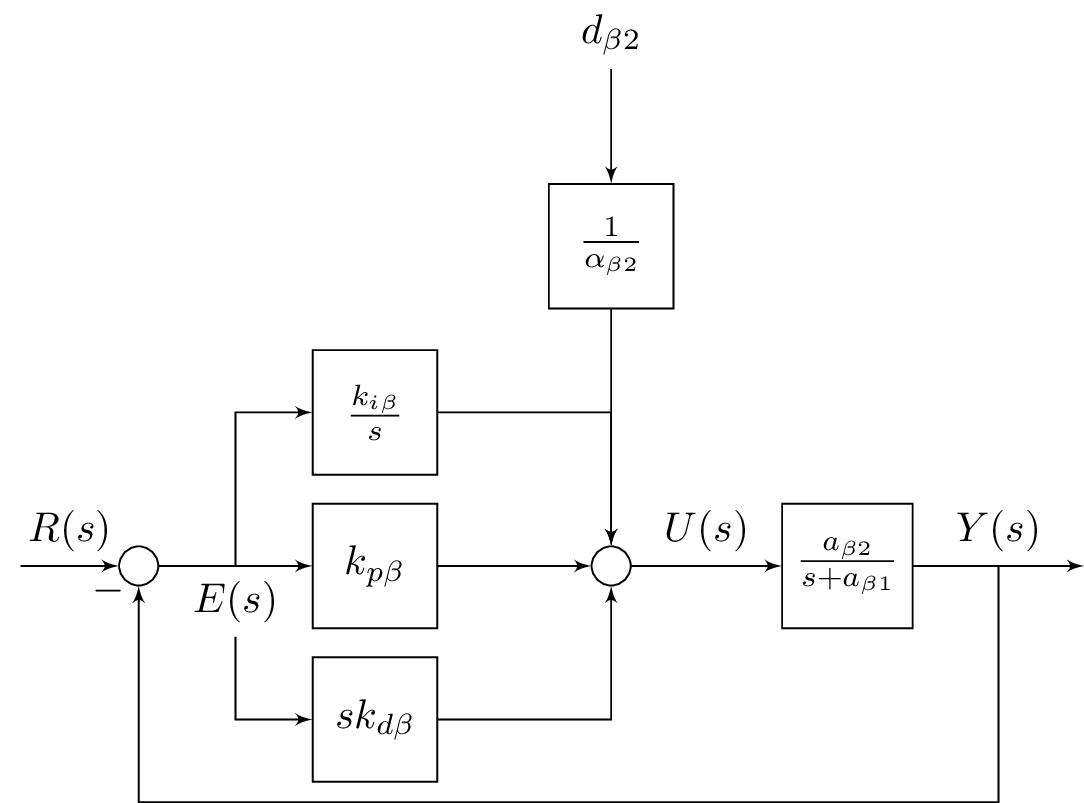
\end{document}\documentclass{standalone}
\usepackage{tikz}
\usetikzlibrary{shapes,arrows,positioning,calc}
\begin{document}
\tikzset{
block/.style = {draw, fill=white, rectangle, minimum height=3em, minimum width=3em},
tmp/.style = {coordinate},
sum/.style= {draw, fill=white, circle, node distance=1cm},
input/.style = {coordinate},
output/.style= {coordinate},
pinstyle/.style = {pin edge={to-,thin,black}
}
}
%\begin{figure}[!htb]
%\centering
\begin{tikzpicture}[auto, node distance=2cm,>=latex']
\node [input, name=rinput] (rinput) {};
\node [sum, right of=rinput] (sum1) {};
\node [block, right of=sum1] (controller) {$k_{p\beta}$};
\node [block, above of=controller,node distance=1.3cm] (up){$\frac{k_{i\beta}}{s}$};
\node [block, below of=controller,node distance=1.3cm] (rate) {$sk_{d\beta}$};
\node [sum, right of=controller,node distance=2cm] (sum2) {};
\node [block, above = 2cm of sum2](extra){$\frac{1}{\alpha_{\beta2}}$}; %
\node [block, right of=sum2,node distance=2cm] (system)
{$\frac{a_{\beta 2}}{s+a_{\beta 1}}$};
\node [output, right of=system, node distance=2cm] (output) {};
\node [tmp, below of=controller] (tmp1){$H(s)$};
\draw [->] (rinput) -- node{$R(s)$} (sum1);
\draw [->] (sum1) --node[name=z,anchor=north]{$E(s)$} (controller);
\draw [->] (controller) -- (sum2);
\draw [->] (sum2) -- node{$U(s)$} (system);
\draw [->] (system) -- node [name=y] {$Y(s)$}(output);
\draw [->] (z) |- (rate);
\draw [->] (rate) -| (sum2);
\draw [->] (z) |- (up);
\draw [->] (up) -| (sum2);
\draw [->] (y) |- (tmp1)-| node[pos=0.99] {$-$} (sum1);
\draw [->] (extra)--(sum2);
\draw [->] ($(0,1.5cm)+(extra)$)node[above]{$d_{\beta 2}$} -- (extra);
\end{tikzpicture}
%\caption{A PID Control System} \label{fig6_10}
%\end{figure}
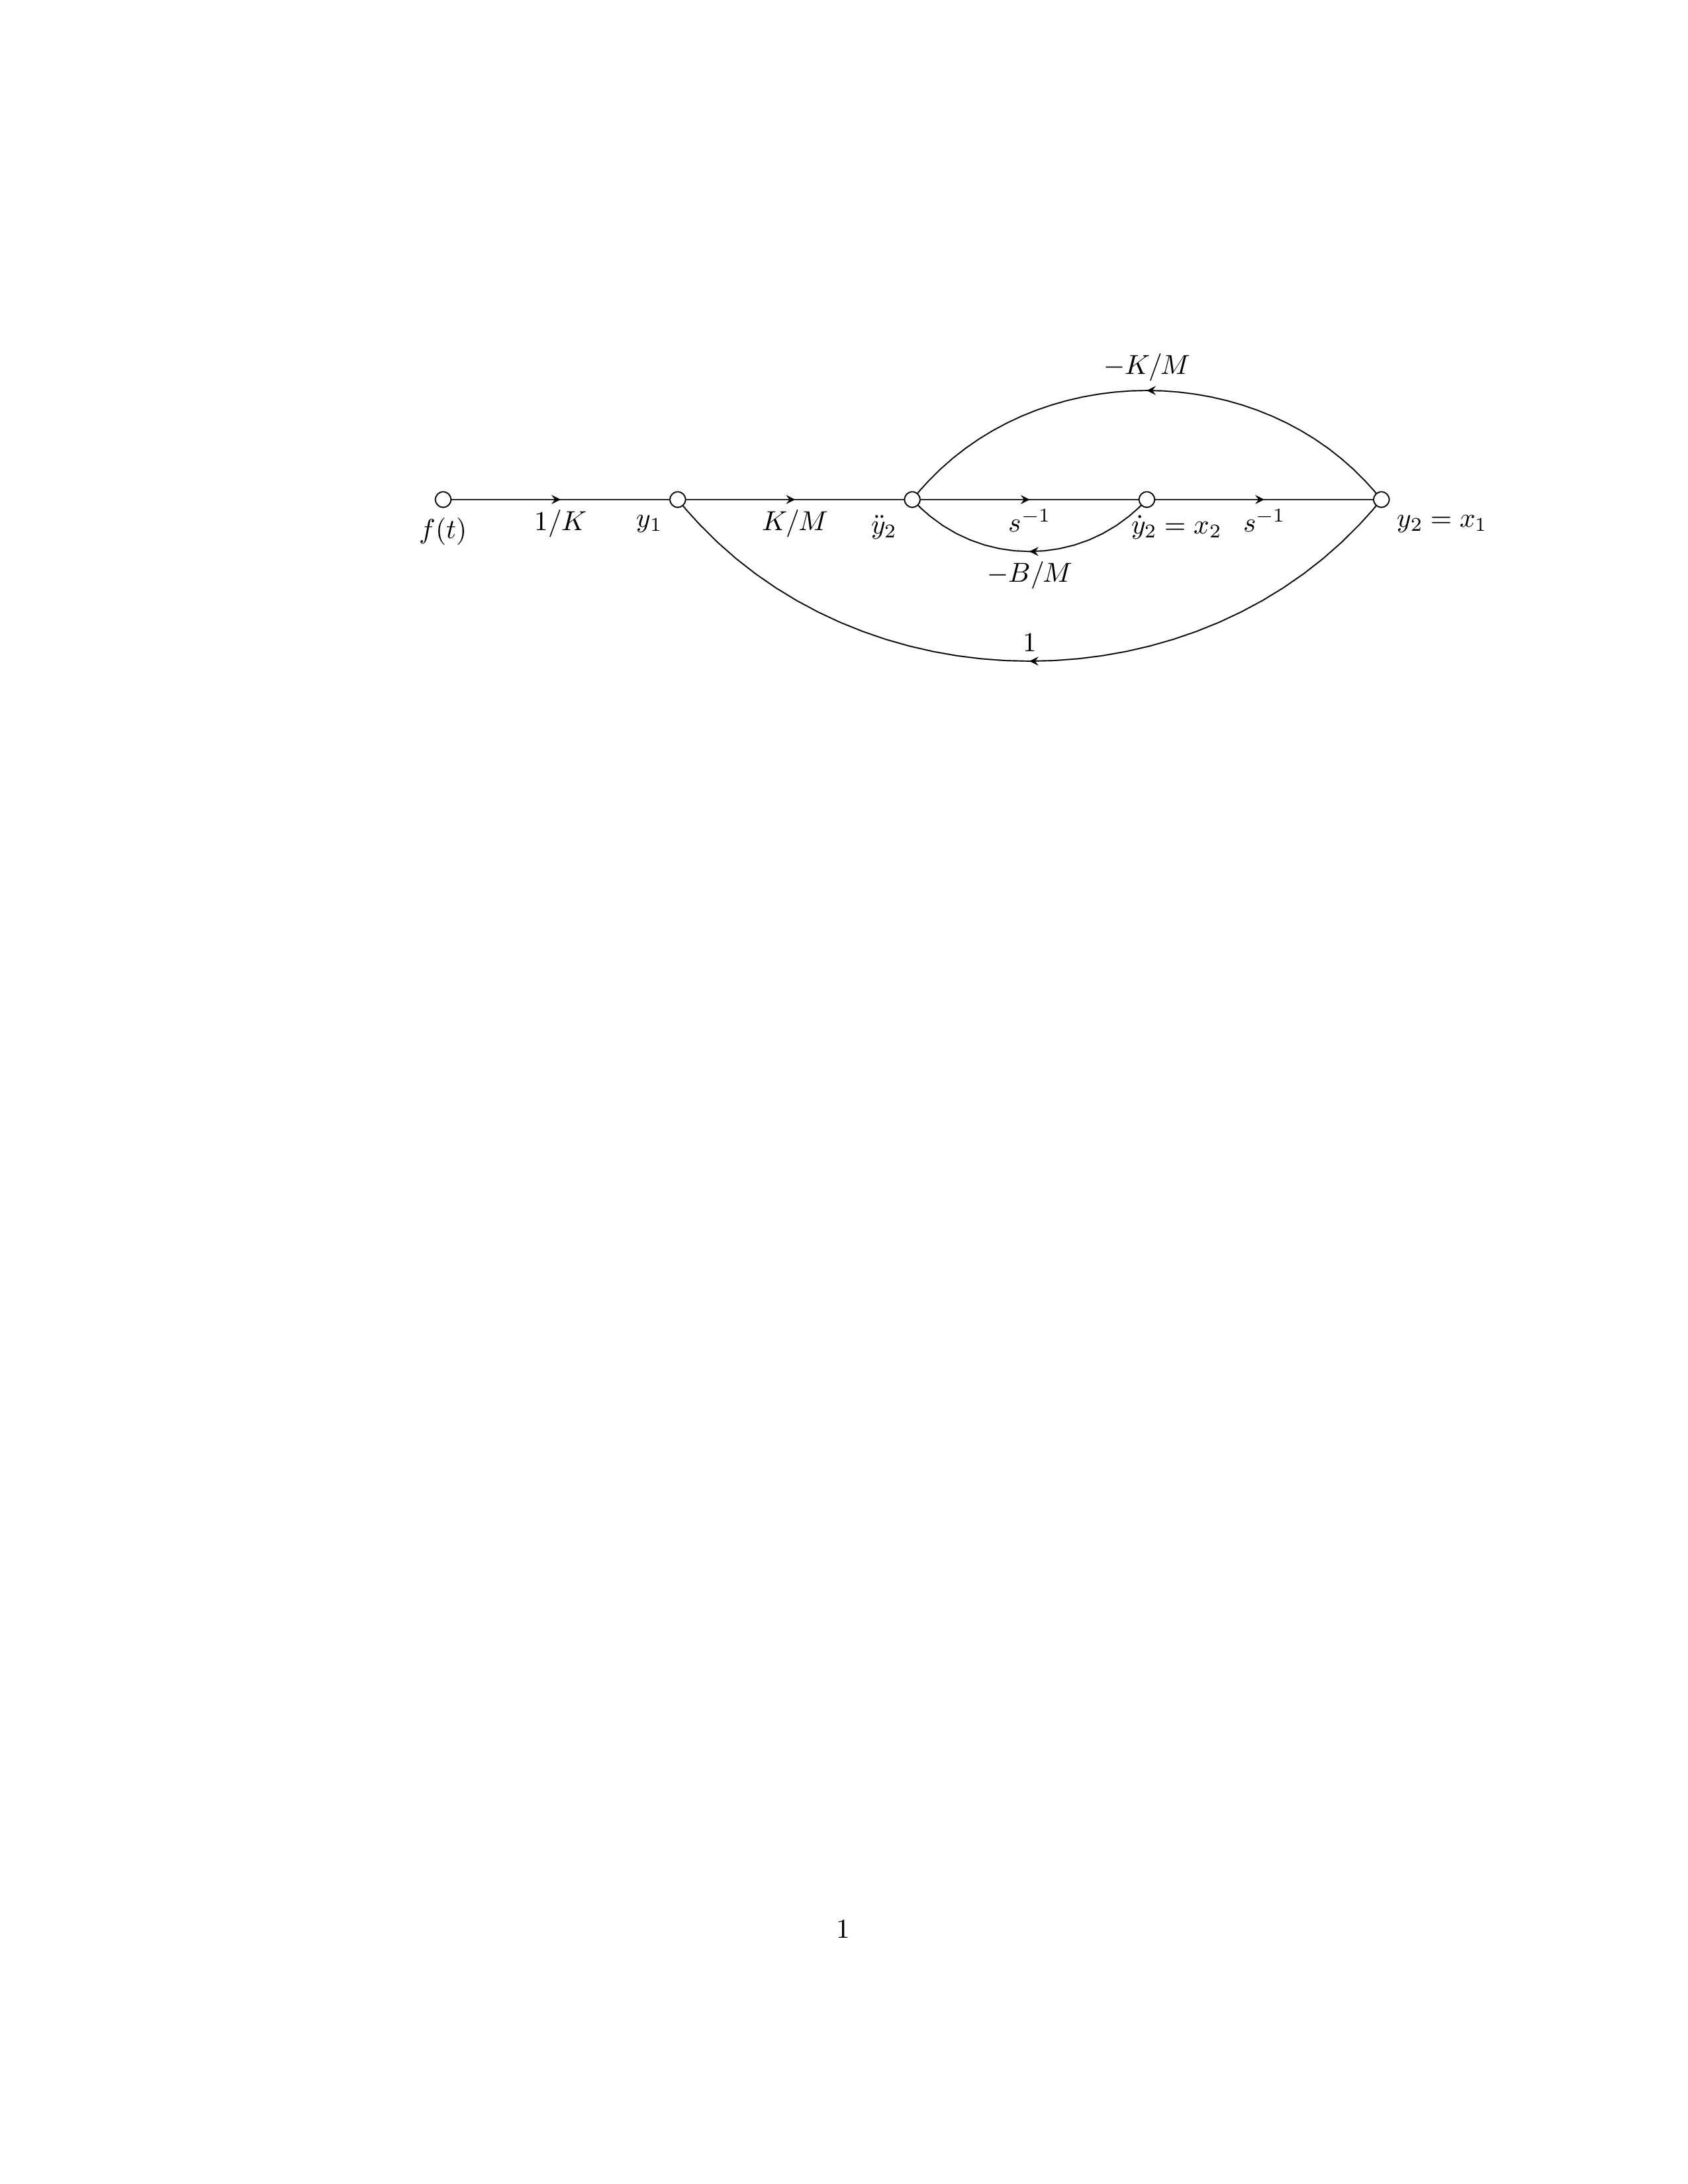
\end{document}\documentclass{article}
\usepackage{tikz}
\usetikzlibrary{decorations.markings}
\newif\iflabrev
\begin{document}
\begin{tikzpicture}
[
label revd/.is if=labrev,
%label revd/.default=true,
amark/.style={
decoration={
markings,
mark=at position {0.5} with {
\arrow{stealth},
\iflabrev \node[above] {#1};\else \node[below] {#1};\fi
}
},
postaction={decorate}
},
terminal/.style 2 args={draw,circle,inner sep=2pt,label={#1:#2}},
]
%Place the nodes
\node[terminal={below}{$f(t)$}] (a) at (0,0) {};
\node[terminal={below left}{$y_1$}] (b) at (3cm,0) {};
\node[terminal={below left}{$\ddot{y}_2$}] (c) at (6cm,0) {};
\node[terminal={[xshift=-4mm]below right}{$\dot{y}_2=x_2$}] (d) at (9cm,0) {};
\node[terminal={below right}{$y_2=x_1$}] (e) at (12cm,0) {};
%Draw the connections
\draw[amark=$1/K$] (a) to (b);
\draw[amark=$K/M$] (b) to (c);
\draw[amark=$s^{-1}$] (c) to (d);
\draw[amark=$s^{-1}$] (d) to (e);
\draw[amark=$-B/M$] (d) to[bend left=45] (c);
\draw[amark=$1$,label revd] (e) to[bend left=50] (b);
\draw[amark=$-K/M$,label revd] (e) to[bend right=50] (c);
\end{tikzpicture}
\end{document}\documentclass[11pt]{article}
\pagestyle{empty}
\begin{document}
\begin{center}
\large{\bf MATH0003 Integration \& Differential Equations}
\normalsize
\bigskip
{\bf Partial Fractions} (Anton section 9.5)
\end{center}
\medskip
\noindent
{\bf Definition:} a {\em rational function}
is a function of the form $P(x)/Q(x)$,
where $P$ and $Q$ are polynomials.
A {\em proper} rational function is a rational function
with the degree of $P$ less than the degree of $Q$.
\medskip
\noindent
Proper rational functions are usually integrated
by splitting them up into {\em partial fractions}.
\medskip
\noindent
{\bf Theorem (partial fractions):} every proper rational function
may be expressed in the form
\[
\frac{P(x)}{Q(x)} = F_1(x) + F_2(x) + \cdots + F_n(x),
\]
where the $F_i(x)$ are rational functions of the form
\[
\frac{A}{(ax+b)^k} \;\; {\rm or} \;\; \frac{Ax+B}{(ax^2+bx+c)^k},
\]
in which the denominators are factors of $Q$.
The sum is called the partial fraction decomposition of $P(x)/Q(x)$,
and the $F_i(x)$ are called partial fractions.
\medskip
\noindent
Q1. How do we find the {\em form} of the partial fraction decomposition?
\noindent
Q2. How do we determine the coefficients?
\medskip
\noindent
{\bf Linear Factor Rule.}
For each factor of $Q$ of the form $(ax+b)^m$,
the partial fraction decomposition contains
the following sum of $m$ partial fractions:
\[
\frac{A_1}{ax+b} + \frac{A_2}{(ax+b)^2} + \cdots + \frac{A_m}{(ax+b)^m},
\]
where the $A_i$ are constants to be determined.
\medskip
\noindent
{\bf Quadratic Factor Rule.}
For each factor of $Q$ of the form $(ax^2+bx+c)^m$,
where $ax^2+bx+c$ is an irreducible quadratic,
the partial fraction decomposition contains
the following sum of $m$ partial fractions:
\[
\frac{A_1x+B_1}{ax^2+bx+c} + \frac{A_2x+B_2}{(ax^2+bx+c)^2} + \cdots
+ \frac{A_mx+B_m}{(ax^2+bx+c)^m},
\]
where the $A_i$ and $B_i$ are constants to be determined.
\end{document}
\documentclass{standalone}
\usepackage{tikz}
\usetikzlibrary{shapes.misc}
\begin{document}
\begin{tikzpicture}

% Axes:
\draw [-latex] (-5,0) -- (2.5,0) node [above left]  {$\sigma$};
\draw [-latex] (0,-1) -- (0,4) node [below right] {$j\omega_d$};
\node[cross out,draw=black] at (0,0) {};
%\draw[dashed] (0,0) -- node[pos=0.8, above right] {$\omega_p$}(145:6) node[solid, cross out,draw=black] {};
%\draw[red, -stealth] (0,2) arc (90:145:2);

%\draw[dashed] (0,0) -- node[pos=0.8, above right] {$\omega_z$}(125:3.5) node[solid, fill=white, circle,draw=black] {};
%\draw[dashed] (0,0) -- node[pos=0.8, above right] {$\omega_z$}(125:3.5) node[solid, cross out,draw=black] {};
\draw[dashed] (0,0) -- (125:3.5) node[solid, cross out,draw=black] {};
\draw[black, -stealth] (1.75,0) node[pos=0.1,above right] {$\theta=120^o$} arc (0:125:1.75);

%\draw[dashed]  (-5,0) node[below left] {$-\xi_p\omega_p$} --  (-5,-3) node[solid, cross out,draw=black] {};
%\draw[dashed]  (-2,0) node[below left] {$-\xi_z\omega_z$} --  (-2,-3) node[solid, fill=white, circle,draw=black] {};
%\draw[dashed]  (-2,0) node[below left] {$-\xi$} -- (-2,2.85);
%\draw[dashed]  (0,2.85) node[below left] {$\omega_n$} -- (-2,2.85);
\draw[dashed]  (-2,0) node[below left] {$-2$} -- (-2,2.867);
\draw[dashed]  (0,2.867) node[below left] {$j2\sqrt{(3)}$} -- (-2,2.867);
\draw[dashed]  (125:3.5) -- (-4,0) node[solid, cross out,draw=black] {};
\draw (-4,0) node [below left] {-4};
\draw[black, -stealth] (-2,2)  arc (0:-180:0.3);
\draw (-3,2.25)node[] {$\theta=30^o$};
\end{tikzpicture}


\end{document}
\documentclass{standalone}
\usepackage{amsmath}  % For math
\usepackage{amssymb}  % For more math

\usepackage{blox}
\usepackage{tikz}
\begin{document}
\begin{tikzpicture}
\bXInput{A}
\bXComp{B}{A}
\bXLink[$R(s)$]{A}{B}
\bXBloc[2]{C}{$\displaystyle G(s)$}{B}
\bXLink{B}{C}
\bXOutput[4]{E}{C}
\bXLink[$C(s)$]{C}{E}
\bXReturn{C-E}{B}{}
\end{tikzpicture}

\end{document}\documentclass{standalone}
\usepackage{amsmath} % For math
\usepackage{amssymb} % For more math
\usepackage{blox}
\usepackage{tikz}
\begin{document}
\begin{tikzpicture}
\bXInput{A}
\bXComp{B}{A}
\bXLink[$R(s)$]{A}{B}
\bXBloc[2]{C}{$K\cfrac{s+1}{s+5}$}{B}
%\bXLink[$V_1$]{B}{C}
\bXLink{B}{C}
\bXBloc[2]{D}{$\cfrac{2}{s^2(s+2)}$}{C}
\bXLink{C}{D}
\bXOutput[4]{E}{D}
\bXLink[$C(s)$]{D}{E}
\bXReturn{D-E}{B}{}
\end{tikzpicture}
\end{document}\documentclass{standalone}
\usepackage[american]{circuitikz}
\usepackage{graphicx}
\usepackage{mathrsfs}
\usepackage{latexsym,amssymb,amsmath}
\newcommand{\equal}{=}
\begin{document}
\begin{circuitikz}
%\draw (0,4) to [open,v^>=$v_1(t)$,o-o] (0,0) -- Open Short
\draw (0,3) to [open,l=$e_i$,o-o] (0,0) % input
(0,3) to [R, l^= $R_1$,-*] (3,3) %R1
(3,3) to [L, l^= $L$,-*] (3,0) %C1
(3,3) to [R, l^= $R_2$,-* ] (6,3) %R2
(6,3) to [C, l^= $C$,-*] (6,0) %C2
(8,3) to [open,l_=$e_o$,o-o] (8,0) % output
(0,0) -- (8,0) % wire in bottom
(6,3) -- (8,3) % wire to output
;
% Current flows in tikz
\draw[thin, <-, >=triangle 45] (1.5,1.5) node{$i_1$} ++(-90:0.75) arc (-90:100:0.75);
\draw[thin, <-, >=triangle 45] (4.5,1.5) node{$i_2$} ++(-90:0.75) arc (-90:100:0.75);
% \node (phi) at (4.25,0.5) {$i_2$};
% \draw[-stealth] (4.25,2.5) to [bend left=90] (phi);
\end{circuitikz}
% \begin{circuitikz}
% %\draw (0,4) to [open,v^>=$v_1(t)$,o-o] (0,0) -- Open Short
% \draw (0,4) to [open,l^=$e_1$,o-o] (0,0)
% (0,4) to [R,i>=$\phi_1$, l^= $\mathscr{R}_{1}$,v_>=$\mathscr{F}_1$, color=purple] (4,4)
% (4,0) -- (0,0)
% (4,4) to [R,i^>=$\phi_2$, l^= $\mathscr{R}_{2}$,v_>=$\mathscr{F}_2$, color=blue] (4,0)
% (4,4) to [R,l^= $\mathscr{R}_{3}$,v_>=$\mathscr{F}_3$, color=red] (8,4)
% (8,4) to [R,i^>=$\phi_3$, l^= $\mathscr{R}_{g}$,v_>=$\mathscr{F}_g$, color=cyan] (8,0)
% (8,0) to [R, l^= $\mathscr{R}_{4}$,v_>=$\mathscr{F}_4$, color=green] (4,0);
% \draw[thin, <-, >=triangle 45] (6,2) node{$\phi_3$} ++(-90:1) arc (-90:100:1);
% \draw[thin, <-, >=triangle 45] (2,2) node{$\phi_2$} ++(-90:1) arc (-90:100:1);
%% \node (phi) at (4.25,0.5) {$\phi_2$};
%% \draw[-stealth] (4.25,2.5) to [bend left=90] (phi);
% \end{circuitikz}
\label{fig:q1fig}
\end{document}\documentclass{standalone}
\usepackage{amsmath} % For math
\usepackage{amssymb} % For more math
\usepackage{blox}
\usepackage{tikz}
\begin{document}
\begin{tikzpicture}
\bXInput{A}
\bXComp{B}{A}
\bXLink[$R(s)$]{A}{B}
\bXBloc[2]{C}{$\cfrac{K}{s(s^2+4s+5)}$}{B}
%\bXLink[$V_1$]{B}{C}
\bXLink{B}{C}
\bXOutput{E}{C}
\bXLink[$C(s)$]{C}{E}
\bXReturn{C-E}{B}{}
\end{tikzpicture}
\end{document}\documentclass{standalone}
\usepackage[american]{circuitikz}
\usepackage{graphicx}
\usepackage{mathrsfs}
\usepackage{latexsym,amssymb,amsmath}
\newcommand{\equal}{=}
\begin{document}
\begin{circuitikz}
%\draw (0,4) to [open,v^>=$v_1(t)$,o-o] (0,0) -- Open Short
\draw (0,6) to [open,l=$e_i$,o-o] (0,1) % input
(0,6) to [C, l^= $C$,-*] (2,6) %C
(2,6) to [R, l^=$R_1$,-*] (2,1) %R1
(2,1) -- (2,0.5) node[ground]{} %ground
(5, 5.5) node[op amp,yscale=-1] (opamp) {}
(2, 6) to [open, -*] (3.5,6) node[above]{$A$}
(2,6) -- (opamp.+)
(3.5,5) node[left]{$B$} to [short,*-] (opamp.-)
(opamp.out) to [short,-*] (6.5,5.5)
to [R, l_=$R_2$,-*] (6.5,3) %R2
to [R, l_=$R_3$, -*] (6.5,1)
(6.5,3) -- (3.5,3) % connect B to middle of resistors
(3.5,3) -- (3.5,5) % vertical connection to B
(6.5,5.5) -- (7.5,5.5)
(7.5,5.5) to [open,l_=$e_o$,o-o] (7.5,1) % output
(0,1) -- (7.5,1) % wire
;
\end{circuitikz}
\end{document}\documentclass{standalone}
\usepackage[american]{circuitikz}
\usepackage{graphicx}
\usepackage{mathrsfs}
\usepackage{latexsym,amssymb,amsmath}
\newcommand{\equal}{=}
\begin{document}
\begin{circuitikz}
%\draw (0,4) to [open,v^>=$v_1(t)$,o-o] (0,0) -- Open Short
\draw (0,6) to [open,l_=$e_i$,o-o] (0,1) % input
(0,6) to [C, l_= $C$,-*] (2,6) %C
(1,6) node[] (Z2) {} % used for drawing rectangle
(2,6) to [R, l_=$R_1$,-*] (2,1) %R1
node[] (Z2end) {} % used for drawing rectangle
(2,1) -- (2,0.5) node[ground]{} %ground
(5, 5.5) node[op amp] (opamp) {}
(2, 6) to [open, -*] (3.5,6) node[above]{$A$}
(2,6) -- (opamp.-)
(3.5,5) node[left]{$B$} to [short,*-] (opamp.+)
(opamp.out) to [short,-*] (6.5,5.5)
node[] (Z1) {} % used for drawing rectangle
to [R, l^=$R_2$,-*] (6.5,3) %R2
to [R, l^=$R_3$, -*] (6.5,1)
node[] (Z1end) {} % used for drawing rectangle
(6.5,3) -- (3.5,3) % connect B to middle of resistors
(3.5,3) -- (3.5,5) % vertical connection to B
(6.5,5.5) -- (7.5,5.5)
(7.5,5.5) to [open,l^=$e_o$,o-o] (7.5,1) % output
(0,1) -- (7.5,1) % wire
;
\draw[thick,dotted] ($(Z1.north west)+(-0.5,0.15)$) rectangle ($(Z1end.south east)+(0.5,-0.15)$);
\draw (Z1.north) +(0,0.5) node {$Z_1$};
\draw[thick,dotted] ($(Z2.north west)+(-0.5,0.25)$) rectangle ($(Z2end.south east)+(0.5,-0.15)$);
\draw (Z2.north) +(0,0.5) node {$Z_2$};
\end{circuitikz}
\end{document}\documentclass{standalone}
\usepackage{amsmath} % For math
\usepackage{amssymb} % For more math
\usepackage{blox}
\usepackage{tikz}
\begin{document}
\begin{tikzpicture}
\bXInput{A}
\bXComp{B}{A}
%\bXLink[$R(s)$]{A}{B}
\bXLink{A}{B}
\bXBloc[2]{C}{$K(Ts+1)$}{B}
%\bXLink[$V_1$]{B}{C}
\bXLink{B}{C}
\bXBloc[2]{D}{$\cfrac{1}{s(s+2)}$}{C}
\bXLink{C}{D}
\bXOutput[4]{E}{D}
%\bXLink[$C(s)$]{D}{E}
\bXLink{D}{E}
\bXReturn{D-E}{B}{}
\node (Gc) at (3.5,-0.95) {$G_c(s)$};
\node (Gs) at (5.75,-0.95) {$G(s)$};
\end{tikzpicture}
\end{document}\documentclass{standalone}
\usepackage{amsmath} % For math
\usepackage{amssymb} % For more math
\usepackage{blox}
\usepackage{tikz}
\begin{document}
\begin{tikzpicture}
\bXInput{A}
\bXComp{B}{A}
%\bXLink[$R(s)$]{A}{B}
\bXLink{A}{B}
\bXBloc[2]{C}{$G_c(s)$}{B}
%\bXLink[$V_1$]{B}{C}
\bXLink{B}{C}
\bXBloc[2]{D}{$\cfrac{5}{s(0.5s+1)}$}{C}
\bXLink{C}{D}
\bXOutput[4]{E}{D}
%\bXLink[$C(s)$]{D}{E}
\bXLink{D}{E}
\bXReturn{D-E}{B}{}
%\node (Gc) at (3.25,-0.95) {$G_c(s)$};
%\node (Gs) at (5.375,-0.95) {$G(s)$};
\end{tikzpicture}
\end{document}\documentclass{standalone}
\usepackage{blox}
\usepackage{tikz}
\usetikzlibrary{positioning}
\newcommand{\equal}{=}
\usepackage{tikz}
\usetikzlibrary{intersections}
\usepackage{tkz-euclide}
% Radius for arc over intersection
\def\radius{1.mm}
\tikzset{
connect/.style args={(#1) to (#2) over (#3) by #4}{
insert path={
let \p1=($(#1)-(#3)$), \n1={veclen(\x1,\y1)},
\n2={atan2(\y1,\x1)}, \n3={abs(#4)}, \n4={#4>0 ?180:-180} in
(#1) -- ($(#1)!\n1-\n3!(#3)$)
arc (\n2:\n2+\n4:\n3) -- (#2)
}
},
}
\begin{document}
\begin{tikzpicture}
\bXInput{A} % Input
\bXComp{B}{A} % First adder
\bXLink[$R(s)$]{A}{B} % Input Label
\bXBloc[2]{C}{$G_1$}{B} % Block G1
\bXLink{B}{C} % First added -- G1
\bXComp{D}{C} % Second adder
\bXComp{E}{D} % Third adder
\bXBranchx[3]{E}{EH1} % Branch for H1, G2
\bXBloc[2]{EH2}{$G_2$}{EH1} % Block G2
\bXBranchy[-5]{EH2}{EV2} % Branch up for H1 -- above G1
\bXBloc[-1.5]{H2}{$H_1$}{EV2} % Block H1
\bXBranchx[-3.5]{H2}{H2left} % Branch for H1, G2
\bXBranchx[3]{EH2}{Bran2} % Branch after G2 and for H2
\bXBranchy[5]{Bran2}{Bran2Down} % beneath branch 2
\bXBloc[-4.5]{H2Block}{$H_2$}{Bran2Down}
\bXSuma{adder4}{Bran2}
\bXLink{C}{D}
\bXLink{D}{E}
\bXLink{E}{EH2}
\bXLink{EH2}{adder4} % G2 to adder
\bXBloc[3]{G3Block}{$G_3$}{adder4} % G3
\bXBranchx[4]{G3Block}{BranEnd} % branch before output
\bXBranchy[7.5]{BranEnd}{H3BlockRight} % Right H3 Block
\bXBranchy[2.5]{H3BlockRight}{BranEndReturn} % Right H3 Block
\bXBranchy[7.5]{E}{adder3down} % Below adder3
\bXBloc[-7.5]{H3Block}{$H_3$}{H3BlockRight} % H3 Block
\draw[-] (BranEnd.center) -- (H3BlockRight.center);
\draw[->] (H3BlockRight.center) -- (H3Block);
\draw[-] (H3BlockRight.center) -- (BranEndReturn.center);
\bXBranchy[10]{B}{adder1Down}
\draw[-] (BranEndReturn.center) -- (adder1Down);
\bXBranchy[5]{D}{adder2down} % beneath adder2
\bXBranchy[-5]{adder4}{adder4up} % beneath adder4
%\bXLinkyx{EH1.center}{H2} % -- Connection for branch 1 and H1
\draw[-] (EH1.center) -- (H2left.center);
\draw[->] (H2left.center) -- (H2);
\draw[->] (Bran2Down.center) -- (H2Block);
\draw[-] (Bran2Down.center) -- (Bran2.center);
\draw[-,name path=H2 to adder2down] (H2Block) -- (adder2down.center); % used in intersection
\draw[->] (adder2down.center) -- (D);
\draw[-] (H2) -- (adder4up.center);
\draw[->] (adder4up.center) -- (adder4);
\draw[->] (adder4) -- (G3Block);
\node[right = 0.5cm of BranEnd] (end) {$C(s)$};
\draw[->] (G3Block) -- (end);
\draw[-] (H3Block) -- (adder3down.center);
\path[name path=line] (adder3down.center) -- (E);
\path[name intersections={of=H2 to adder2down and line,by=inter}];
\draw[->,connect=(adder3down.center) to (E) over (inter) by 3pt ];
\bXLinkxy{BranEndReturn}{B}
%\bXLinkyx{Bran2}{H2Block}
\end{tikzpicture}
\end{document}\documentclass{standalone}
\usepackage{blox}
\usepackage{tikz}
\usetikzlibrary{positioning}
\newcommand{\equal}{=}
\usepackage{tikz}
\usetikzlibrary{intersections}
\usepackage{tkz-euclide}
% Radius for arc over intersection
\def\radius{1.mm}
\tikzset{
connect/.style args={(#1) to (#2) over (#3) by #4}{
insert path={
let \p1=($(#1)-(#3)$), \n1={veclen(\x1,\y1)},
\n2={atan2(\y1,\x1)}, \n3={abs(#4)}, \n4={#4>0 ?180:-180} in
(#1) -- ($(#1)!\n1-\n3!(#3)$)
arc (\n2:\n2+\n4:\n3) -- (#2)
}
},
}
\begin{document}
\begin{tikzpicture}
\bXInput{A} % Input
\bXComp{B}{A} % First adder
\bXLink[$R(s)$]{A}{B} % Input Label
\bXBloc[2]{C}{$G_1$}{B} % Block G1
\bXLink{B}{C} % First added -- G1
\bXComp{D}{C} % Second adder
\bXComp{E}{D} % Third adder
\bXBloc[2]{G2}{$G_2$}{E} % Block G2
\bXBranchx[5]{G2}{G2Right} % Branch for H1, G2
\bXBranchy[-5]{G2Right}{invG2H1Left} % node before 1 /G2
\bXBloc[-1.5]{invG2H1}{$\frac{H_1}{G_2}$}{invG2H1Left} % Block 1/G2
\bXBranchx[-3.5]{invG2H1}{invG2H1left} % Branch for H1, G2
\bXBranchx[10]{G2}{Bran2} % Branch after G2 and for H2
\bXBranchy[5]{Bran2}{Bran2Down} % beneath branch 2
\bXBloc[-4.5]{H2Block}{$H_2$}{Bran2Down}
\bXSuma{adder4}{Bran2}
\bXLink{C}{D}
\bXLink{D}{E}
\bXLink{E}{G2}
\bXLink{G2}{adder4} % G2 to adder
\bXBloc[3]{G3Block}{$G_3$}{adder4} % G3
\bXBranchx[4]{G3Block}{BranEnd} % branch before output
\bXBranchy[7.5]{BranEnd}{H3BlockRight} % Right H3 Block
\bXBranchy[2.5]{H3BlockRight}{BranEndReturn} % Right H3 Block
\bXBranchy[7.5]{E}{adder3down} % Below adder3
\bXBloc[-7.5]{H3Block}{$H_3$}{H3BlockRight} % H3 Block
\draw[-] (BranEnd.center) -- (H3BlockRight.center);
\draw[->] (H3BlockRight.center) -- (H3Block);
\draw[-] (H3BlockRight.center) -- (BranEndReturn.center);
\bXBranchy[10]{B}{adder1Down}
\draw[-] (BranEndReturn.center) -- (adder1Down);
\bXBranchy[5]{D}{adder2down} % beneath adder2
\bXBranchy[-5]{adder4}{adder4up} % beneath adder4
%\bXLinkyx{EH1.center}{H2} % -- Connection for branch 1 and H1
\draw[->] (G2Right.center) -- (invG2H1);
%\draw[->] (invG2) -- (H1);
\draw[->] (Bran2Down.center) -- (H2Block);
\draw[-] (Bran2Down.center) -- (Bran2.center);
\draw[-,name path=H2 to adder2down] (H2Block) -- (adder2down.center); % used in intersection
\draw[->] (adder2down.center) -- (D);
\draw[-] (invG2H1) -- (adder4up.center);
\draw[->] (adder4up.center) -- (adder4);
\draw[->] (adder4) -- (G3Block);
\node[right = 0.5cm of BranEnd] (end) {$C(s)$};
\draw[->] (G3Block) -- (end);
\draw[-] (H3Block) -- (adder3down.center);
\path[name path=line] (adder3down.center) -- (E);
\path[name intersections={of=H2 to adder2down and line,by=inter}];
\draw[->,connect=(adder3down.center) to (E) over (inter) by 3pt ];
\bXLinkxy{BranEndReturn}{B}
%\bXLinkyx{Bran2}{H2Block}
\end{tikzpicture}
\end{document}\documentclass{standalone}
\usepackage{blox}
\usepackage{tikz}
\usetikzlibrary{positioning}
\newcommand{\equal}{=}
\usepackage{tikz}
\usetikzlibrary{intersections}
\usepackage{tkz-euclide}
% Radius for arc over intersection
\def\radius{1.mm}
\tikzset{
connect/.style args={(#1) to (#2) over (#3) by #4}{
insert path={
let \p1=($(#1)-(#3)$), \n1={veclen(\x1,\y1)},
\n2={atan2(\y1,\x1)}, \n3={abs(#4)}, \n4={#4>0 ?180:-180} in
(#1) -- ($(#1)!\n1-\n3!(#3)$)
arc (\n2:\n2+\n4:\n3) -- (#2)
}
},
}
\begin{document}
\begin{tikzpicture}
\bXInput{A} % Input
\bXComp{B}{A} % First adder
\bXLink[$R(s)$]{A}{B} % Input Label
\bXBloc[2]{C}{$G_1$}{B} % Block G1
\bXLink{B}{C} % First added -- G1
\bXComp{D}{C} % Second adder
\bXComp{E}{D} % Third adder
\bXBloc[2]{G2}{$G_2$}{E} % Block G2
\bXBranchx[5]{G2}{G2Right} % Branch for H1, G2
\bXBranchy[-5]{G2Right}{invG2Left} % node before 1 /G2
\bXBloc[-1.5]{invG2}{$\frac{1}{G_2}$}{invG2Left} % Block 1/G2
\bXBloc[1.5]{H1}{$H_1$}{invG2} % Block 1/G2
\bXBranchx[-3.5]{H1}{H1left} % Branch for H1, G2
\bXBranchx[10]{G2}{Bran2} % Branch after G2 and for H2
\bXBranchy[5]{Bran2}{Bran2Down} % beneath branch 2
\bXBloc[-4.5]{H2Block}{$H_2$}{Bran2Down}
\bXSuma{adder4}{Bran2}
\bXLink{C}{D}
\bXLink{D}{E}
\bXLink{E}{G2}
\bXLink{G2}{adder4} % G2 to adder
\bXBloc[3]{G3Block}{$G_3$}{adder4} % G3
\bXBranchx[4]{G3Block}{BranEnd} % branch before output
\bXBranchy[7.5]{BranEnd}{H3BlockRight} % Right H3 Block
\bXBranchy[2.5]{H3BlockRight}{BranEndReturn} % Right H3 Block
\bXBranchy[7.5]{E}{adder3down} % Below adder3
\bXBloc[-7.5]{H3Block}{$H_3$}{H3BlockRight} % H3 Block
\draw[-] (BranEnd.center) -- (H3BlockRight.center);
\draw[->] (H3BlockRight.center) -- (H3Block);
\draw[-] (H3BlockRight.center) -- (BranEndReturn.center);
\bXBranchy[10]{B}{adder1Down}
\draw[-] (BranEndReturn.center) -- (adder1Down);
\bXBranchy[5]{D}{adder2down} % beneath adder2
\bXBranchy[-5]{adder4}{adder4up} % beneath adder4
%\bXLinkyx{EH1.center}{H2} % -- Connection for branch 1 and H1
\draw[->] (G2Right.center) -- (invG2);
\draw[->] (invG2) -- (H1);
\draw[->] (Bran2Down.center) -- (H2Block);
\draw[-] (Bran2Down.center) -- (Bran2.center);
\draw[-,name path=H2 to adder2down] (H2Block) -- (adder2down.center); % used in intersection
\draw[->] (adder2down.center) -- (D);
\draw[-] (H1) -- (adder4up.center);
\draw[->] (adder4up.center) -- (adder4);
\draw[->] (adder4) -- (G3Block);
\node[right = 0.5cm of BranEnd] (end) {$C(s)$};
\draw[->] (G3Block) -- (end);
\draw[-] (H3Block) -- (adder3down.center);
\path[name path=line] (adder3down.center) -- (E);
\path[name intersections={of=H2 to adder2down and line,by=inter}];
\draw[->,connect=(adder3down.center) to (E) over (inter) by 3pt ];
\bXLinkxy{BranEndReturn}{B}
%\bXLinkyx{Bran2}{H2Block}
\end{tikzpicture}
\end{document}\documentclass{standalone}
\usepackage{blox}
\usepackage{tikz}
\usetikzlibrary{positioning}
\newcommand{\equal}{=}
\usepackage{tikz}
\usetikzlibrary{intersections}
\usepackage{tkz-euclide}
% Radius for arc over intersection
\def\radius{1.mm}
\tikzset{
connect/.style args={(#1) to (#2) over (#3) by #4}{
insert path={
let \p1=($(#1)-(#3)$), \n1={veclen(\x1,\y1)},
\n2={atan2(\y1,\x1)}, \n3={abs(#4)}, \n4={#4>0 ?180:-180} in
(#1) -- ($(#1)!\n1-\n3!(#3)$)
arc (\n2:\n2+\n4:\n3) -- (#2)
}
},
}
\begin{document}
\begin{tikzpicture}
\bXInput{A} % Input
\bXComp{B}{A} % First adder
\bXLink[$R(s)$]{A}{B} % Input Label
\bXBloc[2]{C}{$G_1$}{B} % Block G1
\bXLink{B}{C} % First added -- G1
\bXComp{D}{C} % Second adder
\bXChain[4]{D}%
{G2Feed/$\frac{G_2}{1+G_2H_2}$,H1G2unity/$1+\frac{H_1}{G_2}$,G3/$G_3$}
\bXLink{C}{D}
%\bXLink{E}{G2}
%\bXLink{G2}{adder4} % G2 to adder
%\bXBloc[3]{G3Block}{$G_3$}{adder4} % G3
%\bXBranchy[7.5]{BranEnd}{H3BlockRight} % Right H3 Block
%\bXBranchy[2.5]{H3BlockRight}{BranEndReturn} % Right H3 Block
\bXBranchx[3]{G3}{BranEnd} % branch before output
\bXBranchy[5]{BranEnd}{H3BlockRight} %H3BlockRight
\bXBloc[-7.5]{H3Block}{$H_3$}{H3BlockRight} % H3 Block
\bXBranchy[2.5]{H3BlockRight}{returnToInputRight}
\bXBranchy[7.5]{B}{adder1Down}
\draw[-] (BranEnd.center) -- (H3BlockRight.center);
\draw[->] (H3BlockRight.center) -- (H3Block);
\node[right = 0.5cm of BranEnd] (end) {$C(s)$};
\draw[->] (G3) -- (end);
%H3 to second adder
\bXLinkxy{H3Block}{D}
%Output back to input, feedback loop
\draw[-] (H3BlockRight.center) -- (returnToInputRight.center);
\draw[-] (returnToInputRight.center) -- (adder1Down.center);
\draw[->] (adder1Down.center) -- (B);
%\draw[-] (H3Block) -- (adder3down.center);
%\path[name path=line] (adder3down.center) -- (E);
%\path[name intersections={of=H2 to adder2down and line,by=inter}];
%\draw[->,connect=(adder3down.center) to (E) over (inter) by 3pt ];
%\bXLinkxy{BranEndReturn}{B}
%\bXLinkyx{Bran2}{H2Block}
\end{tikzpicture}
\end{document}\documentclass{standalone}
\usepackage{amsmath} % For math
\usepackage{amssymb} % For more math
\usepackage{blox}
\usepackage{tikz}
\begin{document}
\begin{tikzpicture}
\bXInput{A}
\bXComp{B}{A}
\bXLink[$R(s)$]{A}{B}
\bXBloc[2]{C}{$\cfrac{G_1G_3(G_2+H_1)}{1+G_2H_2+H_3G_3(G_2+H_1)}$}{B}
\bXLink[$V_1$]{B}{C}
\bXOutput{E}{C}
\bXLink[$C(s)$]{C}{E}
\bXReturn{C-E}{B}{}
\end{tikzpicture}
\end{document}\documentclass{standalone}
\usepackage{amsmath} % For math
\usepackage{amssymb} % For more math
\usepackage{blox}
\usepackage{tikz}
\begin{document}
\begin{tikzpicture}
\bXInput{A}
\bXBloc[4]{C}{$\cfrac{G_1G_2G_3+G_1G_3H_1}{1+G_2H_2+H_3G_2G_3+H_1H_2G_3+G_1G_2G_3+G_1G_3H_1}$}{A}
\bXOutput[4]{E}{C}
\bXLink[$R(s) \quad $]{A}{C}
\bXLink[$\quad C(s)$]{C}{E}
\end{tikzpicture}
\end{document}\documentclass{standalone}
\usepackage{amsmath} % For math
\usepackage{amssymb} % For more math
\usepackage{blox}
\usepackage{tikz}
\begin{document}
\begin{tikzpicture}
\bXInput{A}
\bXBloc[4]{C}{$\cfrac{G_3(G_2+H_1)}{1+G_2H_2+H_3G_3(G_2+H_1)}$}{A}
\bXOutput[4]{E}{C}
\bXLink[$R(s) \quad $]{A}{C}
\bXLink[$\quad C(s)$]{C}{E}
\end{tikzpicture}
\end{document}\documentclass{standalone}
\usepackage{amsmath} % For math
\usepackage{amssymb} % For more math
\usepackage{blox}
\usepackage{tikz}
\begin{document}
\begin{tikzpicture}
\bXInput{A}
\bXComp{B}{A}
%\bXLink[$R(s)$]{A}{B}
\bXLink{A}{B}
\bXBloc[2]{C}{$G_c(s)$}{B}
%\bXLink[$V_1$]{B}{C}
\bXLink{B}{C}
\bXBloc[2]{D}{$\cfrac{820}{s(s+10)(s+20)}$}{C}
\bXLink{C}{D}
\bXOutput[4]{E}{D}
%\bXLink[$C(s)$]{D}{E}
\bXLink{D}{E}
\bXReturn{D-E}{B}{}
%\node (Gc) at (3.25,-0.95) {$G_c(s)$};
%\node (Gs) at (5.375,-0.95) {$G(s)$};
\end{tikzpicture}
\end{document}\documentclass{standalone}
\usepackage{blox}
\usepackage{tikz}
\usetikzlibrary{positioning}
\newcommand{\equal}{=}
\usepackage{tikz}
\usetikzlibrary{intersections}
\usepackage{tkz-euclide}
% Radius for arc over intersection
\def\radius{1.mm}
\tikzset{
connect/.style args={(#1) to (#2) over (#3) by #4}{
insert path={
let \p1=($(#1)-(#3)$), \n1={veclen(\x1,\y1)},
\n2={atan2(\y1,\x1)}, \n3={abs(#4)}, \n4={#4>0 ?180:-180} in
(#1) -- ($(#1)!\n1-\n3!(#3)$)
arc (\n2:\n2+\n4:\n3) -- (#2)
}
},
}
\begin{document}
\begin{tikzpicture}
\bXInput{input} % Input
\bXComp{adder1}{input} % First adder
\bXLink[$R(s)$]{input}{adder1} % Input Label
\bXBloc[1.5]{Gc}{$G_c$}{adder1} %BLock Gc
\bXComp{adder2}{Gc} % second adder
\bXBloc[1.5]{G1}{$G_1$}{adder2} % G1 Block
\bXSuma{adder3}{G1} % third adder --suma variant
\bXBloc[1.5]{G2}{$G_2$}{adder3} % G2 Block
\bXBranchy[-4.5]{adder3}{adder3up3} % adder3 up 3 units
\bXLink[$D(s)$]{adder3up3}{adder3}
\bXBranchx[3]{G2}{G2Right15} % Right of G2 1.5 units
\bXBloc[1.5]{G3}{$G_3$}{G2Right15} % G3 Block
\bXBranchx[3.5]{G3}{G3Right15} % Right of G3 1.5 units
\bXBranchy[4.5]{G2Right15}{G2Right15Down3} % Right from G2 1.5 units right and 3 units down
\bXBloc[-9]{H1}{$H_1$}{G2Right15Down3} % H1 Block
\bXBranchy[10]{G3Right15}{outputDown10}
\bXBloc[-15.5]{H2}{$H_2$}{outputDown10}
\bXOutput[3]{end}{G3Right15}
%%Drawing most of the connecters here
\draw[->] (adder1) -- (Gc);
\draw[->] (Gc) -- (adder2);
\draw[->] (adder2) -- (G1);
\draw[->] (G1) -- (adder3);
\draw[->] (adder3) -- (G2);
\draw[-] (G3) -- (end);
\draw[-] (G2Right15.center) -- (G2Right15Down3.center);
\draw[-] (G3Right15.center) -- (outputDown10.center);
\draw[->] (outputDown10.center) -- (H2);
\draw[->] (G2) -- (G3); % Connect G2 and G3
\draw[->] (G2Right15Down3.center) -- (H1);
\bXLinkxy{H2}{adder1}
\bXLink[$C(s)$]{G3Right15}{end} % Output Label
\bXLinkxy{H1}{adder2}
\end{tikzpicture}
\end{document}\documentclass{standalone}
\usepackage{blox}
\usepackage{tikz}
\usetikzlibrary{positioning}
\newcommand{\equal}{=}
\usepackage{tikz}
\begin{document}
\begin{tikzpicture}
\bXInput{A}
\bXComp{B}{A}
\bXLink[$R(s)$]{A}{B}
\bXChain[2]{B}%
{Gc/$\frac{G_c}{1+G_2H_2}$,G1G2Feed/$\frac{G_1G_2}{1+G_1G_2H_1}$,G3/$G_3$}
\bXOutput[4]{E}{G3}
\bXLink[$C(s)$]{G3}{E}
\bXBranchy[5]{G3}{returnDown}
% return loop
\bXBlocr[5]{H2}{$H_2$}{returnDown}\bXLinkyx{G3-E}{H2}
\bXLinkxy{H2}{B}
%\bXReturn{G3-E}{B}{}
\end{tikzpicture}
\end{document}\documentclass{standalone}
\usepackage{amsmath} % For math
\usepackage{amssymb} % For more math
\usepackage{blox}
\usepackage{tikz}
\begin{document}
\begin{tikzpicture}
\bXInput{A}
\bXBloc[4]{C}{$\cfrac{G_cG_3G_1G_2}{1+G_1G_2H_1+G_cG_3G_1G_2}$}{A}
\bXOutput[4]{E}{C}
\bXLink[$R(s) \quad $]{A}{C}
\bXLink[$\quad C(s)$]{C}{E}
\end{tikzpicture}
\end{document}\documentclass{standalone}
\usepackage{blox}
\usepackage{tikz}
\usetikzlibrary{positioning}
\newcommand{\equal}{=}
\usepackage{tikz}
\usetikzlibrary{intersections}
\usepackage{tkz-euclide}
% Radius for arc over intersection
\def\radius{1.mm}
\tikzset{
connect/.style args={(#1) to (#2) over (#3) by #4}{
insert path={
let \p1=($(#1)-(#3)$), \n1={veclen(\x1,\y1)},
\n2={atan2(\y1,\x1)}, \n3={abs(#4)}, \n4={#4>0 ?180:-180} in
(#1) -- ($(#1)!\n1-\n3!(#3)$)
arc (\n2:\n2+\n4:\n3) -- (#2)
}
},
}
\begin{document}
\begin{tikzpicture}
\bXInput{input} % Input
%\bXBranchx[0]{input}{GcLeft}
%\bXComp{adder1}{input} % First adder
%\bXLink[$R(s)$]{input}{adder1} % Input Label
\bXBloc[1.5]{Gc}{$G_c$}{input} %BLock Gc
\bXSumb{adder2}{Gc} % second adder
\bXBloc[1.5]{G1}{$G_1$}{adder2} % G1 Block
\bXCompSum{adder3}{G1}{+}{}{-}{} % third adder --suma variant
\bXBloc[1.5]{G2}{$G_2$}{adder3} % G2 Block
\bXBranchy[-4.5]{adder3}{adder3up3} % adder3 up 3 units
\bXLink[$D(s)$]{adder3up3}{adder3}
%\bXBranchx[3]{G2}{G2Right15} % Right of G2 1.5 units
\bXBloc[1.5]{G3}{$G_3$}{G2} % G3 Block
\bXBranchx[3.5]{G3}{G3Right15} % Right of G3 1.5 units
\bXBranchy[4.5]{G3Right15}{invG3Right} % Right from G2 1.5 units right and 3 units down
\bXBloc[-9]{invG3}{$\frac{1}{G_3}$}{invG3Right} % H1 Block
\bXBloc[-9]{H1}{$H_1$}{invG3} % H1 Block
\bXBranchy[10]{G3Right15}{outputDown10}
\bXBloc[-15.5]{H2}{$H_2$}{outputDown10}
\bXOutput[3]{end}{G3Right15}
\draw[->] (Gc) -- (adder2);
\draw[->] (adder2) -- (G1);
\draw[->] (G1) -- (adder3);
\draw[->] (adder3) -- (G2);
\draw[-] (G3) -- (end);
%\draw[-] (G2Right15.center) -- (G2Right15Down3.center);
\draw[-] (G3Right15.center) -- (outputDown10.center);
\draw[->] (outputDown10.center) -- (H2);
\draw[->] (G2) -- (G3); % Connect G2 and G3
\draw[->] (invG3Right.center) -- (invG3);
\draw[->] (invG3) -- (H1);
\bXLinkxy{H2}{Gc}
\bXLink[$C(s)$]{G3Right15}{end} % Output Label
\bXLinkxy{H1}{adder2}
\end{tikzpicture}
\end{document}\documentclass{standalone}
\usepackage{blox}
\usepackage{tikz}
\usepackage{amsmath} % For math
\usetikzlibrary{positioning}
\newcommand{\equal}{=}
\usepackage{tikz}
\begin{document}
\begin{tikzpicture}
\bXInput{A}
\bXComp{B}{A}
\bXLink[$D(s)$]{A}{B}
\bXChain[5]{B}%
{G2G3/$G_2G_3$}
\bXOutput[7.5]{E}{G2G3}
\bXLink[$C(s)$]{G2G3}{E}
\bXBranchy[5]{E}{returnDown}
% return loop
\bXBlocr[3]{GcBlock}{$G_cH_2+\frac{H_1}{G_3}$}{returnDown}
\bXBlocr[3]{G1}{$G_1$}{GcBlock}
\bXLink{GcBlock}{G1}
\bXLinkxy{G1}{B}
\bXLinkxy{E}{GcBlock}
%\bXReturn{G3-E}{B}{}
\end{tikzpicture}
\end{document}\documentclass{standalone}
\usepackage{amsmath} % For math
\usepackage{amssymb} % For more math
\usepackage{blox}
\usepackage{tikz}
\begin{document}
\begin{tikzpicture}
\bXInput{A}
\bXBloc[4]{C}{$\cfrac{G_2G_3}{1+G_1G_2G_3G_cH_2+G_1G_2H_1}$}{A}
\bXOutput[4]{E}{C}
\bXLink[$R(s) \quad $]{A}{C}
\bXLink[$\quad C(s)$]{C}{E}
\end{tikzpicture}
\end{document}\documentclass{standalone}
\usepackage[T1]{fontenc}
\usepackage[utf8]{inputenc}
\usepackage{charter}
\usepackage{environ}
\usepackage{tikz}
\usetikzlibrary{calc,matrix}
% code by Andrew:
% http://tex.stackexchange.com/a/28452/13304
\makeatletter
\let\matamp=&
\catcode`\&=13
\makeatletter
\def&{\iftikz@is@matrix
\pgfmatrixnextcell
\else
\matamp
\fi}
\makeatother
\newcounter{lines}
\def\endlr{\stepcounter{lines}\\}
\newcounter{vtml}
\setcounter{vtml}{0}
\newif\ifvtimelinetitle
\newif\ifvtimebottomline
\tikzset{description/.style={
column 2/.append style={#1}
},
timeline color/.store in=\vtmlcolor,
timeline color=red!80!black,
timeline color st/.style={fill=\vtmlcolor,draw=\vtmlcolor},
use timeline header/.is if=vtimelinetitle,
use timeline header=false,
add bottom line/.is if=vtimebottomline,
add bottom line=false,
timeline title/.store in=\vtimelinetitle,
timeline title={},
line offset/.store in=\lineoffset,
line offset=4pt,
}
\NewEnviron{vtimeline}[1][]{%
\setcounter{lines}{1}%
\stepcounter{vtml}%
\begin{tikzpicture}[column 1/.style={anchor=east},
column 2/.style={anchor=west},
text depth=0pt,text height=1ex,
row sep=1ex,
column sep=1em,
#1
]
\matrix(vtimeline\thevtml)[matrix of nodes]{\BODY};
\pgfmathtruncatemacro\endmtx{\thelines-1}
\path[timeline color st]
($(vtimeline\thevtml-1-1.north east)!0.5!(vtimeline\thevtml-1-2.north west)$)--
($(vtimeline\thevtml-\endmtx-1.south east)!0.5!(vtimeline\thevtml-\endmtx-2.south west)$);
\foreach \x in {1,...,\endmtx}{
\node[circle,timeline color st, inner sep=0.15pt, draw=white, thick]
(vtimeline\thevtml-c-\x) at
($(vtimeline\thevtml-\x-1.east)!0.5!(vtimeline\thevtml-\x-2.west)$){};
\draw[timeline color st](vtimeline\thevtml-c-\x.west)--++(-3pt,0);
}
\ifvtimelinetitle%
\draw[timeline color st]([yshift=\lineoffset]vtimeline\thevtml.north west)--
([yshift=\lineoffset]vtimeline\thevtml.north east);
\node[anchor=west,yshift=16pt,font=\large]
at (vtimeline\thevtml-1-1.north west)
{\textsc{Timeline \thevtml}: \textit{\vtimelinetitle}};
\else%
\relax%
\fi%
\ifvtimebottomline%
\draw[timeline color st]([yshift=-\lineoffset]vtimeline\thevtml.south west)--
([yshift=-\lineoffset]vtimeline\thevtml.south east);
\else%
\relax%
\fi%
\end{tikzpicture}
}
\begin{document}
\begin{vtimeline}[timeline color=cyan!80!blue, add bottom line, line offset=2pt]
Sept 4 2017 & Discussed Making Unity Games and worked on Tutorials \endlr
Sept 16 2017 & Finish Chapter 1 \& 2, latex slides \endlr
October 3 & Completed a few labs \endlr
1973 & First mobile handset invented by Martin Cooper\endlr
1978 & Parker Bros. Merlin Computer Toy\endlr
1981 & Osborne 1 Portable Computer\endlr
1982 & Grid Compass 1100 Clamshell Laptop\endlr
1983 & TRS-80 Model 100 Portable PC\endlr
1984 & Psion Organiser Handheld Computer\endlr
1991 & Psion Series 3 Minicomputer\endlr
\end{vtimeline}
\end{document}\documentclass{standalone}
\usepackage{tikz}
\usetikzlibrary{positioning}
\usetikzlibrary{shapes,arrows,calc}
\usetikzlibrary{decorations.text}
\tikzset{add/.style n args={4}{
minimum width=6mm,
path picture={
\draw[black]
(path picture bounding box.south east) -- (path picture bounding box.north west)
(path picture bounding box.south west) -- (path picture bounding box.north east);
\node at ($(path picture bounding box.south)+(0,0.13)$) {\tiny #1};
\node at ($(path picture bounding box.west)+(0.13,0)$) {\tiny #2};
\node at ($(path picture bounding box.north)+(0,-0.13)$) {\tiny #3};
\node at ($(path picture bounding box.east)+(-0.13,0)$) {\tiny #4};
}
}
}
\begin{document}
%\begin{figure}
%\centering
\tikzstyle{block} = [draw, fill=blue!20, rectangle, minimum height=3em, minimum width=4em]
\tikzstyle{controller} = [draw, fill=red!20, rectangle, minimum height=3em, minimum width=4em]
\tikzstyle{sum} = [draw, fill=blue!20, circle, node distance=1cm]
\tikzstyle{input} = [coordinate]
\tikzstyle{output} = [coordinate]
\tikzstyle{sampleSP} = [coordinate]
\tikzstyle{sampleEP} = [coordinate]
\tikzstyle{otherPoint} = [coordinate]
\begin{tikzpicture}[auto, >=latex']
% Nodes
\node [input] (input) {};
%\node [sum, right = 1cm of input] (sum) {};
\node[draw,circle,add={--}{+}{}{},right of= input](sum){};
\node [sampleSP, right = 1cm of sum] (sumSP) {};
\node [sampleEP, right = 1cm of sumSP] (sumEP) {};
\node [sampleEP, above = 1cm of sumEP] (sumEPTOP) {};
\node [controller, right = 2cm of sumEP] (system) {$G(s)$};
\node [otherPoint,right = 1cm of system] (branchPoint) {};
\node [otherPoint,below = 1 cm of system] (belowsystem) {}; %{$\frac{1}{Ts+1}$};
%\node [block, right = 1cm of system] (system2) {$\frac{1}{Ts+1}$};
\node [output, right = 2cm of branchPoint] (output) {};
%\node [input, below = 0.5cm of system] (m) {};
\node [block, right = 0.75 of belowsystem] (systemH) {$H_1(s)$};
% Second Sampler Point
\node [sampleSP, left = 1cm of systemH] (sysHSP2) {};
\node [sampleEP, left = 1cm of sysHSP2] (sysHEP2) {};
\node [sampleEP, above = 1cm of sysHEP2] (sumEPTOP2) {};
% Second block
\node [block, left = 1.5cm of sysHEP2] (systemH2) {$H_2(s)$};
% Arrows
\draw [draw,->] (input) -- node {$R$} (sum);
% Arrows for first sampler
\draw [-] (sum) -- node {$E(s)$} (sumSP);
\draw [-,thick] (sumEPTOP) -- node {$\delta_\tau$} (sumSP);
\draw [->] (sumEP) -- node {$E^\ast(s)$} (system);
%Arrows for second sampler (bottom)
\draw [-] (sysHSP2)-- node {$M(s)$} (systemH);
\draw [-,thick] (sysHSP2) -- node {$\delta_\tau$} (sumEPTOP2);
%\draw [->] (sumEP) -- node {$M^\ast(s)$} (systemH);
% \draw [->] (system) -- (system2);
\draw [-] (system) -- (branchPoint);
\draw [->] (branchPoint) -- node (y) {$C(s)$}(output);
\draw [-] (y) |- (systemH) {};
%\draw [-] (y) |- (m) {} ;
\draw [<-] (systemH2) -- node {$M^\ast(s)$} (sysHEP2);
\draw [->] (systemH2) -| (sum); %{$-$} node [near end] {} (sum);
%\draw [->] (m) -| node[pos=0.99] {} node [near end] {} (sum); %{$-$} node [near end] {} (sum);
\end{tikzpicture}
%\end{figure}
\end{document}\documentclass[%
% border=1pt
border={-25pt 0pt 0pt 0pt} % left bottom right top
]{standalone}
\usepackage{amsmath}
\usepackage{tikz}
\usetikzlibrary{positioning}
\usetikzlibrary{shapes,arrows,calc}
\usetikzlibrary{decorations.text}
\tikzset{add/.style n args={4}{
minimum width=6mm,
path picture={
\draw[black]
(path picture bounding box.south east) -- (path picture bounding box.north west)
(path picture bounding box.south west) -- (path picture bounding box.north east);
\node at ($(path picture bounding box.south)+(0,0.13)$) {\tiny #1};
\node at ($(path picture bounding box.west)+(0.13,0)$) {\tiny #2};
\node at ($(path picture bounding box.north)+(0,-0.13)$) {\tiny #3};
\node at ($(path picture bounding box.east)+(-0.13,0)$) {\tiny #4};
}
}
}
\begin{document}
%\begin{figure}
%\centering
\tikzstyle{block} = [draw, fill=blue!20, rectangle, minimum height=3em, minimum width=4em]
\tikzstyle{controller} = [draw, fill=red!20, rectangle, minimum height=3em, minimum width=4em]
\tikzstyle{sum} = [draw, fill=blue!20, circle, node distance=1cm]
\tikzstyle{input} = [coordinate]
\tikzstyle{output} = [coordinate]
\tikzstyle{sampleSP} = [coordinate]
\tikzstyle{sampleEP} = [coordinate]
\tikzstyle{otherPoint} = [coordinate]
\begin{tikzpicture}[auto, >=latex']
% Nodes
\node [input] (input) {};
%\node [sum, right = 1cm of input] (sum) {};
\node[draw,circle,add={--}{+}{}{},right of= input](sum){};
%\node [sampleSP, right = 1cm of sum] (sumSP) {};
%\node [sampleEP, right = 1cm of sumSP] (sumEP) {};
%\node [sampleEP, above = 1cm of sumEP] (sumEPTOP) {};
\node [block, right = 0.5cm of sum] (system) {$\cfrac{K(z+1)}{(z-1)(z-0.6065)}$}; % node[label=below:$b_1$,draw]{};
%\node [below = 0.005 cm of system] (PointHeader) {\scriptsize{$G(s)$}};
\node [otherPoint,right = 0.5cm of system] (branchPoint) {};
\node [otherPoint,below = 0.5 cm of system] (belowsystem) {}; %{$\frac{1}{Ts+1}$};
%\node [block, right = 1cm of system] (system2) {$\frac{1}{Ts+1}$};
\node [output, right = 1cm of branchPoint] (output) {};
\node [input, below = 0.5cm of system] (m) {};
%\node [otherPoint, right = 1.25 of belowsystem] (systemRightDownP) {$H_1(s)$};
% Second Sampler Point
%\node [sampleSP, below = 0.5cm of systemRightDownP] (sysHSP2) {};
%\node [sampleEP, left = 1cm of sysHSP2] (sysHEP2) {};
%\node [sampleEP, above = 1cm of sysHEP2] (sumEPTOP2) {};
% Second block
%\node [block, left = 0.75cm of sysHEP2] (systemH2) {$\cfrac{1-e^{-Ts}}{s}$};
% Arrows
\draw [draw,->] (input) -- node {$R(z)$} (sum);
% Arrows for first sampler
% \draw [-] (sum) -- node {$E(s)$} (sumSP);
% \draw [-,thick] (sumEPTOP) -- node {$\delta_\tau$} (sumSP);
%\draw [->] (sum) -- node {$E(s)$} (system);
\draw [->] (sum) -- node {} (system);
%Arrows for second sampler (bottom)
% \draw [-] (sysHSP2)-- node {$M(s)$} (systemH);
%\draw [-,thick] (sysHSP2) -- node {$\delta_\tau$} (sumEPTOP2);
%\draw [->] (sumEP) -- node {$M^\ast(s)$} (systemH);
% \draw [->] (system) -- (system2);
\draw [-] (system) -- (branchPoint);
\draw [->] (branchPoint) -- node (y) {$C(z)$}(output);
%\draw [-] (y) |- (sysHSP2) {};
\draw [-] (y) |- (m) {} ;
%\draw [<-] (systemH2) -- node {$M^\ast(s)$} (sysHEP2);
%\draw [->] (sysHEP2) -- (systemH2);
%\draw [->] (systemH2) -| node [near end] {$B(s)$} (sum) ; %{$-$} node [near end] {} (sum);
%\node [otherPoint, below = 1.25cm of sum] (Text) {$B(s)$};
\draw [->] (m) -| node[pos=0.99] {} node [near end] {} (sum); %{$-$} node [near end] {} (sum);
\end{tikzpicture}
%\end{figure}
\end{document} \documentclass{standalone}
\usepackage{pgfplots}
% Manually removed entries to plot a "better" root locus in latex, of course using matlab 2 tikz is much better.
\pgfplotsset{compat=1.11}
\pgfplotstableread{
pr1 pi1 pr2 pi2 k
1.0000 0 0.6065 0 0
0.9272 0 0.6672 0 0.0121
0.9109 0 0.6814 0 0.0142
0.8887 0 0.7011 0 0.0166
0.8541 0 0.7329 0 0.0195
0.7987 0 0.7863 0 0.0215
0.7925 -0.0000 0.7925 0.0000 0.0215
0.7925 -0.0062 0.7925 0.0062 0.0216
0.7918 -0.0482 0.7918 0.0482 0.0228
0.7899 -0.0967 0.7899 0.0967 0.0268
0.7876 -0.1326 0.7876 0.1326 0.0313
0.7849 -0.1649 0.7849 0.1649 0.0367
0.7817 -0.1961 0.7817 0.1961 0.0430
0.7780 -0.2272 0.7780 0.2272 0.0504
0.7737 -0.2588 0.7737 0.2588 0.0591
0.7686 -0.2915 0.7686 0.2915 0.0693
0.7627 -0.3255 0.7627 0.3255 0.0812
0.7557 -0.3613 0.7557 0.3613 0.0951
0.7475 -0.3989 0.7475 0.3989 0.1114
0.7380 -0.4387 0.7380 0.4387 0.1306
0.7267 -0.4810 0.7267 0.4810 0.1530
0.7136 -0.5259 0.7136 0.5259 0.1793
0.6982 -0.5737 0.6982 0.5737 0.2101
0.6802 -0.6245 0.6802 0.6245 0.2462
0.6590 -0.6787 0.6590 0.6787 0.2885
0.6342 -0.7364 0.6342 0.7364 0.3380
0.6052 -0.7977 0.6052 0.7977 0.3961
0.5712 -0.8628 0.5712 0.8628 0.4641
0.5313 -0.9317 0.5313 0.9317 0.5439
0.4846 -1.0045 0.4846 1.0045 0.6373
0.4299 -1.0810 0.4299 1.0810 0.7468
0.3657 -1.1610 0.3657 1.1610 0.8751
0.2906 -1.2440 0.2906 1.2440 1.0254
0.2025 -1.3293 0.2025 1.3293 1.2015
0.0993 -1.4158 0.0993 1.4158 1.4079
-0.0217 -1.5019 -0.0217 1.5019 1.6498
-0.1634 -1.5853 -0.1634 1.5853 1.9332
-0.3294 -1.6623 -0.3294 1.6623 2.2653
-0.5240 -1.7281 -0.5240 1.7281 2.6545
-0.7520 -1.7752 -0.7520 1.7752 3.1105
-1.0192 -1.7924 -1.0192 1.7924 3.6449
-1.3323 -1.7614 -1.3323 1.7614 4.2710
-1.5157 -1.7167 -1.5157 1.7167 4.6379
-1.6991 -1.6505 -1.6991 1.6505 5.0047
-1.9140 -1.5419 -1.9140 1.5419 5.4346
-2.1290 -1.3923 -2.1290 1.3923 5.8645
-2.3809 -1.1429 -2.3809 1.1429 6.3682
-2.5068 -0.9709 -2.5068 0.9709 6.6201
-2.6327 -0.7398 -2.6327 0.7398 6.8719
-2.7108 -0.5349 -2.7108 0.5349 7.0281
-2.7498 -0.3886 -2.7498 0.3886 7.1062
-2.7889 -0.1135 -2.7889 0.1135 7.1843
-2.7925 -0.0000 -2.7925 0.0000 7.1915
-2.6825 0 -2.9097 0 7.1987
-1.9082 0 -4.5377 0 8.0524
}\mytable
\begin{document}
\begin{tikzpicture}[
%This is to provide the start point cross marker
start marker/.pic={\draw (-#1,-#1) -- (#1,#1) (#1,-#1)--(-#1,#1);}
]
\begin{axis}[no marks,xmax=2,grid=both]% Don't put any markers, limit the visible area from one side ,draw grid
\foreach\x in{1,...,2}{% Iterate over the columns of the table
\addplot+[] table[x=pr\x,y=pi\x] {\mytable} % Draw the curves
node[draw,circle,inner sep=2pt] at (current plot end) {}%Put the ending marker with size adjusted to 2pt
pic at (current plot begin) {start marker=2pt};%Put the starting marker
}
\end{axis}
\end{tikzpicture}
\end{document}\documentclass[%
% border=1pt
border={-25pt 0pt 0pt 0pt} % left bottom right top
]{standalone}
\usepackage{tikz}
\usepackage{amsmath}
\usetikzlibrary{positioning}
\usetikzlibrary{shapes,arrows,calc}
\usetikzlibrary{decorations.text}
\usetikzlibrary{decorations.pathreplacing}
\tikzset{add/.style n args={4}{
minimum width=6mm,
path picture={
\draw[black]
(path picture bounding box.south east) -- (path picture bounding box.north west)
(path picture bounding box.south west) -- (path picture bounding box.north east);
\node at ($(path picture bounding box.south)+(0,0.13)$) {\tiny #1};
\node at ($(path picture bounding box.west)+(0.13,0)$) {\tiny #2};
\node at ($(path picture bounding box.north)+(0,-0.13)$) {\tiny #3};
\node at ($(path picture bounding box.east)+(-0.13,0)$) {\tiny #4};
}
}
}
\begin{document}
%\begin{figure}
%\centering
%\tikzstyle{block} = [draw, fill=blue!20, rectangle, minimum height=3em, minimum width=4em]
\tikzstyle{block} = [draw, rectangle, minimum height=3em, minimum width=4em]
\tikzstyle{controller} = [draw, fill=red!20, rectangle, minimum height=3em, minimum width=4em]
\tikzstyle{sum} = [draw, fill=blue!20, circle, node distance=1cm]
\tikzstyle{input} = [coordinate]
\tikzstyle{output} = [coordinate]
\tikzstyle{sampleSP} = [coordinate]
\tikzstyle{sampleEP} = [coordinate]
\tikzstyle{otherPoint} = [coordinate]
\tikzset{
position label/.style={
below = 3pt,
text height = 1.5ex,
text depth = 1ex
},
brace/.style={
decoration={brace, mirror},
decorate
}
}
\begin{tikzpicture}[auto, >=latex']
% Nodes
\node [input] (input) {};
%\node [sum, right = 1cm of input] (sum) {};
\node[draw,circle,add={--}{+}{}{},right of= input](sum){};
\node [sampleSP, right = 1cm of sum] (sumSP) {};
\node [sampleEP, right = 1cm of sumSP] (sumEP) {};
\node [sampleEP, above = 1cm of sumEP] (sumEPTOP) {};
\node [block, right = 1cm of sumEP,text width=1.75cm,align=center] (systemK) {Digital PI Controller};
\node [block, right = 1cm of systemK] (systemZOH) {$\cfrac{1-e^{-s}}{s}$};
\node [block, right = 1cm of systemZOH] (system) {$\cfrac{10}{(s+1)(s+5)}$};
\node [otherPoint,right = 1cm of system] (branchPoint) {};
\node [otherPoint,below = 1 cm of system] (belowsystem) {}; %{$\frac{1}{Ts+1}$};
%\node [block, right = 1cm of system] (system2) {$\frac{1}{Ts+1}$};
\node [output, right = 1cm of branchPoint] (output) {};
\node [input, below = 2cm of system] (m) {};
% Arrows
\draw [draw,->] (input) -- node {$R$} (sum);
% Arrows for first sampler
\draw [-] (sum) -- node {$E(s)$} (sumSP);
\draw [-,thick] (sumEPTOP) -- node {$\delta_\tau$} (sumSP);
\draw [->] (sumEP) -- node {$E^\ast(s)$} (systemK);
\draw [->] (systemK) -- node {} (systemZOH);
\draw [->] (systemZOH) -- node {} (system);
%\draw [->] (sumEP) -- node {$M^\ast(s)$} (systemH);
% \draw [->] (system) -- (system2);
\draw [-] (system) -- (branchPoint);
\draw [->] (branchPoint) -- node (y) {$C(s)$}(output);
\draw [-] (y) |- (m) {} ;
\draw [->] (m) -| (sum); %{$-$} node [near end] {} (sum);
%\node [below = 0.005 cm of system] (PointHeader) {\scriptsize{$G(s)$}};
\draw[thick,dotted] ($(systemZOH.north west)+(-0.25,0.15)$) rectangle ($(system.south east)+(0.25,-0.15)$);
\draw [brace,decoration={raise=2ex}] (systemZOH.south west) -- node [position label,yshift=-2ex] {$G(s)$} (system.south east);
\end{tikzpicture}
%\end{figure}
\end{document}\documentclass[%
% border=1pt
border={-25pt 0pt 0pt 0pt} % left bottom right top
]{standalone}
\usepackage{tikz}
\usepackage{amsmath}
\usetikzlibrary{positioning}
\usetikzlibrary{shapes,arrows,calc}
\usetikzlibrary{decorations.text}
\usetikzlibrary{decorations.pathreplacing}
\tikzset{add/.style n args={4}{
minimum width=6mm,
path picture={
\draw[black]
(path picture bounding box.south east) -- (path picture bounding box.north west)
(path picture bounding box.south west) -- (path picture bounding box.north east);
\node at ($(path picture bounding box.south)+(0,0.13)$) {\tiny #1};
\node at ($(path picture bounding box.west)+(0.13,0)$) {\tiny #2};
\node at ($(path picture bounding box.north)+(0,-0.13)$) {\tiny #3};
\node at ($(path picture bounding box.east)+(-0.13,0)$) {\tiny #4};
}
}
}
\begin{document}
%\begin{figure}
%\centering
\tikzstyle{block} = [draw, fill=blue!20, rectangle, minimum height=3em, minimum width=4em]
\tikzstyle{controller} = [draw, fill=red!20, rectangle, minimum height=3em, minimum width=4em]
\tikzstyle{sum} = [draw, fill=blue!20, circle, node distance=1cm]
\tikzstyle{input} = [coordinate]
\tikzstyle{output} = [coordinate]
\tikzstyle{sampleSP} = [coordinate]
\tikzstyle{sampleEP} = [coordinate]
\tikzstyle{otherPoint} = [coordinate]
\tikzset{
position label/.style={
below = 3pt,
text height = 1.5ex,
text depth = 1ex
},
brace/.style={
decoration={brace, mirror},
decorate
}
}
\begin{tikzpicture}[auto, >=latex']
% Nodes
\node [input] (input) {};
%\node [sum, right = 1cm of input] (sum) {};
\node[draw,circle,add={--}{+}{}{},right of= input](sum){};
\node [sampleSP, right = 1cm of sum] (sumSP) {};
\node [sampleEP, right = 1cm of sumSP] (sumEP) {};
\node [sampleEP, above = 1cm of sumEP] (sumEPTOP) {};
\node [block, right = 1cm of sumEP,text width=1.75cm,align=center] (systemK) {Digital PD Controller};
\node [block, right = 1cm of systemK] (systemZOH) {$\cfrac{1-e^{-s}}{s}$};
\node [controller, right = 1cm of systemZOH] (system) {$\cfrac{1}{s^2}$};
\node [otherPoint,right = 1cm of system] (branchPoint) {};
\node [otherPoint,below = 1 cm of system] (belowsystem) {}; %{$\frac{1}{Ts+1}$};
%\node [block, right = 1cm of system] (system2) {$\frac{1}{Ts+1}$};
\node [output, right = 1cm of branchPoint] (output) {};
\node [input, below = 2cm of system] (m) {};
% Arrows
\draw [draw,->] (input) -- node {$R$} (sum);
% Arrows for first sampler
\draw [-] (sum) -- node {$E(s)$} (sumSP);
\draw [-,thick] (sumEPTOP) -- node {$\delta_\tau$} (sumSP);
\draw [->] (sumEP) -- node {$E^\ast(s)$} (systemK);
\draw [->] (systemK) -- node {} (systemZOH);
\draw [->] (systemZOH) -- node {} (system);
%\draw [->] (sumEP) -- node {$M^\ast(s)$} (systemH);
% \draw [->] (system) -- (system2);
\draw [-] (system) -- (branchPoint);
\draw [->] (branchPoint) -- node (y) {$C(s)$}(output);
\draw [-] (y) |- (m) {} ;
\draw [->] (m) -| (sum); %{$-$} node [near end] {} (sum);
%\node [below = 0.005 cm of system] (PointHeader) {\scriptsize{$G(s)$}};
\draw[thick,dotted] ($(systemZOH.north west)+(-0.25,0.15)$) rectangle ($(system.south east)+(0.25,-0.15)$);
\draw [brace,decoration={raise=2ex}] (systemZOH.south west) -- node [position label,yshift=-2ex] {$G(s)$} (system.south east);
\end{tikzpicture}
%\end{figure}
\end{document}\documentclass[%
% border=1pt
border={-25pt 0pt 0pt 0pt} % left bottom right top
]{standalone}
\usepackage{tikz}
\usepackage{amsmath}
\usetikzlibrary{positioning}
\usetikzlibrary{shapes,arrows,calc}
\usetikzlibrary{decorations.text}
\usetikzlibrary{decorations.pathreplacing}
\tikzset{add/.style n args={4}{
minimum width=6mm,
path picture={
\draw[black]
(path picture bounding box.south east) -- (path picture bounding box.north west)
(path picture bounding box.south west) -- (path picture bounding box.north east);
\node at ($(path picture bounding box.south)+(0,0.13)$) {\tiny #1};
\node at ($(path picture bounding box.west)+(0.13,0)$) {\tiny #2};
\node at ($(path picture bounding box.north)+(0,-0.13)$) {\tiny #3};
\node at ($(path picture bounding box.east)+(-0.13,0)$) {\tiny #4};
}
}
}
\begin{document}
%\begin{figure}
%\centering
%\tikzstyle{block} = [draw, fill=blue!20, rectangle, minimum height=3em, minimum width=4em]
\tikzstyle{block} = [draw, rectangle, minimum height=3em, minimum width=4em]
\tikzstyle{controller} = [draw, fill=red!20, rectangle, minimum height=3em, minimum width=4em]
\tikzstyle{sum} = [draw, fill=blue!20, circle, node distance=1cm]
\tikzstyle{input} = [coordinate]
\tikzstyle{output} = [coordinate]
\tikzstyle{sampleSP} = [coordinate]
\tikzstyle{sampleEP} = [coordinate]
\tikzstyle{otherPoint} = [coordinate]
\tikzset{
position label/.style={
below = 3pt,
text height = 1.5ex,
text depth = 1ex
},
brace/.style={
decoration={brace, mirror},
decorate
}
}
\begin{tikzpicture}[auto, >=latex']
% Nodes
\node [input] (input) {};
%\node [sum, right = 1cm of input] (sum) {};
\node[draw,circle,add={--}{+}{}{},right of= input](sum){};
\node [sampleSP, right = 1cm of sum] (sumSP) {};
\node [sampleEP, right = 1cm of sumSP] (sumEP) {};
\node [sampleEP, above = 1cm of sumEP] (sumEPTOP) {};
\node [block, right = 1cm of sumEP,text width=1.75cm,align=center] (systemK) {$G_D(z)$};
\node [block, right = 1cm of systemK] (systemZOH) {$\cfrac{1-e^{-s}}{s}$};
\node [block, right = 1cm of systemZOH] (system) {$\cfrac{K}{(s)(s+0.5)}$};
\node [otherPoint,right = 1cm of system] (branchPoint) {};
\node [otherPoint,below = 1 cm of system] (belowsystem) {}; %{$\frac{1}{Ts+1}$};
%\node [block, right = 1cm of system] (system2) {$\frac{1}{Ts+1}$};
\node [output, right = 1cm of branchPoint] (output) {};
\node [input, below = 2cm of system] (m) {};
% Arrows
\draw [draw,->] (input) -- node {$R$} (sum);
% Arrows for first sampler
%\draw [-] (sum) -- node {$E(s)$} (sumSP);
\draw [-] (sum) -- node {} (sumSP);
\draw [-,thick] (sumEPTOP) -- node {$T$} (sumSP);
%\draw [->] (sumEP) -- node {$E^\ast(s)$} (systemK);
\draw [->] (sumEP) -- node {} (systemK);
\draw [->] (systemK) -- node {} (systemZOH);
\draw [->] (systemZOH) -- node {} (system);
%\draw [->] (sumEP) -- node {$M^\ast(s)$} (systemH);
% \draw [->] (system) -- (system2);
\draw [-] (system) -- (branchPoint);
\draw [->] (branchPoint) -- node (y) {$C(s)$}(output);
\draw [-] (y) |- (m) {} ;
\draw [->] (m) -| (sum); %{$-$} node [near end] {} (sum);
%\node [below = 0.005 cm of system] (PointHeader) {\scriptsize{$G(s)$}};
\draw[thick,dotted] ($(systemZOH.north west)+(-0.25,0.15)$) rectangle ($(system.south east)+(0.25,-0.15)$);
\draw [brace,decoration={raise=2ex}] (systemZOH.south west) -- node [position label,yshift=-2ex] {$G(s)$} (system.south east);
\end{tikzpicture}
%\end{figure}
\end{document}\documentclass{article}
\nonstopmode
\usepackage{adigraph}
\begin{document}
\NewAdigraph{myAdigraph}{
s:0,0;
1:2,2;
3:2,-2;
2:6,2;
4:6,-2;
t:8,0;
}{
s,1:25;
s,3:25;
3,4:25;
1,2:35;
2,t:20;
4,t:30;
3,1:10;
4,2:10;
2,3:15::near start;
4,1:5::near start;
}
\myAdigraph{
s,3,4,2,t;
}
\end{document}\documentclass[%
% border=1pt
border={-25pt 0pt 0pt 0pt} % left bottom right top
]{standalone}
\usepackage{tikz}
\usepackage{amsmath}
\usetikzlibrary{positioning}
\usetikzlibrary{shapes,arrows,calc}
\usetikzlibrary{decorations.text}
\usetikzlibrary{decorations.pathreplacing}
\tikzset{add/.style n args={4}{
minimum width=6mm,
path picture={
\draw[black]
(path picture bounding box.south east) -- (path picture bounding box.north west)
(path picture bounding box.south west) -- (path picture bounding box.north east);
\node at ($(path picture bounding box.south)+(0,0.13)$) {\tiny #1};
\node at ($(path picture bounding box.west)+(0.13,0)$) {\tiny #2};
\node at ($(path picture bounding box.north)+(0,-0.13)$) {\tiny #3};
\node at ($(path picture bounding box.east)+(-0.13,0)$) {\tiny #4};
}
}
}
\begin{document}
%\begin{figure}
%\centering
%\tikzstyle{block} = [draw, fill=blue!20, rectangle, minimum height=3em, minimum width=4em]
\tikzstyle{block} = [draw, rectangle, minimum height=2em, minimum width=0.5em]
\tikzstyle{controller} = [draw, fill=red!20, rectangle, minimum height=2em, minimum width=1em]
\tikzstyle{sum} = [draw, fill=blue!20, circle, node distance=1cm]
\tikzstyle{input} = [coordinate]
\tikzstyle{output} = [coordinate]
\tikzstyle{sampleSP} = [coordinate]
\tikzstyle{sampleEP} = [coordinate]
\tikzstyle{otherPoint} = [coordinate]
\tikzset{
position label/.style={
below = 3pt,
text height = 1.5ex,
text depth = 1ex
},
brace/.style={
decoration={brace, mirror},
decorate
}
}
\begin{tikzpicture}[auto, >=latex']
%% Integral Controller
% Nodes and Blocks
\node [input] (input) {};
%\node [sum, right = 1cm of input] (sum) {};
\node[draw,circle,add={--}{+}{}{},right of= input](sum){};
\node[draw,circle,add={+}{+}{}{},right of= sum](sumint){};
\node [block, right = 1cm of sumint,text width=0.75cm,align=center] (delay1) {$z^{-1}$};
% feedback points
\node [otherPoint,right = 1.125 cm of delay1] (vkbelow) {}; %{$\frac{1}{Ts+1}$};
\node [otherPoint, below = 1cm of delay1] (m1) {};
% Gain Blocks
\node [block, right = 2.25cm of delay1,text width=0.75cm,align=center] (gainK1) {$K_1$};
% Declarations for integral controller
\draw[thick,dotted] ($(sumint.north west)+(-0.25,0.45)$) rectangle ($(gainK1.south east)+(0.25,-1.5)$);
\node [below right=1.5cm and -0.85cm of delay1] {\scriptsize{Integral Controller}}; (text1)
%\draw [brace,decoration={raise=2ex}] (sumint.south west) -- node [position label,yshift=-3ex] {$G(s)$} (gainK1.south east);
%% Plant
\node [otherPoint, right = 0.25cm of gainK1] (sumP1Space) {};
% Summers
\node [draw,circle,add={--}{+}{}{}, right of= sumP1Space] (sumP1) {};
\node [draw,circle,add={+}{+}{}{}, right of= sumP1] (sumP2) {};
% Blocks
\node [block, right = 1cm of sumP2,text width=0.75cm,align=center] (delay2) {$z^{-1}$};
\node [block, below = 1cm of delay2,text width=0.75cm,align=center] (constant05) {$0.5$};
\node [block, below = 1cm of constant05,text width=0.75cm,align=center] (gainK2) {$K_2$};
%Output Points
\node [otherPoint, right = 1cm of delay2] (xk) {};
\node [otherPoint, right = 1.5cm of xk] (yk) {};
\node [output, right of = yk] (output) {};%{$y(k)$};
\node [output, below = 0.75cm of gainK2] (m2) {};
% Declarations for plant controller
\draw[thick,dotted] ($(sumP1.north west)+(-0.25,0.45)$) rectangle ($(xk.south east)+(0.55,-3.95)$);
\node [below left=0.15cm and 0.001cm of gainK2] {\scriptsize{Plant}}; (text2)
% Arrows for Integral Controller
\draw [draw,->] (input) -- node {$r(k)$} (sum);
\draw [draw,->] (sum) -- node {} (sumint);
\draw [draw,->] (delay1) -- node {$v(k)$} (gainK1);
\draw [draw,->] (sumint) -- node {} (delay1);
% Feedback for integral controller
\draw [-] (vkbelow) |- (m1) {} ;
\draw [-] (m1) -| (sumint) {} ;
% Arrows for Plant
\draw [draw,->] (gainK1) -- node {} (sumP1);
\draw [draw,->] (sumP1) -- node[above=0.15] {$u(k)$} (sumP2);
\draw [draw,->] (sumP2) -- node {} (delay2);
%Feedback to Summers in Plant
\draw [->] (constant05) -| (sumP2) {} ;
\draw [->] (gainK2) -| (sumP1) {} ;
% Feedback for plant and finishing up connections
\draw [->] (xk) |- (constant05) {} ;
\draw [->] (xk) |- (gainK2) {} ;
\draw [draw,-] (delay2) -- node {$x_k$} (yk);
\draw [draw,->] (yk) -- node {$y_k$} (output);
\draw [-] (yk) |- (m2) {} ;
\draw [->] (m2) -| (sum) {} ;
\end{tikzpicture}
%\end{figure}
\end{document}\documentclass[11pt]{article}
\pagestyle{empty}
\begin{document}
\begin{center}
\large{\bf MATH0003 Integration \& Differential Equations}
\normalsize
\bigskip
{\bf Partial Fractions} (Anton section 9.5)
\end{center}
\medskip
\noindent
{\bf Definition:} a {\em rational function}
is a function of the form $P(x)/Q(x)$,
where $P$ and $Q$ are polynomials.
A {\em proper} rational function is a rational function
with the degree of $P$ less than the degree of $Q$.
\medskip
\noindent
Proper rational functions are usually integrated
by splitting them up into {\em partial fractions}.
\medskip
\noindent
{\bf Theorem (partial fractions):} every proper rational function
may be expressed in the form
\[
\frac{P(x)}{Q(x)} = F_1(x) + F_2(x) + \cdots + F_n(x),
\]
where the $F_i(x)$ are rational functions of the form
\[
\frac{A}{(ax+b)^k} \;\; {\rm or} \;\; \frac{Ax+B}{(ax^2+bx+c)^k},
\]
in which the denominators are factors of $Q$.
The sum is called the partial fraction decomposition of $P(x)/Q(x)$,
and the $F_i(x)$ are called partial fractions.
\medskip
\noindent
Q1. How do we find the {\em form} of the partial fraction decomposition?
\noindent
Q2. How do we determine the coefficients?
\medskip
\noindent
{\bf Linear Factor Rule.}
For each factor of $Q$ of the form $(ax+b)^m$,
the partial fraction decomposition contains
the following sum of $m$ partial fractions:
\[
\frac{A_1}{ax+b} + \frac{A_2}{(ax+b)^2} + \cdots + \frac{A_m}{(ax+b)^m},
\]
where the $A_i$ are constants to be determined.
\medskip
\noindent
{\bf Quadratic Factor Rule.}
For each factor of $Q$ of the form $(ax^2+bx+c)^m$,
where $ax^2+bx+c$ is an irreducible quadratic,
the partial fraction decomposition contains
the following sum of $m$ partial fractions:
\[
\frac{A_1x+B_1}{ax^2+bx+c} + \frac{A_2x+B_2}{(ax^2+bx+c)^2} + \cdots
+ \frac{A_mx+B_m}{(ax^2+bx+c)^m},
\]
where the $A_i$ and $B_i$ are constants to be determined.
\end{document}
\documentclass{standalone}
\usepackage{tikz}
\usetikzlibrary{shapes.misc}
\begin{document}
\begin{tikzpicture}[scale=2.5, every node/.style={scale=0.6}]

% Axes:
\draw [-latex] (-0.815,0) -- (1.25,0) node [above left]  {$\Re$};
\draw [-latex] (0,-0.15) -- (0,0.6) node [below right] {$\Im$};

% Poles and ticks
\node[cross out,draw=black] at (0.8187,0) {};
\node[] at (0.8187,-0.1) {$\tiny{0.8187}$};
\node[cross out,draw=black] at (0.3679,0) {};
\node[] at (0.3679,-0.1) {$\tiny{0.3679}$};
\node[cross out,draw=black] at (1,0) {};
\node[] at (1,-0.1) {$\tiny{1}$};
% Zeroes and ticks
\node[solid, circle,draw=black] at (-0.6714,0) {};
\node[] at (-0.6714,-0.1) {$\tiny{-0.6714}$};

%% Draw connection arrows
\draw[] (0,0) node[pos=0.8, above left] {}(36:0.6958) node[solid,thick, cross out,draw=black] {};
\node[] at (36:0.6958+0.14) {$\tiny{z=0.6958e^{j36^\circ}}$};
\draw[dashed]  (36:0.6958) -- (-0.6714,0) node[] {};
\draw[dashed]  (36:0.6958) -- (0.3679,0) node[] {};
\draw[dashed]  (36:0.6958) -- (0.8187,0) node[] {};
\draw[dashed]  (36:0.6958) -- (1,0) node[] {};

%% Draw angles for zeroes
\draw (-0.3,0.025)node[] {$\scriptstyle 18.3316^o$};
\draw[red, -stealth] (-0.1,0) arc (0:45:0.25);
%% Draw angles for poles
\draw (0.2,0.025)node[] {$\scriptstyle 122.028^o$};
\draw[red, -stealth] (0.05,0) arc (180:45:0.225);

\draw (0.6,0.025)node[] {$\scriptstyle 64.5096^o$};
\draw[red, -stealth] (0.45,0) arc (180:115.4904:0.325);

\draw (1.1,0.2)node[] {$\scriptstyle 136.9069^o$};
\draw[red, -stealth] (1.15,0) arc (0:136.9069:0.15);
%\draw[red, -stealth] (0,2) arc (90:145:2);
%\draw[dashed] (0,0) -- node[pos=0.8, above right] {$\omega_z$}(125:3.5) node[solid, fill=white, circle,draw=black] {};
%\draw[dashed] (0,0) -- node[pos=0.8, above right] {$\omega_z$}(125:3.5) node[solid, cross out,draw=black] {};
%\draw[dashed] (0,0) -- (125:3.5) node[solid, cross out,draw=black] {};
%\draw[black, -stealth] (1.75,0) node[pos=0.1,above right] {$\theta=120^o$} arc (0:125:1.75);
%
%%\draw[dashed]  (-5,0) node[below left] {$-\xi_p\omega_p$} --  (-5,-3) node[solid, cross out,draw=black] {};
%%\draw[dashed]  (-2,0) node[below left] {$-\xi_z\omega_z$} --  (-2,-3) node[solid, fill=white, circle,draw=black] {};
%%\draw[dashed]  (-2,0) node[below left] {$-\xi$} -- (-2,2.85);
%%\draw[dashed]  (0,2.85) node[below left] {$\omega_n$} -- (-2,2.85);
%\draw[dashed]  (-2,0) node[below left] {$-2$} -- (-2,2.867);
%\draw[dashed]  (0,2.867) node[below left] {$j2\sqrt{(3)}$} -- (-2,2.867);
%\draw[dashed]  (125:3.5) -- (-4,0) node[solid, cross out,draw=black] {};
%\draw (-4,0) node [below left] {-4};
%\draw[black, -stealth] (-2,2)  arc (0:-180:0.3);
%\draw (-3,2.25)node[] {$\theta=30^o$};
\end{tikzpicture}


\end{document}
\documentclass{standalone}
\usepackage{tikz}
\usetikzlibrary{positioning}
\usetikzlibrary{shapes,arrows,calc}
\usetikzlibrary{decorations.text}
\tikzset{add/.style n args={4}{
		minimum width=6mm,
		path picture={
			\draw[black]
			(path picture bounding box.south east) -- (path picture bounding box.north west)
			(path picture bounding box.south west) -- (path picture bounding box.north east);
			\node at ($(path picture bounding box.south)+(0,0.13)$)     {\tiny #1};
			\node at ($(path picture bounding box.west)+(0.13,0)$)      {\tiny #2};
			\node at ($(path picture bounding box.north)+(0,-0.13)$)        {\tiny #3};
			\node at ($(path picture bounding box.east)+(-0.13,0)$)     {\tiny #4};
		}
	}
}
\begin{document}

%\begin{figure}
%\centering
	\tikzstyle{block} = [draw, fill=blue!20, rectangle, minimum height=3em, minimum width=4em]
	\tikzstyle{controller} = [draw, fill=red!20, rectangle, minimum height=3em, minimum width=4em]
	\tikzstyle{sum} = [draw, fill=blue!20, circle, node distance=1cm]
	\tikzstyle{input} = [coordinate]
	\tikzstyle{output} = [coordinate]
	\tikzstyle{sampleSP} = [coordinate]
	\tikzstyle{sampleEP} = [coordinate]
	\tikzstyle{otherPoint} = [coordinate]
	\begin{tikzpicture}[auto, >=latex']
	% Nodes
	\node [input] (input) {};
	%\node [sum, right = 1cm of input] (sum) {};
	\node[draw,circle,add={--}{+}{}{},right of= input](sum){};
	\node [sampleSP, right = 1cm of sum] (sumSP) {};
	\node [sampleEP, right = 1cm of sumSP] (sumEP) {};
	\node [sampleEP, above = 1cm of sumEP] (sumEPTOP) {};
	\node [block, right = 1 cm of sumEP] (systemK) {$K$};
	%\node [block, right = 1 cm of systemK] (system2) {$\frac{1-e^{-s}}{s}$};
	%\node [controller, right = 1 cm of systemK] (system3) {$\frac{1}{s+1}$};
	\node [controller, right = 1 cm of systemK] (systemEND) {$G(z)$};
	\node [otherPoint,right = 1 cm of systemEND] (branchPoint) {};
	\node [otherPoint,below = 1 cm of systemEND] (belowsystem) {}; %{$\frac{1}{Ts+1}$};
	%\node [block, right = 1cm of system] (system2) {$\frac{1}{Ts+1}$};
	\node [output, right = 2cm of branchPoint] (outputY) {};
	\node [input, below = 0.5cm of systemEND] (m) {};
%	\node [block, right = 0.75 of belowsystem] (systemH) {$H_1(s)$};

	% Second Sampler Point
%	\node [sampleSP, left = 1cm of systemH] (sysHSP2) {};
%	\node [sampleEP, left = 1cm of sysHSP2] (sysHEP2) {};
%	\node [sampleEP, above = 1cm of sysHEP2] (sumEPTOP2) {};

	% Second block
%	\node [block, left = 1.5cm of sysHEP2] (systemH2) {$H_2(s)$};
%	% Arrows
	\draw [draw,->] (input) -- node {$r(t)$} (sum);
%	% Arrows for first sampler
	\draw [-] (sum) -- node {$e(t)$} (sumSP);
	\draw [-,thick] (sumEPTOP) -- node {$\delta_\tau$} (sumSP);
	% Arrows for block diagrams
	\draw [->] (sumEP) -- node {} (systemK);
	\draw [->] (systemK) -- node {} (systemEND);
	%\draw [->] (system2) -- node {} (systemEND);
	%\draw [->] (system3) -- node {} (systemEND);
%	%Arrows for second sampler (bottom)
%	\draw [-]  (sysHSP2)-- node {$M(s)$} (systemH);
%	\draw [-,thick] (sysHSP2) -- node {$\delta_\tau$} (sumEPTOP2);
%	%\draw [->] (sumEP) -- node {$M^\ast(s)$} (systemH);
%	% \draw [->] (system) --  (system2);
	% G(s) to branchpoint
	\draw [-] (systemEND) --  (branchPoint);
	\draw [->] (branchPoint) -- node (y) {$C(s)$}(outputY);
	%\draw [-] (outputY) |- (system) {};
	\draw [-] (branchPoint) |- (m) {} ;
%	\draw [<-] (systemH2) -- node {$M^\ast(s)$} (sysHEP2);
%	\draw [->] (systemH2) -| (sum); %{$-$}  node [near end] {} (sum);
	\draw [->] (m) -| node[pos=0.99] {} node [near end] {} (sum); %{$-$}  node [near end] {} (sum);
	\end{tikzpicture}
%\end{figure}
\end{document}\documentclass[%
% border=1pt
border={-25pt 0pt 0pt 0pt} % left bottom right top
]{standalone}
\usepackage{tikz}
\usepackage{amsmath}
\usetikzlibrary{positioning}
\usetikzlibrary{shapes,arrows,calc}
\usetikzlibrary{decorations.text}
\tikzset{add/.style n args={4}{
minimum width=6mm,
path picture={
\draw[black]
(path picture bounding box.south east) -- (path picture bounding box.north west)
(path picture bounding box.south west) -- (path picture bounding box.north east);
\node at ($(path picture bounding box.south)+(0,0.13)$) {\tiny #1};
\node at ($(path picture bounding box.west)+(0.13,0)$) {\tiny #2};
\node at ($(path picture bounding box.north)+(0,-0.13)$) {\tiny #3};
\node at ($(path picture bounding box.east)+(-0.13,0)$) {\tiny #4};
}
}
}
\begin{document}
%\begin{figure}
%\centering
\tikzstyle{block} = [draw, fill=blue!20, rectangle, minimum height=3em, minimum width=4em]
\tikzstyle{controller} = [draw, fill=red!20, rectangle, minimum height=3em, minimum width=4em]
\tikzstyle{sum} = [draw, fill=blue!20, circle, node distance=1cm]
\tikzstyle{input} = [coordinate]
\tikzstyle{output} = [coordinate]
\tikzstyle{sampleSP} = [coordinate]
\tikzstyle{sampleEP} = [coordinate]
\tikzstyle{otherPoint} = [coordinate]
\begin{tikzpicture}[auto, >=latex']
% Nodes
\node [input] (input) {};
%\node [sum, right = 1cm of input] (sum) {};
\node[draw,circle,add={--}{+}{}{},right of= input](sum){};
\node [sampleSP, right = 1cm of sum] (sumSP) {};
\node [sampleEP, right = 1cm of sumSP] (sumEP) {};
\node [sampleEP, above = 1cm of sumEP] (sumEPTOP) {};
\node [block, right = 1cm of sumEP] (systemK) {$K$};
\node [block, right = 1cm of systemK] (systemZOH) {$\cfrac{1-e^{-s}}{s}$};
\node [controller, right = 1cm of systemZOH] (system) {$\cfrac{1}{s(s+1)}$};
\node [otherPoint,right = 1cm of system] (branchPoint) {};
\node [otherPoint,below = 1 cm of system] (belowsystem) {}; %{$\frac{1}{Ts+1}$};
%\node [block, right = 1cm of system] (system2) {$\frac{1}{Ts+1}$};
\node [output, right = 1cm of branchPoint] (output) {};
\node [input, below = 0.5cm of system] (m) {};
% Arrows
\draw [draw,->] (input) -- node {$R$} (sum);
% Arrows for first sampler
\draw [-] (sum) -- node {$E(s)$} (sumSP);
\draw [-,thick] (sumEPTOP) -- node {$\delta_\tau$} (sumSP);
\draw [->] (sumEP) -- node {$E^\ast(s)$} (systemK);
\draw [->] (systemK) -- node {} (systemZOH);
\draw [->] (systemZOH) -- node {} (system);
%\draw [->] (sumEP) -- node {$M^\ast(s)$} (systemH);
% \draw [->] (system) -- (system2);
\draw [-] (system) -- (branchPoint);
\draw [->] (branchPoint) -- node (y) {$C(s)$}(output);
\draw [-] (y) |- (m) {} ;
\draw [->] (m) -| (sum); %{$-$} node [near end] {} (sum);
\end{tikzpicture}
%\end{figure}
\end{document}\documentclass[%
% border=1pt
border={-25pt 0pt 0pt 0pt} % left bottom right top
]{standalone}
\usepackage{amsmath}
\usepackage{tikz}
\usetikzlibrary{positioning}
\usetikzlibrary{shapes,arrows,calc}
\usetikzlibrary{decorations.text}
\tikzset{add/.style n args={4}{
minimum width=6mm,
path picture={
\draw[black]
(path picture bounding box.south east) -- (path picture bounding box.north west)
(path picture bounding box.south west) -- (path picture bounding box.north east);
\node at ($(path picture bounding box.south)+(0,0.13)$) {\tiny #1};
\node at ($(path picture bounding box.west)+(0.13,0)$) {\tiny #2};
\node at ($(path picture bounding box.north)+(0,-0.13)$) {\tiny #3};
\node at ($(path picture bounding box.east)+(-0.13,0)$) {\tiny #4};
}
}
}
\begin{document}
%\begin{figure}
%\centering
\tikzstyle{block} = [draw, fill=blue!20, rectangle, minimum height=3em, minimum width=4em]
\tikzstyle{controller} = [draw, fill=red!20, rectangle, minimum height=3em, minimum width=4em]
\tikzstyle{sum} = [draw, fill=blue!20, circle, node distance=1cm]
\tikzstyle{input} = [coordinate]
\tikzstyle{output} = [coordinate]
\tikzstyle{sampleSP} = [coordinate]
\tikzstyle{sampleEP} = [coordinate]
\tikzstyle{otherPoint} = [coordinate]
\begin{tikzpicture}[auto, >=latex']
% Nodes
\node [input] (input) {};
%\node [sum, right = 1cm of input] (sum) {};
\node[draw,circle,add={--}{+}{}{},right of= input](sum){};
%\node [sampleSP, right = 1cm of sum] (sumSP) {};
%\node [sampleEP, right = 1cm of sumSP] (sumEP) {};
%\node [sampleEP, above = 1cm of sumEP] (sumEPTOP) {};
\node [block, right = 2cm of sum] (system) {$\cfrac{K}{s+1}$}; % node[label=below:$b_1$,draw]{};
\node [below = 0.005 cm of system] (PointHeader) {\scriptsize{$G(s)$}};
\node [otherPoint,right = 1cm of system] (branchPoint) {};
\node [otherPoint,below = 1 cm of system] (belowsystem) {}; %{$\frac{1}{Ts+1}$};
%\node [block, right = 1cm of system] (system2) {$\frac{1}{Ts+1}$};
\node [output, right = 2cm of branchPoint] (output) {};
%\node [input, below = 0.5cm of system] (m) {};
\node [otherPoint, right = 1.25 of belowsystem] (systemRightDownP) {$H_1(s)$};
% Second Sampler Point
\node [sampleSP, below = 0.5cm of systemRightDownP] (sysHSP2) {};
\node [sampleEP, left = 1cm of sysHSP2] (sysHEP2) {};
\node [sampleEP, above = 1cm of sysHEP2] (sumEPTOP2) {};
% Second block
\node [block, left = 0.75cm of sysHEP2] (systemH2) {$\cfrac{1-e^{-Ts}}{s}$};
% Arrows
\draw [draw,->] (input) -- node {$R$} (sum);
% Arrows for first sampler
% \draw [-] (sum) -- node {$E(s)$} (sumSP);
% \draw [-,thick] (sumEPTOP) -- node {$\delta_\tau$} (sumSP);
\draw [->] (sum) -- node {$E(s)$} (system);
%Arrows for second sampler (bottom)
% \draw [-] (sysHSP2)-- node {$M(s)$} (systemH);
\draw [-,thick] (sysHSP2) -- node {$\delta_\tau$} (sumEPTOP2);
%\draw [->] (sumEP) -- node {$M^\ast(s)$} (systemH);
% \draw [->] (system) -- (system2);
\draw [-] (system) -- (branchPoint);
\draw [->] (branchPoint) -- node (y) {$C(s)$}(output);
\draw [-] (y) |- (sysHSP2) {};
%\draw [-] (y) |- (m) {} ;
%\draw [<-] (systemH2) -- node {$M^\ast(s)$} (sysHEP2);
\draw [->] (sysHEP2) -- (systemH2);
\draw [->] (systemH2) -| node [near end] {$B(s)$} (sum) ; %{$-$} node [near end] {} (sum);
%\node [otherPoint, below = 1.25cm of sum] (Text) {$B(s)$};
%\draw [->] (m) -| node[pos=0.99] {} node [near end] {} (sum); %{$-$} node [near end] {} (sum);
\end{tikzpicture}
%\end{figure}
\end{document}\documentclass{standalone}
\usepackage{tikz}
\usetikzlibrary{positioning}
\usetikzlibrary{shapes,arrows,calc}
\usetikzlibrary{decorations.text}
\tikzset{add/.style n args={4}{
minimum width=6mm,
path picture={
\draw[black]
(path picture bounding box.south east) -- (path picture bounding box.north west)
(path picture bounding box.south west) -- (path picture bounding box.north east);
\node at ($(path picture bounding box.south)+(0,0.13)$) {\tiny #1};
\node at ($(path picture bounding box.west)+(0.13,0)$) {\tiny #2};
\node at ($(path picture bounding box.north)+(0,-0.13)$) {\tiny #3};
\node at ($(path picture bounding box.east)+(-0.13,0)$) {\tiny #4};
}
}
}
\begin{document}
%\begin{figure}
%\centering
\tikzstyle{block} = [draw, fill=blue!20, rectangle, minimum height=3em, minimum width=4em]
\tikzstyle{controller} = [draw, fill=red!20, rectangle, minimum height=3em, minimum width=4em]
\tikzstyle{sum} = [draw, fill=blue!20, circle, node distance=1cm]
\tikzstyle{input} = [coordinate]
\tikzstyle{output} = [coordinate]
\tikzstyle{sampleSP} = [coordinate]
\tikzstyle{sampleEP} = [coordinate]
\tikzstyle{otherPoint} = [coordinate]
\begin{tikzpicture}[auto, >=latex']
% Nodes
\node [input] (input) {};
%\node [sum, right = 1cm of input] (sum) {};
\node[draw,circle,add={--}{+}{}{},right of= input](sum){};
\node [sampleSP, right = 1cm of sum] (sumSP) {};
\node [sampleEP, right = 1cm of sumSP] (sumEP) {};
\node [sampleEP, above = 1cm of sumEP] (sumEPTOP) {};
\node [block, right = 1 cm of sumEP] (systemK) {$K$};
\node [block, right = 0.5 cm of systemK] (system2) {$\frac{1-e^{-s}}{s}$};
\node [controller, right = 1 cm of system2] (system3) {$\frac{1}{s+1}$};
\node [controller, right = 0.5 cm of system3] (systemEND) {$\frac{1}{s}$};
\node [otherPoint,right = 1 cm of systemEND] (branchPoint) {};
\node [otherPoint,below = 1 cm of systemEND] (belowsystem) {}; %{$\frac{1}{Ts+1}$};
%\node [block, right = 1cm of system] (system2) {$\frac{1}{Ts+1}$};
\node [output, right = 2cm of branchPoint] (outputY) {};
\node [input, below = 0.5cm of systemEND] (m) {};
% \node [block, right = 0.75 of belowsystem] (systemH) {$H_1(s)$};
% Second Sampler Point
% \node [sampleSP, left = 1cm of systemH] (sysHSP2) {};
% \node [sampleEP, left = 1cm of sysHSP2] (sysHEP2) {};
% \node [sampleEP, above = 1cm of sysHEP2] (sumEPTOP2) {};
% Second block
% \node [block, left = 1.5cm of sysHEP2] (systemH2) {$H_2(s)$};
% % Arrows
\draw [draw,->] (input) -- node {$r(t)$} (sum);
% % Arrows for first sampler
\draw [-] (sum) -- node {$e(t)$} (sumSP);
\draw [-,thick] (sumEPTOP) -- node {$\delta_\tau$} (sumSP);
% Arrows for block diagrams
\draw [->] (sumEP) -- node {} (systemK);
\draw [->] (systemK) -- node {} (system2);
\draw [->] (system2) -- node {} (system3);
\draw [->] (system3) -- node {} (systemEND);
% %Arrows for second sampler (bottom)
% \draw [-] (sysHSP2)-- node {$M(s)$} (systemH);
% \draw [-,thick] (sysHSP2) -- node {$\delta_\tau$} (sumEPTOP2);
% %\draw [->] (sumEP) -- node {$M^\ast(s)$} (systemH);
% % \draw [->] (system) -- (system2);
% G(s) to branchpoint
\draw [-] (systemEND) -- (branchPoint);
\draw [->] (branchPoint) -- node (y) {$C(s)$}(outputY);
%\draw [-] (outputY) |- (system) {};
\draw [-] (branchPoint) |- (m) {} ;
% \draw [<-] (systemH2) -- node {$M^\ast(s)$} (sysHEP2);
% \draw [->] (systemH2) -| (sum); %{$-$} node [near end] {} (sum);
\draw [->] (m) -| node[pos=0.99] {} node [near end] {} (sum); %{$-$} node [near end] {} (sum);
\end{tikzpicture}
%\end{figure}
\end{document}\documentclass[border={10pt}]{standalone}
\usepackage{tikz,pgfplots,filecontents,amsmath}
\pgfplotsset{compat=1.5}
\begin{filecontents}{data.dat}
n yn
-1 0
0 6
1 2
2 4
3 4
4 4
5 4
6 4
\end{filecontents}
\begin{document}
\begin{tikzpicture}
\begin{axis}
[%%%%%%%%%%%%%%%%%%%%%%%%%%%%%%%%%%%
axis x line=middle,
axis y line=middle,
every axis x label={at={(current axis.right of origin)},anchor=north west},
%every axis y label={at={(current axis.above origin)},anchor= north west},
every axis plot post/.style={mark options={fill=black}},
xlabel={$k$},
ylabel={$\boldsymbol{y[k]}$},
xtick={0,1, ..., 6},
xmax=7,
ymin=0,
ymax=8,
yticklabels={
$0$,
$0$,
$0.5a+b$,
$1$,
$a$
},
]%%%%%%%%%%%%%%%%%%%%%%%%%%%%%%%%%%%
\addplot+[ycomb,black,thick] table [x={n}, y={yn}] {data.dat};
%\addplot[mark=*] coordinates {(1,2)} node[pin=45:{}]{} ;
\addplot[] coordinates {(0,5.825)} node[pin=320:{arbitrary points at $x(0)$ and $x(1)$}]{} ;
\end{axis}
\end{tikzpicture}
\end{document}
\documentclass{standalone}

\usepackage{blox}
\usepackage{tikz}
\usepackage{steinmetz}
\usetikzlibrary{positioning}

\usetikzlibrary{circuits}
\begin{document}

\begin{tikzpicture}
\bXInput{E}
\bXChain[2]{E}%
{Md/IF,fred/$ID\phase{RR}$,head/EXE,Fun/Mem, Games/WB}
\end{tikzpicture}
\end{document}\documentclass[border={10pt}]{standalone}
\usepackage{tikz,pgfplots,filecontents,amsmath}
\pgfplotsset{compat=1.5}
\begin{filecontents}{data.dat}
n yn
0 1
1 2
2 4
3 6
4 8
5 10
6 12
7 14
8 16
9 0
10 0
\end{filecontents}
\begin{document}
\begin{tikzpicture}
\begin{axis}
[%%%%%%%%%%%%%%%%%%%%%%%%%%%%%%%%%%%
axis x line=middle,
axis y line=middle,
every axis x label={at={(current axis.right of origin)},anchor=north west},
every axis y label={at={(current axis.above origin)},anchor= north west},
every axis plot post/.style={mark options={fill=black}},
xlabel={$n$},
ylabel={$\boldsymbol{y[n]}$},
xtick={0,1, ..., 11},
xmax=11,
yticklabels={
$a^0$,
$a^1$,
$a^2$,
$a^3$,
$a^4$,
$a^5$,
$a^6$,
$a^7$,
$a^8$,
$a^9$,
$a^10$
},
ymin=0,
ymax=20,
]%%%%%%%%%%%%%%%%%%%%%%%%%%%%%%%%%%%
\addplot+[ycomb,black,thick] table [x={n}, y={yn}] {data.dat};
\end{axis}
\end{tikzpicture}
\end{document}
\documentclass[border={10pt}]{standalone}
\usepackage{tikz,pgfplots,filecontents,amsmath}
\pgfplotsset{compat=1.5}

\begin{filecontents}{data.dat}
 n   yn
-2   0.0
-1   0.0
 0   1.0
 1   2.0
 2   3.0
 3   4.0
 4   4.0
 5   4.0
 6   4.0
 7   4.0
 8   4.0
% 3   0.0
 %4   0.0
% 5   0.0
\end{filecontents}


\begin{document}

\begin{tikzpicture}
\begin{axis}
[%%%%%%%%%%%%%%%%%%%%%%%%%%%%%%%%%%%
    axis x line=middle,
    axis y line=middle,
    every axis x label={at={(current axis.right of origin)},anchor=north west},
    every axis y label={at={(current axis.above origin)},anchor= north west},
    every axis plot post/.style={mark options={fill=black}},
    xlabel={$n$},
    ylabel={$\boldsymbol{y[n]}$},
    xtick={-2,0, ..., 8},
    ymin=0,
    ymax=4,
]%%%%%%%%%%%%%%%%%%%%%%%%%%%%%%%%%%%
\addplot+[ycomb,black,thick] table [x={n}, y={yn}] {data.dat};
\end{axis}
\end{tikzpicture}

\end{document}
\documentclass[border={10pt}]{standalone}
\usepackage{tikz,pgfplots,filecontents,amsmath}
\pgfplotsset{compat=1.5}

\begin{filecontents}{dataX.dat}
 n   xn
 0   1.0
 1   2.0
 2   3.0
 3   2.0
 4   1.0
 5   1.0
 6   1.0
 7   1.0
 8   1.0
 9   1.0
 10  1.0
\end{filecontents}

\begin{filecontents}{dataY.dat}
	n   yn
	0   2.0
	1   1.0
	2   2.0
	3   -1.0
	4   2.0
	5   3.0
	6   1.0
	7   1.0
	8   1.0
	9   1.0
	10  1.0
\end{filecontents}

\begin{document}

\begin{tikzpicture}
\begin{axis}
[%%%%%%%%%%%%%%%%%%%%%%%%%%%%%%%%%%%
    axis x line=middle,
    axis y line=middle,
    every axis x label={at={(current axis.right of origin)},anchor=north west},
    every axis y label={at={(current axis.above origin)},anchor= north west},
    every axis plot post/.style={mark options={fill=black}},
    xlabel={$n$},
    ylabel={$\boldsymbol{x[n]}$},
    xtick={0,2,...,10},
    ymin=-1,
    ymax=3,
]%%%%%%%%%%%%%%%%%%%%%%%%%%%%%%%%%%%
\addplot+[ycomb,black,thick] table [x={n}, y={xn}] {dataX.dat};
\end{axis}
\end{tikzpicture}
\begin{tikzpicture}
\begin{axis}
[%%%%%%%%%%%%%%%%%%%%%%%%%%%%%%%%%%%
axis x line=middle,
axis y line=middle,
every axis x label={at={(current axis.right of origin)},anchor=north west},
every axis y label={at={(current axis.above origin)},anchor= north west},
every axis plot post/.style={mark options={fill=black}},
xlabel={$n$},
ylabel={$\boldsymbol{y[n]}$},
xtick={0,2,...,10},
ymin=-1,
ymax=3,
]%%%%%%%%%%%%%%%%%%%%%%%%%%%%%%%%%%%
\addplot+[ycomb,black,thick] table [x={n}, y={yn}] {dataY.dat};
\end{axis}
\end{tikzpicture}


\end{document}
\documentclass[border={10pt}]{standalone}
\usepackage{tikz,pgfplots,filecontents,amsmath}
\pgfplotsset{compat=1.5}

\begin{filecontents}{data.dat}
 n   yn
0    1
1   -1
2	 0
3    3
\end{filecontents}


\begin{document}
\begin{tikzpicture}
\begin{axis}
[%%%%%%%%%%%%%%%%%%%%%%%%%%%%%%%%%%%
    axis x line=middle,
    axis y line=middle,
    every axis x label={at={(current axis.right of origin)},anchor=north west},
    every axis y label={at={(current axis.above origin)},anchor= north west},
    every axis plot post/.style={mark options={fill=black}},
    xlabel={$n$},
    ylabel={$\boldsymbol{y[n]}$},
    xtick={-1,0,2,3, 4},
    xmax=4,
    ymin=-2,
    ymax=3,
]%%%%%%%%%%%%%%%%%%%%%%%%%%%%%%%%%%%
\addplot+[ycomb,black,thick] table [x={n}, y={yn}] {data.dat};
\end{axis}
\end{tikzpicture}

\end{document}
\documentclass[border={10pt}]{standalone}
\usepackage{tikz,pgfplots,filecontents,amsmath}
\pgfplotsset{compat=1.5}

\begin{filecontents}{data.dat}
 n   hn
 0   2
 1   -3
 2   2.0
% 3   0.0
 %4   0.0
% 5   0.0
\end{filecontents}


\begin{document}

\begin{tikzpicture}
\begin{axis}
[%%%%%%%%%%%%%%%%%%%%%%%%%%%%%%%%%%%
    axis x line=middle,
    axis y line=middle,
    every axis x label={at={(current axis.right of origin)},anchor=north west},
    every axis y label={at={(current axis.above origin)},anchor= north west},
    every axis plot post/.style={mark options={fill=black}},
    xlabel={$n$},
    ylabel={$\boldsymbol{h[n]}$},
    xtick={-1,0,2,4},
    ymin=-3,
    ymax=3,
]%%%%%%%%%%%%%%%%%%%%%%%%%%%%%%%%%%%
\addplot+[ycomb,black,thick] table [x={n}, y={hn}] {data.dat};
\end{axis}
\end{tikzpicture}

\end{document}
\documentclass{standalone}
\usepackage{pst-sigsys}	%Not used in the creation of this document
\usepackage{tikz}
\usetikzlibrary{arrows,automata}
\usetikzlibrary{automata,positioning,arrows.meta}
\usetikzlibrary{circuits}
\begin{document}

\tikzset{%
	block/.style    = {draw, thick, rectangle, minimum height = 3em,
		minimum width = 3em},
	mult/.style    = {draw, circle, node distance = 2cm}, % Multipler
	sum/.style      = {draw, circle, node distance = 2cm}, % Adder
	input/.style    = {coordinate}, % Input
	output/.style   = {coordinate} % Output
	label/.style   = {draw=none} % Text label

}
\newcommand{\suma}{\Large$+$}
\newcommand{\mult}{\Large$\times$}
\newcommand{\inte}{$\displaystyle \int$}
\newcommand{\derv}{\Huge$\frac{d}{dt}$}

\begin{tikzpicture}[auto, node distance=2cm,thick]
\matrix[column sep = .75cm, row sep = .75cm]
{   & & & & & & &\\
	\node [coordinate](a1){}; & \node [block](A2){$\{b_k\}=\{1,1,1,1\}$}; &
	\node [coordinate](a3){}; & & & & &\\
	\node (x){$x[n]$}; & & \node [sum](add1){\suma}; &  &\node [coordinate](b5){}; & \node [block](B6){$\{b_k\}=\{1,-1\}$}; & \node [coordinate](b7){};& \node [coordinate](b8){}; \\
	\node [coordinate](c1){}; & \node [block](C2){$\{b_k\}=\{1,1,1,1\}$}; & \node [coordinate](c3){}; & & & & &\\
	& & & & & & &\\
};
\draw [-] (x) to (a1);
\draw [->] (a1) to (A2);
\draw [-] (A2) to (a3);
\draw [->] (a3) to (add1);
\draw [-] (x) to (c1);
\draw [->] (c1) to (C2);
\draw [-] (C2) to (c3);
\draw [->] (c3) to (add1);
\draw [->] (add1) to (B6);
\draw [->] (B6) to (b7);

%draw S text labels
\node[label,shift={(0,0.75)}] at (A2) {System $S_1$};
\node[label,shift={(0,-0.75)}] at (C2) {System $S_2$};
\node[label,shift={(0,-0.75)}] at (B6) {System $S_3$};
\node[label,shift={(-0.25,0.25)}] at (a3) {$y_1[n]$};
\node[label,shift={(-0.25,-0.25)}] at (c3) {$y_2[n]$};
\node[label,shift={(-0.25,0.25)}] at (b5) {$w[n]$};
\node[label,shift={(-0.25,0)}] at (b8) {$y[n]$};
\end{tikzpicture}

\end{document}
\documentclass[border={10pt}]{standalone}
\usepackage{tikz,pgfplots,filecontents,amsmath}
\pgfplotsset{compat=1.5}

\begin{document}

\begin{tikzpicture}
\begin{axis}
[%%%%%%%%%%%%%%%%%%%%%%%%%%%%%%%%%%%
height=5cm,
width=\textwidth,
    axis x line=middle,
    axis y line= none,
%    ylabel={Signal Spectrum of $x(t)$},
     every axis x label={at={(current axis.left of origin)},anchor=south west},
%    every axis y label={at={(current axis.above origin)},anchor= north west},
    %every axis plot post/.style={mark options={fill=black}},
    % every axis plot/.append style={ultra thick},
   xlabel={$f$},
%    ylabel={$\boldsymbol{x[n]}$},
    xtick={0,1,...,11},
    ymax=150,
    xmax=11,
    xmin=-1,
]%%%%%%%%%%%%%%%%%%%%%%%%%%%%%%%%%%%
%\addplot+[ycomb,black,thick] table [x={n}, y={xn}] {data.dat};
\addplot+[ycomb,black] plot coordinates
{(0,1) (1,2) (2,4) (3,8) (4,16) (5,32) (6,64) (7,128) (8,0) (9,0) (10,0)};
\node[label={{$1$}}] at (axis cs:0.25,1) {};
\node[label={{$a^{1}$}}] at (axis cs:1,2) {};
\node[label={{$a^{2}$}}] at (axis cs:2,3) {};
\node[label={{$a^{3}$}}] at (axis cs:3,6) {};
\node[label={{$a^{4}$}}] at (axis cs:4,10) {};
\node[label={{$a^{5}$}}] at (axis cs:5,30) {};
\node[label={{$a^{6}$}}] at (axis cs:6,60) {};
\node[label={{$a^{7}$}}] at (axis cs:7,110) {};
\node[label={{$0$}}] at (axis cs:8,0) {};
\node[label={{$0$}}] at (axis cs:9,0) {};
\node[label={{$0$}}] at (axis cs:10,0) {};
\end{axis}
\end{tikzpicture}

\end{document}
\documentclass[border={10pt}]{standalone}
\usepackage{tikz,pgfplots,filecontents,amsmath}
\pgfplotsset{compat=1.5}

\begin{document}

\begin{tikzpicture}
\begin{axis}
[%%%%%%%%%%%%%%%%%%%%%%%%%%%%%%%%%%%
height=5cm,
width=\textwidth,
    axis x line=middle,
    axis y line= none,
%    ylabel={Signal Spectrum of $x(t)$},
     every axis x label={at={(current axis.left of origin)},anchor=south west},
%    every axis y label={at={(current axis.above origin)},anchor= north west},
    %every axis plot post/.style={mark options={fill=black}},
    % every axis plot/.append style={ultra thick},
   xlabel={$f$},
%    ylabel={$\boldsymbol{x[n]}$},
    xtick={0,1,...,7,9,10,11},
    ymin=-40,
    ymax=10,
    xmax=11,
    xmin=-1,
]%%%%%%%%%%%%%%%%%%%%%%%%%%%%%%%%%%%
%\addplot+[ycomb,black,thick] table [x={n}, y={xn}] {data.dat};
\addplot+[ycomb,black] plot coordinates
{(0,1) (1,0) (2,0) (3,0) (4,0) (5,0) (6,0) (7,0) (8,-32) (9,0) (10,0)};
\node[label={{$1$}}] at (axis cs:0,0) {};
\node[label={{$0$}}] at (axis cs:1,0) {};
\node[label={{$0$}}] at (axis cs:2,0) {};
\node[label={{$0$}}] at (axis cs:3,0) {};
\node[label={{$0$}}] at (axis cs:4,0) {};
\node[label={{$0$}}] at (axis cs:5,0) {};
\node[label={{$0$}}] at (axis cs:6,0) {};
\node[label={{$0$}}] at (axis cs:7,0) {};
\node[label={{$-a^{8}$}}] at (axis cs:8,-45) {};
\node[label={{$0$}}] at (axis cs:9,0) {};
\node[label={{$0$}}] at (axis cs:10,0) {};
\end{axis}
\end{tikzpicture}

\end{document}
\documentclass[tikz,border=3.14mm]{standalone}
\usepackage{pgfplots}
\pgfplotsset{compat=1.16}
\pgfplotsset{width=5.5in,compat=1.10}
\begin{document}
  \begin{tikzpicture}
  \begin{axis}[axis lines=middle,
  xmin=-6, xmax=6,
        ymin=-6,ymax=6,
                xlabel = $x$,
                ylabel = $y$]
\addplot [->, thick,  red]
        coordinates { (0,0) (sqrt(3),1)} node[above right,pos=1] {$v_1$};
\addplot [->, thick,  blue]
        coordinates { (0,0) (0,2)} node[above right,pos=1] {$v_2$};

\addplot+ [mark=none,black] table {
0.5 1
-0.5 1
-1 0
-0.5 -1
0.5 -1
1 0
0.5 1
};
\pgfplotsinvokeforeach{-6,-4,...,6}{
\addplot[only marks, mark=o, samples
at={-5.19,-3.46,-1.73,0,1.73,3.46,5.19}]{-0.55*x + #1};}
\end{axis}
\end{tikzpicture}
\end{document}\documentclass{standalone}
\usepackage{tikz}
\usetikzlibrary{positioning, calc}
\begin{document}
\begin{tikzpicture}[align=center,node distance=0.5cm]
\tikzset{
darkstyle/.style={circle,draw,fill=gray!40,minimum size=20},
filled/.style={circle,draw,fill=gray!60, minimum size=5},
white/.style={circle,draw, minimum size=5,,xshift=-0.5cm},
}
% number of vertices
\def \n {5}
\def \xshift{2cm}
\foreach \x in {0,...,\n}
{ \foreach \y in {0,...,\n}
{ \pgfmathtruncatemacro{\nodelabel}{\x+\y*6+1}
%\pgfmathtruncatemacro{\row}{Mod(\x,2)}
\pgfmathparse{Mod(\y,2)==0?1:0}
\ifnum\pgfmathresult>0
\node[filled] (\nodelabel) at (0.75*\x,-0.75*\y) {};
\else
\node[white] (\nodelabel) at (0.75*\x,-0.75*\y) {};
\fi
}
}
% \draw[latex-latex] (19.west) -- ++ (25.west) node[midway]{label};
\draw [latex-latex] ($(19.west) + (-0.25cm, 0)$) -- ($(31.west) + (-0.25cm, 0)$) node[midway, fill=white]{$2\Delta_y$};
\draw [latex-latex] ($(31.south) + (0cm, -0.25cm)$) -- ($(32.south) + (0cm, -0.25cm)$) node[midway, below, yshift=-0.1cm, fill=white]{$\Delta_x$};
% Add nodes for ts
% \draw[latex-latex] ($(7.south) + (-0.25cm, -0.25cm)$) -- ($(1.south) + (-0.25cm, -0.25cm)$) node[midway, below, yshift=-0.1cm, fill=white]{$\Delta_x$};
\node[filled, left = of 1, xshift =-0.25cm] (aa) {};
\node[white, left = of 7, xshift =-0.15cm] (ab) {};
\draw [latex-latex] ($(ab) + (0cm, 0cm)$) -- ($(aa) + (0cm, 0cm)$) node[below, yshift=-0.2cm]{$\frac{\Delta_t}{2}$};
\end{tikzpicture}
\end{document} \documentclass[varwidth]{standalone}
\usepackage{tikz}
\usepackage{xcolor}
\usetikzlibrary{positioning}
\usetikzlibrary{backgrounds}
\tikzset{
% styling for filled node
filled/.style={circle,draw,fill=green!60, minimum size=5},
% styling for white nodes
empty/.style={circle,draw, minimum size=5},
% diagram with P = 4
pics/pattern/.style args={#1/#2/#3/#4/#5}{
code={
\node[#1] at (0, 1) (#5-1) {};
\node[#2] at (1, 0) (#5-2) {};
\node[#3] at (0, -1) (#5-3) {};
\node[#4] at (-1, 0) (#5-4) {};
}},
pics/pattern/.default=empty/empty/empty/empty/a
}
\begin{document}
\begin{tikzpicture}[background rectangle/.style={fill=blue!15}, show background rectangle]
% Uniform LBP, and draw box
% U = 0 Row
\node[] at (-2,0) {U=0};
\path (0,0) pic[scale=1.0] {pattern};
\path (+3.5,0) pic[scale=1.0] {pattern=filled/filled/filled/filled/a};
% U = 2 Row
\node[] at (-2,-3) {U=2};
\path (0,-3) pic[scale=1.0] {pattern=filled/empty/empty/empty/b};
\path (+3.5,-3) pic[scale=1.0] {pattern=filled/filled/empty/empty/c};
\path (+7.0,-3) pic[scale=1.0] {pattern=filled/filled/filled/empty/d};
\node[text width= 2cm] at (7.0, 1) {\LARGE{Uniform \hfill \break Patterns}};
\end{tikzpicture}
%
\begin{tikzpicture}[background rectangle/.style={fill=red!15}, show background rectangle]
% Uniform LBP, and draw box
% U = 4 Row. i think
\node[] at (-2,0) {U=4};
\path (0,0) pic[scale=1.0] {pattern=empty/filled/empty/filled/e};
\path (+3.5,0) pic[scale=1.0] {pattern=filled/empty/filled/empty/f};
\node[text width= 4cm, align=right] at (6, 1) {\hfill \LARGE{Non-Uniform} \break \hfill \break \LARGE{Patterns}};
\end{tikzpicture}
\end{document}\documentclass{standalone}
\usepackage{pgfplots}
\pgfplotsset{compat=newest}
\begin{document}
\begin{tikzpicture}
\begin{axis}[
axis lines=middle
]
\addplot [white, line width = 1, smooth, domain=-5:5] {x};
\draw (-1,-1) rectangle (1,1);
\draw (1,-1) rectangle (3,1);
\draw (-1,-1) rectangle (-3,1);
\draw (-1,1) rectangle (1,3);
\draw (-1,-1) rectangle (1,-3);
\end{axis}
\end{tikzpicture}
\end{document}\documentclass{standalone}
\usepackage{pgfplots}
\begin{document}
\begin{tikzpicture}
\begin{axis}[
width=10cm,
height=4cm,
x axis line style={-stealth},
y axis line style={-stealth},
title={Rectangular Function},
xticklabels={0,,,a,,b},
ymax = 1.5,xmax=3,
axis lines*=center,
ytick={0.5,1},
xlabel={x $\rightarrow$},
ylabel={$R_x(a,b)$},
xlabel near ticks,
ylabel near ticks]
\addplot+[thick,mark=none,const plot]
coordinates
{(0,0) (1,0) (1,1) (2,0) (3,0) (4,1) (5,0) (6,1) (7,0)};
\end{axis}
\end{tikzpicture}
\end{document}\documentclass{article}
\usepackage{tikz,tikz-3dplot}
\begin{document}
\begin{figure}
\centering
\tdplotsetmaincoords{70}{120}
\begin{tikzpicture}[tdplot_main_coords][scale=0.75]
\tikzstyle{every node}=[font=\small]
\draw[thick,-latex] (0,0,0) -- (6,0,0) node[anchor=north east]{$x$};
\draw[thick,-latex] (0,0,0) -- (0,6,0) node[anchor=north west]{$y$};
\draw[thick,-latex] (0,0,0) -- (0,0,6) node[anchor=south]{$z$};
\draw [thick](0,0,0) circle (3);
\draw [thick](0,0,4) circle (3);
\draw [thick](1.9,-2.35,0) -- (1.9,-2.35,4) node[midway, left]{$r=r_1$ surface};
\draw [thick](-1.9,2.35,0) -- (-1.9,2.35,4);
\filldraw[fill=orange, nearly transparent] (-4,-4,4) -- (4,-4,4) -- (4,5,4) -- (-4,5,4) -- (-4,-4,4);
\filldraw[fill=blue, nearly transparent] (0,0,4) -- (5.2,6,4) -- (5.2,6,0) -- (0,0,0) -- (0,0,4);
\filldraw [color=blue](2,2.25,4) circle (0.075cm) ;
\draw (-4,5,4) node[anchor=south]{$z=z_1$ plane};
\draw (5.2,6,0) node[anchor=south west]{$\phi=\phi_1$ plane};
\node at (1.8,1,4) { $P_1(r_1,\phi_1,z_1)$};
\draw[ultra thick,-latex](2,2.25,4) -- (3,3.45,4) node[anchor=north] {$\mathbf{a}_r$};
\draw[ultra thick,-latex](2,2.25,4) -- (1,2.5,4) node[anchor=north west] {$\mathbf{a}_\phi$};
\draw[ultra thick,-latex](2,2.25,4) -- (2,2.25,4.75) node[anchor=north west] {$\mathbf{a}_z$};
\draw [thick,->](4,0,0) arc (0:45:4 and 4.5);
\draw (3.6,2,0) node[anchor=north] {$\phi_1$};
\draw[ultra thick,-latex](0,0,0) -- (2,2.35,0);
\draw (1,1,0) node[anchor=north] {$r_1$};
\draw [ultra thick] (2,2.25,4)--(1.95,2.25,0);
\draw[ultra thick](0.1,0,4) -- (-0.1,0,4) node[anchor=south west] {$z_1$};
\end{tikzpicture}
\end{figure}
\end{document}\documentclass{standalone}
\usepackage{pgfplots}
\usepgfplotslibrary{fillbetween}
\begin{document}
\begin{tikzpicture}
\begin{axis}[very thick,
samples = 100,
xlabel = H,
ylabel = B,
xmin = -7,
xmax = 7,
ymin = -4,
ymax = 4,
axis x line = middle,
axis y line = middle,
ticks = none]
\addplot[dashed] plot (\x, 2.5);
\addplot[dashed] plot (\x,-2.5);
\addplot[red, name path=A] plot (\x, {5/(1 + exp(-1.7*\x+1.5))-2.5});
\addplot[red, name path=B] plot (\x, {5/(1 + exp(-1.7*\x-1.5))-2.5});
\addplot[red!20] fill between[of=A and B];
\end{axis}
\end{tikzpicture}
\end{document}\documentclass{article}
\usepackage[paperwidth=55mm,paperheight=55mm,margin=1mm]{geometry}
\usepackage{bm}
\usepackage{eucal}
\usepackage{tikz}
\usetikzlibrary{calc}
\usetikzlibrary{decorations.markings}
\pagestyle{empty}
\parindent=0pt
\begin{document}
\pgfdeclarelayer{-1}
\pgfsetlayers{-1,main}
\tikzset{
zlevel/.style={%
execute at begin scope={\pgfonlayer{#1}},
execute at end scope={\endpgfonlayer}
},
}
\centering
\begin{tikzpicture}[
ball/.style={circle, shading=ball, ball color=black!15, minimum size=9mm},
conline/.style={line width=#1, line cap=round},
label/.style 2 args={
postaction={decorate,transform shape,decoration={
markings, mark=at position #1 with \node {\scriptsize\color{black}#2};
}}
},
blue/.style={color=blue!60},
red/.style={color=red!50},
redl/.style={color=red!20},
]
\def\conline<#1>[#2] (#3) (#4);{%
\draw[conline=#1, #2] (#3) -- (#4);
}
\def\conwhiline (#1) (#2);{%
\conline<10pt>[color=white] (#1) (#2);
}
\def\connectpos[#1] (#2) (#3) #4 #5;{%
\conline<8pt>[color=black] (#2) (#3);
\conline<7pt>[#1, label={#4}{#5}] (#2) (#3);
}
\def\connection[#1] (#2) (#3) #4;{%
\connectpos[#1] (#2) (#3) 0.5 {#4};
}
\node (B) [ball] {$\bm{B}$};
\node (D) [ball] at ($(B)+(95:4.4)$) {$\mathcal{D}$};
\begin{scope}[zlevel=-1]
\node (H) [ball] at ($(B)+(60:2.5)$) {$\mathcal{H}$};
\node (E) [ball] at ($(B)+(155:3)$) {$\bm{E}$};
\connectpos[blue] (E) (H.180) 0.35 {1-forms};
\conwhiline (B) (D);
\connection[red] (E.-45) (B) {field strength};
\connection[redl] (B) (H.-115) {magnetic};
\end{scope}
\connection[red] (D.-40) (H) {excitation};
\connectpos[blue] (D) (B) 0.35 {2-forms};
\connection[redl] (E.60) (D) {electric};
\end{tikzpicture}
\end{document}\documentclass{standalone}
\usepackage{circuitikz}
\usepackage{graphicx}
\usepackage{mathrsfs}
\usepackage{latexsym,amssymb,amsmath}
\newcommand{\equal}{=}
\begin{document}
\begin{circuitikz}[american voltages,scale =1]
\draw (0,8) to [voltage source,l_=$\mathscr{F}(\equal NI)$] (0,0) -- (4,0)
%node[anchor=south] {$v_L$}
to [R, l_= $R_{a2} \quad Air \ Gap \ 2 \ Reluctance $,color=purple] (4,2)
to [R, l_= $R_{r} \quad Rotor \ Reluctance $,color=blue] (4,4)
to [R,i^<=$\phi$, l_= $R_{a1} \quad Air \ Gap \ 1 \ Reluctance $,color=purple] (4,6)
to [R, l_= $R_{s} \quad Stator \ Reluctance $,color=red] (4,8)
(4,8) -- (0,8)
%(2,3) -- (4,3) to [L=$L$, i>^=$i_L(t)$, v=$v_L(t)$] (4,0) -- (0,0)
(2,4) node[scale=4]{$\textcolor{red}{\circlearrowright}$}
(2,4) node[scale=2]{$\textcolor{red}{\mathbf{\phi}}$};
;\end{circuitikz}
\end{document}\documentclass{standalone}
\usepackage[american]{circuitikz}
\usepackage{graphicx}
\usepackage{mathrsfs}
\usepackage{latexsym,amssymb,amsmath}
\newcommand{\equal}{=}
\begin{document}
\begin{circuitikz}
\draw (0,3) to [V,l_=$\mathscr{F}\equal NI$] (0,0)
(0,3) node[anchor=south] {$\textcolor{red}{1}$} to [R,i^>=$\phi_1$, l^=$\mathscr{R}_1$,*-,color=red] (3,3)
node[anchor=south] {$\textcolor{blue}{2}$}
to [R, l_= $\mathscr{R}_2$, *-, i>^=$\phi_2$,color=blue] (3,0)
node[anchor=north] {$\textcolor{purple}{3}$}
%(3,3) -- (6,3) to [L=$L$, i>^=$i_L(t)$, v=$v_L(t)$] (6,0) -- (0,0)
(3,3) -- (6,3) to [R=$L$,l_=$\mathscr{R}_3$, i>^=$\phi_3$, *- ,color=purple] (6,0) -- (0,0)
(6,0) -- (0,0)
;\end{circuitikz}
\label{fig:q1fig}
\end{document}\documentclass{standalone}
\usepackage{tikz}
\usepackage{siunitx}
\begin{document}
\begin{tikzpicture}[>=latex]
%\draw[style=help lines] (0,0) (3,2);
%\coordinate (vec1) at (300:1.5);
%\coordinate (vec2) at (30:2.5);
%\coordinate (vec3) at (0:2.5);
%\coordinate (vec4) at (90:2);
%\coordinate (vec5) at (270:2);
%\coordinate (vec6) at (180:2);
\coordinate (vec1) at (0:2.5);
\coordinate (vec1mid) at (0:2);
\coordinate (vec2) at (270:2.5);
\coordinate (vec3) at (315:3);
\draw[->,thick,black] (0,0) -- (vec1) node[right] {$\bar{V}_2 \angle0^\circ$};
\draw[->,thick,black] (0,0) -- (vec1mid) node[midway,above] {$I_R = 2.8 \angle0^\circ A$};
\draw[->,thick,black] (0,0) -- (vec2) node[below right] {$I_L=2.8 \angle-90^\circ$};
\draw[->,thick,black] (0,0) -- (vec3) node[midway, below, sloped] {$I_{Load} = 4 A$};
%\draw[->,thick,black] (0,0) -- (vec3) node [below] {$Re$};
%\draw[->,thick,black] (0,0) -- (vec4) node [left] {$Im$};
%\draw[->,thick,black] (0,0) -- (vec5);
%\draw[->,thick,black] (0,0) -- (vec6);
%\draw [black, thick ] (1.0,0) arc (0:30:1cm) node [midway, right] {$\theta=45^\circ$};
\draw [black, thick] (0.5,0) arc (0:-60:0.38cm) node [midway, right] {$\theta=45^\circ$};
\end{tikzpicture}
\end{document}\documentclass{standalone}
\usepackage[american]{circuitikz}
\usetikzlibrary{calc,arrows}
\usepackage{graphicx}
\usepackage{mathrsfs}
\usepackage{latexsym,amssymb,amsmath}
\newcommand{\equal}{=}
\begin{document}
\begin{circuitikz}
\draw (0,6) to [open,l=$v_1$,o-o] (0,0)
(0,6) to [R,i>=$i_1$, l^= $R_{1}$, color=red] (2,6)
(2,6) to [L,i>=$i_1$,l^= $L_{l1}$, color=blue] (4,6)
(4,6) -- (6,6)
(6,6) to [short,i=$i^\prime_e$,*-*] (6,4)
(6,4) -- (5,4)
(6,4) -- (7,4)
(5,4) to [R,i^>=$i^\prime_c$, l_= $R^{\prime}_c\equal 124K \Omega$, color=red] (5,0)
(7,4) to [L,i^<=$i^\prime_m$, l^= $L^{\prime}_m \equal 5.4 H$, color=blue] (7,0)
(6,6) to [short,i=$i^\prime_2 \equal i_2 / k$] (10,6)
(0,0) -- (10,0)
(11,6) node [yscale =2.857,transformer core](T){} % reminded by @PaulGessler, thanks.
(T.A1) node[above] {$N_1$}
(T.A2) node[below] {primary}
(T.B1) node[above] {$N_2$}
(T.B2) node[below] {secondary}
(T.base) node{K}
(T.B1) -- (12,6)
(14,6) to [L,i^<=$i_2$, l_= $L_{l2}$, color=blue] (12,6)
(14,6) to [R, l^= $R_{2}$, color=red] (16,6)
(16,6) to [generic, l_=${Load}$](16,0)
(T.B2) -- (16,0)
% (4,0) -- (0,0)
% (4,4) to [R,i^>=$\phi_2$, l^= $\mathscr{R}_{2}$,v_>=$\mathscr{F}_2$, color=blue] (4,0)
% (4,4) to [R,l^= $\mathscr{R}_{3}$,v_>=$\mathscr{F}_3$, color=red] (8,4)
% (8,4) to [R,i^>=$\phi_3$, l^= $\mathscr{R}_{g}$,v_>=$\mathscr{F}_g$, color=cyan] (8,0)
% (8,0) to [R, l^= $\mathscr{R}_{4}$,v_>=$\mathscr{F}_4$, color=green] (4,0);
% \draw[thin, <-, >=triangle 45] (6,2) node{$\phi_3$} ++(-90:1) arc (-90:100:1);
% \draw[thin, <-, >=triangle 45] (2,2) node{$\phi_2$} ++(-90:1) arc (-90:100:1);
% \node (phi) at (4.25,0.5) {$\phi_2$};
% \draw[-stealth] (4.25,2.5) to [bend left=90] (phi);
;
\coordinate (V1up) at (0.5,6);
\coordinate (V1mid1) at (0.5,3.25);
\coordinate (V1mid2) at (0.5,2.75);
\coordinate (V1down) at (0.5,0);
\node (e) at (2.5,3) {$e_{11}$};
\node (eend) at (9.5,3) {$e_{1}$};
\node (e2) at (12,3) {$e_{2}$};
\node (e3) at (14,3) {$e_{22}$};
\draw[->,black,very thick] (e) -- ($(e)!.85!(2.5,6)$); % 1 cm before end terminal
\draw[->,black,very thick] (e) -- ($(e)!.85!(2.5,0)$); % 1 cm before start terminal
\draw[->,black,very thick] (eend) -- ($(eend)!.85!(9.5,6)$); % 1 cm before end terminal
\draw[->,black,very thick] (eend) -- ($(eend)!.85!(9.5,0)$); % 1 cm before start terminal
\draw[->,black,very thick] (e2) -- ($(e2)!.85!(12,6)$); % 1 cm before end terminal
\draw[->,black,very thick] (e2) -- ($(e2)!.85!(12,0)$); % 1 cm before start terminal
\draw[->,black,very thick] (e3) -- ($(e3)!.85!(14,6)$); % 1 cm before end terminal
\draw[->,black,very thick] (e3) -- ($(e3)!.85!(14,0)$); % 1 cm before start terminal
\draw[->,black,very thick] (V1mid2) -- ($(V1mid2)!.85!(V1down)$); % 1 cm before end terminal
\draw[->,black,very thick] (V1mid1) -- ($(V1mid1)!.85!(V1up)$); % 1 cm before start terminal
\end{circuitikz}
\label{fig:q1fig}
\end{document}\documentclass{standalone}
\usepackage[american]{circuitikz}
\usepackage{graphicx}
\usepackage{mathrsfs}
\usepackage{latexsym,amssymb,amsmath}
\newcommand{\equal}{=}
\begin{document}
\begin{circuitikz}
\draw (0,3) to [V,l_=$\mathscr{F}\equal NI$] (0,0) % "Voltage source for magentic circuit"
(0,3) to [R,l^=$\mathscr{R}_{1,thick}$, v_>=$\mathscr{F}_1$, color=red] (0,6) %Reluctance thick side
(0,6) to [R, l^=$\mathscr{R}_{2,thin}$,v_>=$\mathscr{F}_2$, color=blue] (3,6) %Reluctance thin side
(3,6) -- (3,3) % Connection R2, R3
(3,3) to [R, l^=$\mathscr{R}_{3,thick}$,v_>=$\mathscr{F}_3$, color=red] (3,0) %Reluctance thick side
(3,0) to [R, l^= $\mathscr{R}_{4,thin}$,v_>=$\mathscr{F}_4$, color=blue] (0,0); %Reluctance thin side
\draw[thin, <-, >=triangle 45] (1.5,3) node[scale=2]{$\phi$} ++(-90:1) arc (-90:100:1);
\end{circuitikz}
\label{fig:q1fig}
\end{document}\documentclass{standalone}
\usepackage[american]{circuitikz}
\usepackage{graphicx}
\usepackage{mathrsfs}
\usepackage{latexsym,amssymb,amsmath}
\usetikzlibrary{bending}
\newcommand{\equal}{=}
\begin{document}
\begin{circuitikz}
\draw (0,3) to [V,l_=$\mathscr{F}\equal NI$] (0,0)
(0,3) -- (3,3)
(3,0) -- (0,0)
(3,3) to [R, l^= $\mathscr{R}_{eq}$,v_>=$\mathscr{F}$, color=blue] (3,0);
% \draw[thin, <-, >=triangle 45] (1.5,1.5) node[scale=2]{$\phi$} ++(-90:0.5) arc (-90:100:0.5);
\node (phi) at (1.5,0.5) {$\phi$};
\draw[-stealth] (1.5,2.5) to [bend left=90] (phi);
\end{circuitikz}
\label{fig:q1fig}
\end{document}\documentclass{standalone}
\usepackage[american]{circuitikz}
\usepackage{graphicx}
\usepackage{mathrsfs}
\usepackage{latexsym,amssymb,amsmath}
\newcommand{\equal}{=}
\begin{document}
\begin{circuitikz}
\draw (3,4) to [V,l_=$\mathscr{F}\equal NI$] (3,2)
(3,2) to [R,l^=$\mathscr{R}_{g1}$, v_>=$\mathscr{F}_1$, color=green] (3,0)
(3,2) -- (3,0)
(3,0) -- (0,0)
(0,4) to [R,l^=$\mathscr{R}_{g2}$, v_>=$\mathscr{F}_2$, color=red] (0,0)
(6,4) to [R, l^=$\mathscr{R}_{g3}$,v_>=$\mathscr{F}_3$, color=blue] (6,0)
(6,0) -- (3,0)
(0,4) -- (6,4);
% \draw[thin, <-, >=triangle 45] (1.5,1.5) node[scale=2]{$\phi$} ++(-90:0.5) arc (-90:100:0.5);
\node (phi) at (1.25,0.5) {$\phi_1$};
\draw[-stealth] (1.25,2.5) to [bend left=90] (phi);
\node (phi) at (4.25,0.5) {$\phi_2$};
\draw[-stealth] (4.25,2.5) to [bend left=90] (phi);
\end{circuitikz}
% \begin{circuitikz}
% \draw (0,3) to [V,l_=$\mathscr{F}\equal NI$] (0,0)
% (0,3) to [R,l^=$\mathscr{R}_{1,thick}$, v_>=$\mathscr{F}_1$, color=red] (0,6)
% (0,6) to [R, l^=$\mathscr{R}_{2,thin}$,v_>=$\mathscr{F}_2$, color=blue] (3,6)
% (3,6) -- (3,3)
% (3,3) to [R, l^=$\mathscr{R}_{3,thick}$,v_>=$\mathscr{F}_3$, color=red] (3,0)
% (3,0) to [R, l^= $\mathscr{R}_{4,thin}$,v_>=$\mathscr{F}_4$, color=blue] (0,0)
%
% (1.5,3) node[scale=4]{${\circlearrowright}$}
% (1.5,3) node[scale=2]{${\mathbf{\phi}}$};
% ;\end{circuitikz}
% \label{fig:q1fig}
\end{document}%corresponds to question 4, ELEC 370 assignment 1.
\documentclass{standalone}
\usepackage[american]{circuitikz}
\usepackage{graphicx}
\usepackage{mathrsfs}
\usepackage{latexsym,amssymb,amsmath}
\newcommand{\equal}{=}
\begin{document}
\begin{circuitikz}
\draw (0,2) to [V,l_=$\mathscr{F}\equal NI$] (1.5,2)
(0,0) --(0,4)
(0,0) -- (4,0)
(0,4) -- (4,4)
(4,0) to [R,l^=$\mathscr{R}_{s}$, v_>=$\mathscr{F}_1$, color=green] (4,2)
(4,4) to [R,l_=$\mathscr{R}_{s}$, v^>=$\mathscr{F}_2$, color=blue] (4,2)
(1.5,2) to [R,l_=$\mathscr{R}_{g}$, v^<=$\mathscr{F}_2$,i_<=$\phi$, color=red] (4,2);
\node (phi) at (2.5,3) {$\phi_1$};
\draw[-stealth] (1,2.5) to [bend left=90] (phi);
\node (phi) at (2.5,0.5) {$\phi_2$};
\draw[-stealth] (1,0.25) to [bend left=90] (phi);
\end{circuitikz}
\end{document}\documentclass{standalone}
\usepackage[american]{circuitikz}
\usepackage{graphicx}
\usepackage{mathrsfs}
\usepackage{latexsym,amssymb,amsmath}
\newcommand{\equal}{=}
\begin{document}
\begin{circuitikz}
\draw (0,2) to [V,l_=$\mathscr{F}\equal NI$] (0,0)
(0,0) to [R,l^=$\mathscr{R}_{g}$, v_<=$\mathscr{F}_1$, color=green] (4,0)
(0,2) to [R,l_=$0.5\mathscr{R}_{s}$, v^>=$\mathscr{F}_2$, color=blue] (4,2)
(4,2) -- (4,0);
\node (phi) at (3.0,0.25) {$\phi$};
\draw[-stealth] (3.25,1.75) to [bend left=90] (phi);
\end{circuitikz}
\end{document}\documentclass{standalone}
\usepackage[american]{circuitikz}
\usepackage{graphicx}
\usepackage{mathrsfs}
\usepackage{latexsym,amssymb,amsmath}
\newcommand{\equal}{=}
\begin{document}
\begin{circuitikz}
\draw (4,0) to [V,l_=$\mathscr{F}\equal NI$, -*] (6,0)
(2,0) -- (2,2)
(2,2) to [R,l^=$\mathscr{R}_{l}$,i^>=$\phi_l$, v_>=$\mathscr{F}_1$, color=purple] (6,2)
(6,2) -- (6,0)
(2,0) to [R,l^=$\mathscr{R}_{l2}$,i^<=$\phi_t$, v_<=$\mathscr{F}_{l2}$, *-, color=blue] (4,0)
(2,0) -- (0,0)
(0,0) to [R,l^=$\mathscr{R}_{l1}$, v_>=$\mathscr{F}_{l1}$, color=red] (0,4)
(6,0) -- (8,0)
(8,4) to [R,l^=$\mathscr{R}_{l1}$, v_>=$\mathscr{F}_{l1}$, color=red] (8,0)
(0,4) -- (3,4)
(3,4) to [R,l^=$\mathscr{R}_{g}$,i^>=$\phi_g$, v_>=$\mathscr{F}_{g}$, color=green] (5,4)
(5,4) -- (8,4);
% (0,0) to [R,l^=$\mathscr{R}_{g}$, v_<=$\mathscr{F}_1$, color=green] (4,0)
% (0,2) to [R,l_=$0.5\mathscr{R}_{s}$, v^>=$\mathscr{F}_2$, color=blue] (4,2)
% (4,2) -- (4,0)
\node (phi) at (7.0,1.25) {$\phi_{Meme}$};
\draw[-stealth] (1,1.25) to [bend left=90] (phi);
\end{circuitikz}
\end{document}\documentclass{standalone}
\usepackage[american]{circuitikz}
\usepackage{graphicx}
\usepackage{mathrsfs}
\usepackage{latexsym,amssymb,amsmath}
\newcommand{\equal}{=}
\begin{document}
\begin{circuitikz}
\draw (0,3) to [V,l_=$\mathscr{F}\equal NI$] (0,0)
(0,3) to [R, l^= $\mathscr{R}_{i}$,v_>=$\mathscr{F}_i$, color=purple] (3,3)
(3,0) -- (0,0)
(3,3) to [R, l^= $\mathscr{R}_{a}$,v_>=$\mathscr{F}_a$, color=blue] (3,0);
\draw[thin, <-, >=triangle 45] (1.5,1.5) node[scale=2]{$\phi$} ++(-90:0.5) arc (-90:100:0.5);
\end{circuitikz}
\label{fig:q1fig}
\end{document}\documentclass{standalone}
\usepackage[american]{circuitikz}
\usepackage{graphicx}
\usepackage{mathrsfs}
\usepackage{latexsym,amssymb,amsmath}
\newcommand{\equal}{=}
\begin{document}
\begin{circuitikz}
\draw (0,4) to [V,l_=$\mathscr{F}\equal NI$] (0,0)
(0,4) to [R,i>=$\phi_1$, l^= $\mathscr{R}_{1}$,v_>=$\mathscr{F}_1$, color=purple] (4,4)
(4,0) -- (0,0)
(4,4) to [R,i^>=$\phi_2$, l^= $\mathscr{R}_{2}$,v_>=$\mathscr{F}_2$, color=blue] (4,0)
(4,4) to [R,l^= $\mathscr{R}_{3}$,v_>=$\mathscr{F}_3$, color=red] (8,4)
(8,4) to [R,i^>=$\phi_3$, l^= $\mathscr{R}_{g}$,v_>=$\mathscr{F}_g$, color=cyan] (8,0)
(8,0) to [R, l^= $\mathscr{R}_{4}$,v_>=$\mathscr{F}_4$, color=green] (4,0);
\draw[thin, <-, >=triangle 45] (6,2) node{$\phi_3$} ++(-90:1) arc (-90:100:1);
\draw[thin, <-, >=triangle 45] (2,2) node{$\phi_2$} ++(-90:1) arc (-90:100:1);
% \node (phi) at (4.25,0.5) {$\phi_2$};
% \draw[-stealth] (4.25,2.5) to [bend left=90] (phi);
\end{circuitikz}
\label{fig:q1fig}
\end{document}\documentclass{standalone}
\usepackage[american]{circuitikz}
\usepackage{graphicx}
\usepackage{mathrsfs}
\usepackage{latexsym,amssymb,amsmath}
\newcommand{\equal}{=}
\begin{document}
\begin{circuitikz}
\draw (0,6) to [R,i^>=$\phi_2$, l^= $\mathscr{R}_{g1}$,v_>=$\mathscr{F}_{g1}$, color=blue] (0,0)
(0,6) to [R,i>=$\phi_1$, l^= $\mathscr{R}_{ab}$,v_>=$\mathscr{F}_1$, color=purple] (4,6)
(0,0) to [R,i^>=$\phi_2$, l^= $\mathscr{R}_{cd}$,v_>=$\mathscr{F}_{cd}$, color=gray] (4,0)
(4,2) to [I,l_=$N_1i$] (4,4)
(4,2) to [I,l_=$N_2i$] (4,0)
(4,4) to [R,i>=$\phi_1$, l^= $\mathscr{R}_{ad}$,v_>=$\mathscr{F}_{ad}$, color=orange] (4,6)
(4,6) to [R,l^= $\mathscr{R}_{3}$,v_>=$\mathscr{F}_3$, color=red] (8,6)
(8,6) to [R,i^>=$\phi_3$, l^= $\mathscr{R}_{g2}$,v_>=$\mathscr{F}_{g2}$, color=cyan] (8,0)
(8,0) to [R, l^= $\mathscr{R}_{dc}$,v_>=$\mathscr{F}_{dc}$, color=green] (4,0);
\end{circuitikz}
\label{fig:q1fig}
\end{document}\documentclass{standalone}
\usepackage[american]{circuitikz}
\usepackage{graphicx}
\usepackage{mathrsfs}
\usepackage{latexsym,amssymb,amsmath}
\newcommand{\equal}{=}
\begin{document}
\begin{circuitikz}
\draw (0,0) to [R,i^<=$\phi_1$, l^= $\mathscr{R}_{g1}$,v_<=$\mathscr{F}_{g1}$, color=blue] (0,6)
(0,6) -- (4,6)
(0,0) -- (4,0)
(4,0) to [I,i=$\phi$,l_=$(N_1-N_2)i$] (4,4)
(4,4) -- (4,6)
(8,0) -- (4,0)
(4,6) to [R,l^= $\mathscr{R}_{3}$,v_>=$\mathscr{F}_3$, color=red] (8,6)
(8,0) to [R,i^<=$\phi_2$, l^= $\mathscr{R}_{g2}$,v_<=$\mathscr{F}_{g2}$, color=cyan] (8,6)
;\end{circuitikz}
\label{fig:q1fig}
\end{document}\documentclass{standalone}
\usepackage[american]{circuitikz}
\usepackage{graphicx}
\usepackage{mathrsfs}
\usepackage{latexsym,amssymb,amsmath}
\newcommand{\equal}{=}
\begin{document}
\begin{circuitikz}
\draw (6,0) to [V,i^>=$\phi_T$, l^= $\mathscr{F}$,v_>=$NI$, color=blue] (0,0)
(0,0) -- (0,4)
(0,4) -- (1,4)
(1,4) -- (1,2)
(1,4) -- (1,6)
(1,6) to [R,i>=$\phi_1$, l^= $\mathscr{R}_{2}$,v_>=$\mathscr{F}_2$, color=purple] (3,6)
(3,6) to [R, l^= $\mathscr{R}_{3}$,v_>=$\mathscr{F}_3$, color=purple] (5,6)
(5,6) -- (5,4)
(1,2) to [R,i>=$\phi_1$, l^= $\mathscr{R}_{1}$,v_>=$\mathscr{F}_1$, color=red] (4,2)
(4,2) -- (5,2)
(5,2) -- (5,4)
(5,4) -- (6,4)
(6,4) -- (6,0)
;\end{circuitikz}
\label{fig:q1fig}
\end{document}\documentclass[preview]{standalone}
\usepackage{tikz}
\usepackage{pgfplots}
\usepgfplotslibrary{smithchart}
\pgfplotsset{compat=1.11}
\begin{document}
\begin{tikzpicture}
\begin{smithchart}
\path[draw=red] (0pt,0pt) circle (1.5cm);
\path[draw=blue] (0.2,0.5) circle (0.75cm);
\path[draw=blue,fill=blue] (0.2,0.5) circle (0.05cm);
\end{smithchart}
\end{tikzpicture}
\end{document}\documentclass{standalone}
\usepackage{tikz,bm}
\usepackage[raggedrightboxes]{ragged2e}
\begin{document}
\begin{tikzpicture}[x={(-10:1cm)},y={(90:1cm)},z={(210:1cm)}]
% Axes
\draw (-1,0,0) node[above] {$x$} -- (5,0,0);
\draw (0,0,0) -- (0,2,0) node[above] {$y$};
\draw (0,0,0) -- (0,0,2) node[left] {$z$};
% Propagation
\draw[->,ultra thick] (5,0,0) -- node[above] {$c$} (6,0,0);
% Waves
\draw[thick] plot[domain=0:4.5,samples=200] (\x,{cos(deg(pi*\x))},0);
\draw[gray,thick] plot[domain=0:4.5,samples=200] (\x,0,{cos(deg(pi*\x))});
% Arrows
\foreach \x in {0.1,0.3,...,4.4} {
\draw[->,help lines] (\x,0,0) -- (\x,{cos(deg(pi*\x))},0);
\draw[->,help lines] (\x,0,0) -- (\x,0,{cos(deg(pi*\x))});
}
% Labels
\node[above right] at (0,1,0) {$\bm{E}$};
\node[below] at (0,0,1) {$\bm{B}$};
\end{tikzpicture}
\begin{minipage}{.5\linewidth}
\[
c = \frac{E}{B}
\]
\begin{tabular}{r@{${}={}$}p{.8\linewidth}}
$E$ & electric field amplitude \\
$B$ & magnetic field amplitude (instantaneous values) \\
$c$ & speed of light ($3\times10^8\mathrm{m/s}$) \\
\end{tabular}
\end{minipage}%
\begin{minipage}{.5\linewidth}
\[
c = \frac{1}{\sqrt{\mu_0 \varepsilon_0}}
\]
\begin{tabular}{r@{${}={}$}p{.8\linewidth}}
$\mu_0$ & magnetic permeability in a vacuum, $\mu_0 = 1.3\times10^{-6}\,\mathrm{N/A^2}$ \\
$\varepsilon_0$ & electric permeability in a vacuum, $\varepsilon_0 = 8.9\times10^{-12}\,\mathrm{C^2/N m^2}$ \\
\end{tabular}
\end{minipage}
\end{document}\documentclass{standalone}
\usepackage{tikz}
\usepackage{circuitikz}
\begin{document}
\tikzstyle{block} = [draw, fill=white, rectangle,
minimum height=3em, minimum width=3em]
\begin{circuitikz}
\draw (0,4) to [twoport,t=$Z_g$](4,4);
\draw (4,0) to[TL] (10,0);
\draw (4,4) to[TL] (10,4);
\draw (10,4) to [twoport,t=$Z_L$](10,0);
\draw (0,0) to [sI] (0,4);
\draw (4,0) to (0,0);
\end{circuitikz}
\end{document}\documentclass[tikz,border=3mm]{standalone}
\usetikzlibrary{quotes,arrows.meta}
\begin{document}
\tikzset{
terminal_a/.pic = {%
\coordinate (-in) at (-3mm,0);
\coordinate (-out) at (-3mm,-4.5mm);
\path[fill] (-in) circle (2pt);
\draw[thick] (-in)--(0,0)--++(0:1cm) arc[start angle=90, delta angle=-180, radius=.75mm];
\draw[thick] (0,-1.5mm) arc[start angle=90, delta angle=180, radius=.75mm]--++(0:1cm) arc[start angle=90, delta angle=-180, radius=.75mm];
\fill (-out) circle (2pt);
\draw[thick] (-out) -- ++(0:3mm);
},
terminal_b/.pic = {%
\coordinate (-in) at (-3mm,0);
\coordinate (-out) at (-3mm,-7.5mm);
\path[fill] (-in) circle (2pt);
\draw[thick] (-in)--(0,0)--++(0:1cm) arc[start angle=90, delta angle=-180, radius=.75mm];
\draw[thick] (0,-1.5mm) arc[start angle=90, delta angle=180, radius=.75mm]--++(0:1cm) arc[start angle=90, delta angle=-180, radius=.75mm];
\draw[thick] (0,-4.5mm) arc[start angle=90, delta angle=180, radius=.75mm]--++(0:1cm) arc[start angle=90, delta angle=-180, radius=.75mm];
\fill (-out) circle (2pt);
\draw[thick] (-out) -- ++(0:3mm);
},
field/.pic = {
\draw[thick,-Stealth] (0,0) -- (90:7mm) node[above] {\tikzpictext};
}
}
\begin{tikzpicture}
\draw (0,0) rectangle (7,5);
\draw (1,1) rectangle (3,4);
\draw (4,1) rectangle (6,4);
\foreach \i/\j in {0/A,3/B,6/C}{
\pic (upper-\j) at (\i,3.8) {terminal_a};
\pic (lower-\j) at (\i,2) {terminal_b};
\pic["$\Psi_\j$"] at ([xshift=5mm]\i,2.2) {field};
}
\node[left] at (upper-A-in) {A};
\draw[red] (upper-A-out) to [bend right] (lower-A-in);
\end{tikzpicture}
\end{document}\documentclass{standalone}
\usepackage{blox}
\usepackage{tikz}
\usepackage{steinmetz}
\usetikzlibrary{positioning}
\usetikzlibrary{circuits}
\begin{document}
\begin{tikzpicture}
\bXInput{E}
\bXChain[2]{E}%
{Md/IF,fred/$ID\phase{RR}$,head/EXE,Fun/Mem, Games/WB}
\end{tikzpicture}
\end{document}\documentclass[border=3mm]{standalone}
\usepackage{tikz}
\usetikzlibrary{positioning,matrix,shapes.arrows}
\tikzset{
modulematrix/.style={draw=blue!50!red,rounded corners,matrix of nodes,row sep=1cm,column sep=1cm,nodes={draw=green!70,align=center,font=\sffamily},inner ysep=0.5cm},
module/.style={rounded corners, align=center, font=\sffamily, thick},
simple module/.style={module, top color=blue!10, bottom color=blue!35, draw=blue!75, text width=40mm, minimum height=15mm},
module down arrow/.style={module arrow, shape border rotate=-90},
module right arrow/.style={module arrow},
module arrow/.style={single arrow, single arrow head extend=2.5mm, draw=gray!75, inner color=gray!20, outer color=gray!35, thick, shape border uses incircle, anchor=tail,minimum height=0.7cm},
}
\begin{document}
\begin{tikzpicture}
\node [simple module] (mA) {Module A};
\matrix[modulematrix,below=of mA,label={[anchor=south]below:Module B}] (mB) {Description 1 & Description 2 \\};
\matrix[modulematrix,right=of mB,nodes={text width=5cm,align=center},label={[anchor=north]above:Module C}] (mC) {Description 3 \\ Description 4 \\};
\matrix[modulematrix,below=of mC,label={[anchor=south]below:Module D}] (mD) {Description 5 & Description 6 \\};
\node [simple module,below=of mD] (mE) {Module E};
\foreach \n in {mA,mC-1-1,mC,mD}
\node[module down arrow,below=1mm of \n] {};
\foreach \n in {mB-1-1,mB,mD-1-1}
\node[module right arrow,right=1mm of \n] {};
\end{tikzpicture}
\end{document}
\documentclass[border=5pt]{standalone}
\usepackage{bytefield}
\usepackage{graphicx}
\usepackage{graphics}
\usepackage{xcolor}
\usepackage{subcaption}
\begin{document}
\definecolor{lightcyan}{rgb}{0.84,1,1}
\definecolor{lightgreen}{rgb}{0.64,1,0.71}
\newcommand{\colorbitbox}[3]{%
	\rlap{\bitbox{#2}{\color{#1}\rule{\width}{\height}}}%
	\bitbox{#2}{#3}}
	\begin{bytefield}[bitwidth=2pt,bitheight=\widthof{~Sign~},
		boxformatting={\centering\small}]{64}
		\bitheader[endianness=big]{63,13,0} \\
		\colorbitbox{lightcyan}{50}{VPN} &
		\colorbitbox{lightgreen}{14}{Page Offset}
	\end{bytefield} \hfill \break \newline

\definecolor{lightsomething}{rgb}{0.84,0.7,0.7}
\definecolor{lightsomething2}{rgb}{0.64,0.5,0.71}
	\begin{bytefield}[bitwidth=2pt,bitheight=\widthof{~Sign~},
	boxformatting={\centering\small}]{40}
	\bitheader[endianness=big]{39,13,0} \\
	\colorbitbox{lightsomething}{26}{FPN} &
	\colorbitbox{lightsomething2}{14}{Frame Offset}
\end{bytefield}

\end{document}\documentclass{article}
\usepackage{bytefield}
\usepackage{xcolor}
\usepackage{graphicx}
\begin{document}
\begin{bytefield}{16}
\bitboxes*{1}{01000010} & \bitbox{4}{src\strut} &
\bitbox{4}{dest\strut} & \bitbox{4}{const\strut}
\end{bytefield}
\section{More testing}
\begin{bytefield}{16}
\bitheader{0,7,8,15} \\
\begin{rightwordgroup}{Header}
\bitbox{4}{Tag} & \bitbox{12}{Mask} \\
\bitbox{8}{Source} & \bitbox{8}{Destination}
\end{rightwordgroup} \\
\wordbox{3}{Data}
\end{bytefield}
\section{Games}
\medskip
\newcommand{\colorbitbox}[3]{%
\rlap{\bitbox{#2}{\color{#1}\rule{\width}{\height}}}%
\bitbox{#2}{#3}}
\definecolor{lightcyan}{rgb}{0.84,1,1}
\definecolor{lightgreen}{rgb}{0.64,1,0.71}
\definecolor{lightred}{rgb}{1,0.7,0.71}
\begin{bytefield}[bitheight=\widthof{~Sign~},
boxformatting={\centering\small}]{32}
\bitheader[endianness=big]{31,23,0} \\
\colorbitbox{lightcyan}{1}{\rotatebox{90}{Sign}} &
\colorbitbox{lightgreen}{8}{Exponent} &
\colorbitbox{lightred}{23}{Mantissa}
\end{bytefield}
\section{Games}
\medskip
\begin{bytefield}[bitheight=2.5\baselineskip]{32}
\bitheader{0,7,8,15,16,23,24,31} \\
\begin{rightwordgroup}{\parbox{6em}{\raggedright These words were taken
verbatim from the TCP header definition (RFC~793).}}
\bitbox{4}{Data offset} & \bitbox{6}{Reserved} &
\bitbox{1}{\tiny U\\R\\G} & \bitbox{1}{\tiny A\\C\\K} &
\bitbox{1}{\tiny P\\S\\H} & \bitbox{1}{\tiny R\\S\\T} &
\bitbox{1}{\tiny S\\Y\\N} & \bitbox{1}{\tiny F\\I\\N} &
\bitbox{16}{Window} \\
\bitbox{16}{Checksum} & \bitbox{16}{Urgent pointer}
\end{rightwordgroup} \\
\wordbox[lrt]{1}{Data octets} \\
\skippedwords \\
\wordbox[lrb]{1}{} \\
\begin{leftwordgroup}{\parbox{6em}{\raggedright Note that we can display,
for example, a misaligned 64-bit value with clever use of the
optional argument to \texttt{\string\wordbox} and
\texttt{\string\bitbox}.}}
\bitbox{8}{Source} & \bitbox{8}{Destination} &
\bitbox[lrt]{16}{} \\
\wordbox[lr]{1}{Timestamp} \\
\begin{rightwordgroup}{\parbox{6em}{\raggedright Why two Length fields?
No particular reason.}}
\bitbox[lrb]{16}{} & \bitbox{16}{Length}
\end{leftwordgroup} \\
\bitbox{6}{Key} & \bitbox{6}{Value} & \bitbox{4}{Unused} &
\bitbox{16}{Length}
\end{rightwordgroup} \\
\wordbox{1}{Total number of 16-bit data words that follow this
header word, excluding the subsequent checksum-type value} \\
\bitbox{16}{Data~1} & \bitbox{16}{Data~2} \\
\bitbox{16}{Data~3} & \bitbox{16}{Data~4} \\
\bitbox[]{16}{$\vdots$ \\[1ex]} &
\bitbox[]{16}{$\vdots$ \\[1ex]} \\
\bitbox{16}{Data~$N-1$} & \bitbox{16}{Data~$N$} \\
\bitbox{20}{\[ \mbox{A5A5}_{\mbox{\scriptsize H}} \oplus
\left(\sum_{i=1}^N \mbox{Data}_i \right) \bmod 2^{20} \]} &
\bitboxes*{1}{000010 000110} \\
\wordbox{2}{64-bit random number}
\end{bytefield}
\end{document}\documentclass{article}
\usepackage{enumitem}
\usepackage[most]{tcolorbox}
\usetikzlibrary{arrows}
\usetikzlibrary{shapes}
\newcommand{\mymk}[1]{%
\tikz[baseline=(char.base)]\node[anchor=south west, draw,rectangle, rounded corners, inner sep=2pt, minimum size=7mm,
text height=2mm](char){\ensuremath{#1}} ;}
\newcommand*\circled[1]{\tikz[baseline=(char.base)]{
\node[shape=circle,draw,inner sep=2pt] (char) {#1};}}
\begin{document}
\begin{enumerate}
\def\labelenumi{(\alph{enumi})}
\item \tcbox[enhanced,drop shadow,colback=white]{Multiple users will be able to log on.}
\item \tcbox[enhanced,drop shadow,colback=white]{The program will not have any delays.}
\item If the system detects a major issue, it will save state and restart.
\item \tcbox[enhanced,drop shadow,colback=white]{The user will be able to modify the location of the program’s save location on their machine.}
\item The program will show an error message to the user if they enter an invalid value in any section.
\end{enumerate}
\end{document}
\documentclass[border=3mm]{standalone}
\usepackage[english]{babel}
\usepackage{tikz-uml}
\newcommand\blank[1]{\rule[-.2ex]{#1}{.4pt}}

\begin{document}
  \begin{tikzpicture}
%\umlclass[type=interface]{InterfaceA}{}{}
%\umlclass[y=-4]{ClassA}{}{}
%\umlimpl[stereo=realizes, pos stereo=0.5]{ClassA}{InterfaceA}
%
%\umlclass[x=4, type=interface]{InterfaceB}{}{}
%\umlclass[x=4, y=-4]{ClassB}{}{}
%\umlimpl[]{ClassB}{InterfaceB}
%\node[] at (3,-2) {<<realizes>>};
\umlclass[]{Pirates Game}
	{
		WORLD\blank{0.2cm}SIZE : constant\blank{0.2cm}type = {w:1500,h:1000}  \\
		WINDOW\blank{0.2cm}WIDTH  : constant\blank{0.2cm}type = 750	\\
		WINDOW\blank{0.2cm}HEIGHT : constant\blank{0.2cm}type = 500
	}
	{
		preload() : void \\
		create() : void \\
		GameLoop() : void \\
		CreateShip(string,Number,Number,Number) : Sprite \\
	}

\umlclass[x=-2,y=-8]{Player}
	{
		+ x : Number \\
		+ y : Number \\
		+ rotation : Number \\
		+ health : Number \\
		+ alive : Boolean \\
		+ shot  : Boolean \\
		+ bullets : Number \\
		+ speed\blank{0.2cm}x : Number \\
		+ speed\blank{0.2cm}y : Number \\
	}
	{
		update () : void \\
	}

\umlclass[x=4,y=-6]{Bullet}
{
	+ x : Number \\
	+ y : Number \\
	+ speed\blank{0.2cm}x : Number \\
	+ speed\blank{0.2cm}y : Number \\
}
{
}

\umlclass[x=12,y=-5]{Hearts}
{
	+ x : Number \\
	+ y : Number \\
	+ speed\blank{0.2cm}x : Number \\
	+ speed\blank{0.2cm}y : Number \\
}
{}

\umlclass[x=12,y=0]{Mini-ships}
{
	+ x : Number \\
	+ y : Number \\
	+ speed\blank{0.2cm}x : Number \\
	+ speed\blank{0.2cm}y : Number \\
	+ rotationDirection : Number \\
	+ rotation : Number
}
{
}
\umlnote[x=7,y=-10,width=7.5cm]{Player}{Interactions between players and  game objects is controlled by the server and client. Each player \\ updates their own position.}
\umlunicompo[mult1=spawns,arg1=server,mult2=bullets,pos1=0.35,pos2=0.65]{Pirates Game}{Bullet}
\umlunicompo[mult1=spawns,arg1=server,mult2=Hearts,pos1=0.15,pos2=0.85]{Pirates Game}{Hearts}
\umlunicompo[geometry=|-|,arg1=creates, mult1=server,arg2=player,mult2=client,pos1=1.5,pos2=2.6]{Pirates Game}{Player}
\umlassoc[geometry=-|,arg1=player,mult1=shoots,mult2=bullets]{Player}{Bullet}
\umlunicompo[mult1=spawns,arg1=server,mult2=Mini-ships]{Pirates Game}{Mini-ships}
\umlassoc[geometry=|-|,arg1=destroys,pos1=1.75]{Bullet}{Mini-ships}
\umlassoc[geometry=-|,arg1=destroys,pos1=0.35]{Bullet}{Hearts}
\end{tikzpicture}
\end{document}\documentclass[tikz,border=10pt]{standalone}
\usetikzlibrary{positioning,fit,shapes.arrows,shadows}
\newcounter{module}
\setcounter{module}{0}
\renewcommand*\themodule{\Alph{module}}
\tikzset{%
module/.style={rounded corners, align=center, font=\sffamily, thick},
simple module/.style={module, top color=blue!10, bottom color=blue!35, draw=blue!75, text width=40mm, minimum height=15mm, drop shadow},
square module/.style={module, draw=orange!75!black, minimum height=20mm, text width=20mm},
long module/.style={module, draw=orange!75!black, minimum height=20mm, text width=50mm},
combo module/.style={module, draw=blue!75!black},
simple module/.pic={
\stepcounter{module}
\node (module \themodule) [simple module] {};
},
module down arrow/.style={module arrow, shape border rotate=-90, yshift=1.25mm},
module up arrow/.style={module arrow, shape border rotate=90, yshift=-1.25mm},
module right arrow/.style={module arrow, xshift=-1.25mm},
module left arrow/.style={module arrow, rotate = -180, xshift=1.25mm},
module rightup arrow/.style={module arrow,rotate =45, yshift=1.25mm,xshift=1.25mm},
module rightdown arrow/.style={module arrow,rotate =-45, yshift=-1.25mm,xshift=1.25mm},
module leftup arrow/.style={module arrow,rotate =135, yshift=1.25mm,xshift=-1.25mm},
module leftdown arrow/.style={module arrow,rotate =215, yshift=-1.25mm,xshift=-1.25mm},
pics/horizontal module/.style n args=3{
code={
\stepcounter{module}
\coordinate (c) at (0,0);
\node [module right arrow] at (c) {};
\node (module \themodule-1) [square module, left=7.5mm of c] {#1};
\node (module \themodule-2) [square module, right=7.5mm of c] {#2};
\node (module \themodule-3) [below=1.5mm of c |- module \themodule-2.south, module] {#3};
\node (module \themodule) [fit=(module \themodule-1) (module \themodule-2) (module \themodule-3), combo module] {};
}
},
pics/vertical module/.style n args=3{
code={
\stepcounter{module}
\coordinate (c) at (0,0);
\node [module down arrow] at (c) {};
\node (module \themodule-1) [long module, above=7.5mm of c] {#1};
\node (module \themodule-2) [long module, below=7.5mm of c] {#2};
\node (module \themodule-3) [above=1.5mm of module \themodule-1.north, module] {#3};
\node (module \themodule) [fit=(module \themodule-1) (module \themodule-2) (module \themodule-3), combo module] {};
}
},
module arrow/.style={single arrow, single arrow head extend=2.5mm, drop shadow, draw=gray!75, inner color=gray!20, outer color=gray!35, thick, shape border uses incircle, text height=1.5mm, text width=2.5mm, anchor=center},
module doubleArrow/.style={double arrow, double arrow head extend=2.5mm, drop shadow, draw=gray!75, inner color=gray!20, outer color=gray!35, thick, shape border uses incircle, text height=1mm, text width=5mm, anchor=center},
}
\begin{document}
\begin{tikzpicture}
%% Module A --- client side modules
\pic {simple module};
\node[] (node name) at (module A) {\large {\textbf{Client-Side}}};
\node [module down arrow] at ([yshift=-7.5mm]module A.south) {};
\node [module up arrow] at ([yshift=7.5mm]module A.north) {};
\node [module left arrow] at ([xshift=-7.5mm]module A.west) {};
%% Module b, below module A
\pic [below=27.5mm of module A.south] {horizontal module={Collisions with bullets, hearts and ships.}{Update player health and position}{Physics}};
\node [module rightup arrow] at ([xshift=6.5mm,yshift=20mm]module B.east) {};
%% Module c, above module A
\pic [above=33.5mm of module A.north] {horizontal module={Respond to keyboard and mouse inputs.}{Move player and shoot bullets}{Controls}};
\node [module rightdown arrow] at ([xshift=6.5mm,yshift=-20mm]module C.east) {};
%% Module D, left of module A, removed phaser
\pic [left=45mm of module A.west] {vertical module={Load Sprites, Images and Sound from folder specific in server. Create game enviroment and create player for the client}{Play music, remove destroyed objects from client and render sprites. Update healthbar for player and output messages when player is destroyed.}{Game Engine}};
%% Module E
\pic [right=20mm of module A.east] {simple module};
\node[] (node name) at (module E) {\large {\textbf{Socket-io}}};
\node [module left arrow] at ([xshift=-7.5mm]module E.west) {};
\node [module right arrow] at ([xshift=8.75mm]module E.east) {};
%% Module F --- server side modules
\pic [right=19mm of module E.east] {simple module};
\node[] (node name) at (module F) {\large {\textbf{Server-Side}}};
\node [module right arrow] at ([xshift=7.5mm]module F.east) {};
\node [module up arrow] at ([yshift=7.5mm]module F.north) {};
\node [module down arrow] at ([yshift=-7.5mm]module F.south) {};
%% Module G
\pic [right=45mm of module F.east] {vertical module={Periodically spawn hearts and mini-ships in seperate arrays, generate bullets when user presses shoot button.}{Delete hearts and mini-ships if they go out of bounds or hit by bullet. Delete bullets if out of bounds and output log messages.}{Create Obstacles and bullets}};
%% Module H
\pic [above=33.5mm of module F.north] {horizontal module={Logic for when players connect and disconnect or destroyed.}{Update players location and send updates to client}{Manage Players}};
\node [module leftdown arrow] at ([xshift=-6.5mm,yshift=-22.5mm]module H.west) {};
%% Module I
\pic [below=27.5mm of module F.south] {horizontal module={Load Folders (assets, sound, js files)}{Update location of obstacles at set intervals}{Manage Game Assets and Obstacles}};
\node [module leftup arrow] at ([xshift=-6.5mm,yshift=22.5mm]module I.west) {};
% \pic [right=42.5mm of module B.east] {vertical module={Description 3}{Description 4}};
% \node [module down arrow] at ([yshift=-7.5mm]module C.south) {};
% \pic [below=27.5mm of module C.south] {horizontal module={Description 5}{Description 6}};
% \node [module down arrow] at ([yshift=-7.5mm]module D.south) {};
% \pic [below=17.5mm of module D.south] {simple module};
\end{tikzpicture}
\end{document}\documentclass{standalone}
\usepackage{xcolor}
\usepackage{listings}
\lstdefinestyle{DOS}
{
backgroundcolor=\color{black},
basicstyle=\scriptsize\color{white}\ttfamily
}
\begin{document}
\begin{lstlisting}[style=DOS]
Microsoft Windows [Version 6.1.7601]
Copyright (c) 2009 Microsoft Corporation. All rights reserved.
C:> node server
listening on port 8000
New player joined with state: { x: 889.8103577555021,
y: 752.1248414312639,
angle: 0,
type: '6',
health: 100 }
Spawning DriftWood (316.6456740652798,706.8880647171098)
New player joined with state: { x: 849.9970300626003,
y: 818.0782645328588,
angle: 0,
type: '5',
health: 100 }
Spawning DriftWood (729.4982454697532,698.3670219092813)
Spawning Health Pack (302.4444058918867,648.1832695147405)
Player: [l-CPwPTDumIpyxZJAAAA], hit by bullet
DriftWood number [0] destroyed by bullet [4]
Bullet [0] destroyed because it went offscreen (1057.767911147365,-15.736576261039652)
Spawning DriftWood (677.7964228519133,198.37306259674156)
Spawning Health Pack (696.4702310426835,208.46569810396736)
Spawning DriftWood (651.8236801243313,27.688863345238822)
Bullet [0] destroyed because it went offscreen (-13.088735950588386,764.9687287294422)
Collision between player[00-i166b_J4WWW3tAAAB], healthPack[0]
Player disconnected with state: transport close
Player disconnected with state: transport close
\end{lstlisting}
\end{document}
\documentclass[tikz, border=2mm]{standalone}

\usetikzlibrary{positioning,shapes,arrows,backgrounds,external,fit,calc}
\usepackage[T1]{fontenc}
\usepackage[utf8]{inputenc}
\usepackage{lmodern}

\tikzset{
    BlockCPU/.style={draw,thick, fill=blue!20, rectangle},
    BlockAltre/.style={draw,thick, fill=blue!35, rectangle},
    Periferic/.style={ellipse, draw, fill=blue!15},
    Registre/.style={rectangle, draw, fill=blue!5},
    RegistreBuit/.style={rectangle, draw, fill=blue!30,minimum width=.9cm, minimum height=3mm, inner sep =0pt, outer sep=0.pt, anchor=south east},
    Bus/.style={fill=blue!50},
    Nom/.style={font=\normalsize\sffamily,text centered, minimum size=1cm, text width=1.5cm}
    }

\begin{document}
\begin{tikzpicture}[font={\sffamily\scriptsize}]

\node[Registre, minimum width=3.9cm, minimum height=3.4cm, anchor=south west, label={above:CPU (Processor)}] (CPU) at (0,0) {};
%\node[Nom,above right, align=left] (CPUnom) at (CPU.north west) {CPU};
\node[BlockCPU, minimum width=2cm, anchor=south west] (IB) at (0.3,0.3) {Bus interface};
\node[RegistreBuit] (Reg1) at ($(IB.north east)+(-2mm,5mm)$) {};
\node[RegistreBuit] (Reg2) at (Reg1.north east) {};
\node[RegistreBuit] (Reg3) at (Reg2.north east) {};
\node[RegistreBuit] (Reg4) at (Reg3.north east) {};
\node[RegistreBuit,label={above:Registers}] (Reg5) at (Reg4.north east) {};
\node[BlockCPU, left=3mm of Reg3] (PC) {PC};
\node[BlockCPU, right=5mm of Reg3, minimum width=1cm, minimum height=2cm] (ALU) {ALU};

\draw let \p1=($(Reg1.south) - (Reg1|-IB.north)$), \n1={veclen(\x1,\y1)} in node[double arrow, Bus, shape border rotate=90,anchor=north, minimum height=\n1-\pgflinewidth,minimum width=1mm, double arrow head extend=.5mm]  at ([yshift=.5\pgflinewidth]Reg1.south) {};

\node[single arrow, Bus, anchor=west, minimum width=2mm, single arrow head extend=.5mm, minimum height=5mm-.5\pgflinewidth] at (Reg4.east) {};

\node[single arrow, Bus, anchor=west, minimum width=2mm, single arrow head extend=.75mm, minimum height=5mm-.5\pgflinewidth, shape border rotate=180] at (Reg2.east) {};

\node[double arrow, Bus,, anchor=west, minimum width=1mm, double arrow head extend=.75mm] (BusS) at (IB.east) {System bus};

\node[Registre,minimum width=12mm,minimum height=8mm, anchor=west] (ES) at (BusS.east) {E/S Bridge};

\node[double arrow, Bus,, anchor=west, minimum width=1mm, double arrow head extend=.75mm] (BusM) at (ES.east) {Memory bus};

\node[Registre,minimum width=12mm,minimum height=8mm, text centered,text width=12mm,anchor=west] (Mem) at (BusM.east) {Main memory};

\node[double arrow, Bus,, anchor=north, minimum height=9cm, minimum width=2mm, double arrow head extend=.75mm,anchor=north] (BusES) at ([yshift=-.3cm]ES.south) {Input/Output bus};

\node[single arrow, Bus,, anchor=north, minimum width=2mm, single arrow head extend=.75mm, minimum height=3mm-.5\pgflinewidth, shape border rotate=90] (BusESP) at (ES.south) {};

\node[single arrow, Bus,, anchor=north, minimum width=2mm, single arrow head extend=.75mm, minimum height=5mm-.5\pgflinewidth, shape border rotate=270] (Per1) at ([shift={(-3.5cm,1mm)}]BusES.south) {};

\node[Periferic,anchor=north] (Ratoli) at (Per1.south) {Mouse};

\node[single arrow, Bus, anchor=north, minimum width=2mm, single arrow head extend=.75mm, minimum height=5mm-.5\pgflinewidth, shape border rotate=270] (Per2) at ([shift={(-1.8cm,1mm)}]BusES.south) {};

\node[Periferic,anchor=north] (Teclat) at (Per2.south) {Keyboard};

\node[single arrow, Bus,, anchor=north, minimum width=2mm, single arrow head extend=.75mm, minimum height=5mm, shape border rotate=270] (Per3) at ([shift={(0cm,1mm)}]BusES.south) {};

\node[Periferic,anchor=north] (Pantalla) at (Per3.south) {Display};

\node[single arrow, Bus,, anchor=north, minimum width=2mm, single arrow head extend=.75mm, minimum height=5mm, shape border rotate=270] (Per4) at ([shift={(1.5cm,1mm)}]BusES.south) {};

\node[Periferic,anchor=north] (Disc) at (Per4.south) {Disc};

\node[single arrow, Bus,, anchor=north, minimum width=2mm, single arrow head extend=.75mm, minimum height=5mm, shape border rotate=270] (Per5) at ([shift={(3.5cm,1mm)}]BusES.south) {};

\node[Periferic,anchor=north] (Xarxa) at (Per5.south) {Network};

\path (Disc) -- node {\dots} (Xarxa);

\end{tikzpicture}
\end{document}\documentclass{standalone}
\usepackage{tikz}
\usepackage{tikzscale}
\pgfdeclarelayer{background,foreground}
\pgfsetlayers{background,main,foreground}
\usepackage{tikz-uml}
\usepackage[english]{babel} % load this package so tikz-uml loads, it may be due to my japanesse localle lol.
\begin{document}
\begin{tikzpicture}
\begin{umlseqdiag}
\umlactor{Player A}
%\umlobject{Server}
\umlmulti{Server}
\umlactor{Player B}
% Player spawns, no other player on the map
\begin{umlcall}[op=move-player,return=update-players]{Player A}{Server}
\begin{umlcall}[type=return,op=update-players]{Server}{Player B}
\end{umlcall}
\end{umlcall}
% Player B shoots a bullet
\begin{umlcall}[op=shoot-bullet,return=bullets-update]{Player B}{Server}
\begin{umlcallself}[op=ServerGameLoop]{Server}
\end{umlcallself}
\begin{umlcall}[type=return,op=bullets-update]{Server}{Player A}
\end{umlcall}
\end{umlcall}
\begin{umlcall}[type=return,op=player-hit]{Server}{Player A}
\end{umlcall}
\begin{umlcall}[op=disconnect,type = synchron]{Player A}{Server}
\end{umlcall}
\begin{umlcall}[type=return,op=update-players]{Server}{Player B}
\end{umlcall}
% Player A Moves
% \begin{umlcall}[op=move-player,return=update-players]{Player B}{Server}
% \begin{umlcall}[type=return,op=update-players]{Server}{Player A}
% \end{umlcall}
% \end{umlcall}
%% Game Loop
% \begin{umlfragment}[type=loop]
% \begin{umlcallself}[dt=5,op=ServerGameLoop]{Server}
% \begin{umlcallself}[op=spawnHealthPacks]{Server}
% \end{umlcallself}
% % Update hearts, mini-ships on both sides
% \begin{umlcall}[type=return,op=healthPack-update]{Server}{Player A}
% \end{umlcall}
% \begin{umlcall}[type=return,op=healthPack-update]{Server}{Player B}
% \begin{umlcall}[type=return,op=bullet-update]{Server}{Player A}
% \end{umlcall}
% \begin{umlcall}[type=return,op=bullet-update]{Server}{Player B}
% \end{umlcall}
% \end{umlcall}
% \end{umlcallself}
% \end{umlfragment}
\end{umlseqdiag}
\end{tikzpicture}
\end{document}\documentclass[12pt,a4paper]{standalone}
\usepackage[utf8]{inputenc}
\usepackage[T1]{fontenc}
\usepackage{tikz}
\begin{document}
\begin{tikzpicture}
\draw (0,0) -- (13,0);
\foreach \x in {0,2,4,6,8,12,13}
\draw (\x cm,3pt) -- (\x cm,-3pt);
\draw (0,0) node[below=3pt] (a) {$(i)$} node[above=3pt] {};
\draw (2,0) node[below=3pt] (b) {} node[above=3pt] {$(ii)$};
\draw (4,0) node[below=3pt] {$(iii)$} node[above=3pt] (c) {};
\draw (6,0) node[below=3pt](d) {} node[above=3pt] {$(iv)$};
\draw (8,0) node[below=3pt](e) {$(v)$} node[above=3pt] {};
\draw (12,0) node[above=3pt] (f) {$(vi)$} node[below=3pt] {};
\draw[latex-latex]
(e.north) -- (f.north);
\draw[latex-latex,blue]
(e.north) to[bend left] (f.north);
\draw[latex-latex,red]
(e.north) to[out=60,in=150] (f.north);
\end{tikzpicture}\qquad
% \begin{tikzpicture}
% \draw (0,0) -- (13,0);
% \foreach \x in {0,2,4,6,8,12,13}
% \draw (\x cm,3pt) -- (\x cm,-3pt);
% \draw (0,0) node[below=3pt] (a) {$(i)$} node[above=3pt] {};
% \draw (2,0) node[below=3pt] (b) {} node[above=3pt] {$(ii)$};
% \draw (4,0) node[below=3pt] {$(iii)$} node[above=3pt] (c) {};
% \draw (6,0) node[below=3pt](d) {} node[above=3pt] {$(iv)$};
% \draw (8,0) node[below=3pt](e) {$(v)$} node[above=3pt] {};
% \draw (12,0) node[above=3pt] (f) {$(vi)$} node[below=3pt] {};
% \draw[latex-latex]
% (e.north|-f.north) -- (f.north);
% \draw[latex-latex,blue]
% (e.north|-f.north) to[bend left] (f.north);
% \draw[latex-latex,red]
% (e.north|-f.north) to[out=60,in=120] (f.north);
% \end{tikzpicture}
\end{document}\documentclass[border=10pt,multi,tikz]{standalone}
\usepackage[edges]{forest}
\definecolor{folderbg}{RGB}{124,166,198}
\definecolor{folderbg3}{RGB}{24,206,148}
\definecolor{folderborder}{RGB}{110,144,169}
\def\foldedpaper#1{
\tikz[scale=#1,line width={#1*1pt}]{
\def\a{1.41} % relative height
\def\b{0.2} % relative height/width of corner
\def\c{0.1} % relative margin width (on either side)
\def\d{0.05} % vertical offset of lines
\def\N{6} % number of lines
\draw (0,0)
-- ++(-1,0)
-- ++(0,\a)
-- ++(1-\b,0)
-- ++(\b,-\b)
-- cycle;
\foreach \lnum in {1,...,\N}{
\pgfmathsetmacro\yline{\a-\d-\lnum*\a/(\N+1)}
\draw (-1+\c,\yline) -- (-\c,\yline);
}
\draw[fill=white] (0,\a-\b) -- ++(-\b,0) -- ++ (0,\b);
}
}
\newlength\Size
\setlength\Size{4pt}
\tikzset{%
folder/.pic={%
\filldraw [draw=folderborder, top color=folderbg!50, bottom color=folderbg] (-1.05*\Size,0.2\Size+5pt) rectangle ++(.75*\Size,-0.2\Size-5pt);
\filldraw [draw=folderborder, top color=folderbg!50, bottom color=folderbg] (-1.15*\Size,-\Size) rectangle (1.15*\Size,\Size);
},
file/.pic={%
\filldraw [draw=folderborder, top color=folderbg!5, bottom color=folderbg!10] (-\Size,.4*\Size+5pt) coordinate (a) |- (\Size,-1.2*\Size) coordinate (b) -- ++(0,1.6*\Size) coordinate (c) -- ++(-5pt,5pt) coordinate (d) -- cycle (d) |- (c) ;
},
file2/.pic={%
\filldraw [draw=folderborder, top color=folderbg3!20, bottom color=folderbg3!50] (-\Size,.4*\Size+5pt) coordinate (a) |- (\Size,-1.2*\Size) coordinate (b) -- ++(0,1.6*\Size) coordinate (c) -- ++(-5pt,5pt) coordinate (d) -- cycle (d) |- (c) ;
},
none/.pic={%
},
}
\forestset{%
declare autowrapped toks={pic me}{},
pic dir tree/.style={%
for tree={%
folder,
font=\ttfamily,
grow'=0,
},
before typesetting nodes={%
for tree={%
edge label+/.option={pic me},
},
},
},
pic me set/.code n args=2{%
\forestset{%
#1/.style={%
inner xsep=2\Size,
pic me={pic {#2}},
}
}
},
pic me set={directory}{folder},
pic me set={file}{file},
pic me set={file2}{file2},
pic me set={none}{none},
}
\begin{document}
\begin{forest}
pic dir tree,
where level=0{}{% folder icons by default; override using file for file icons
directory,
},
[system
[assets
[ship.png, file
]
[water.png, file
]
[cannonball.png, file
]
]
[js
[client.js,file2
]
[healthMeter.js, file
]
]
[package.json, file
]
[index.html, file2
]
[server.js, file2
]
]
\end{forest}
\end{document}% Diagram of Android activity life cycle
% Author: Pavel Seda
\documentclass[border=10pt]{standalone}
\usepackage{tikz}
\usetikzlibrary{arrows.meta}
\tikzset{%
>={Latex[width=2mm,length=2mm]},
% Specifications for style of nodes:
base/.style = {rectangle, rounded corners, draw=black,
minimum width=4cm, minimum height=1cm,
text centered, font=\sffamily},
activityStarts/.style = {base, fill=blue!30},
startstop/.style = {base, fill=red!30},
activityRuns/.style = {base, fill=green!30},
process/.style = {base, minimum width=2.5cm, fill=orange!15,
font=\ttfamily},
}
\begin{document}
% Drawing part, node distance is 1.5 cm and every node
% is prefilled with white background
\begin{tikzpicture}[node distance=1.5cm,
every node/.style={fill=white, font=\sffamily}, align=center]
% Specification of nodes (position, etc.)
\node (start) [activityStarts] {Activity starts};
\node (onCreateBlock) [process, below of=start] {onCreate()};
\node (onStartBlock) [process, below of=onCreateBlock] {onStart()};
\node (onResumeBlock) [process, below of=onStartBlock] {onResume()};
\node (activityRuns) [activityRuns, below of=onResumeBlock]
{Activity is running};
\node (onPauseBlock) [process, below of=activityRuns, yshift=-1cm]
{onPause()};
\node (onStopBlock) [process, below of=onPauseBlock, yshift=-1cm]
{onStop()};
\node (onDestroyBlock) [process, below of=onStopBlock, yshift=-1cm]
{onDestroy()};
\node (onRestartBlock) [process, right of=onStartBlock, xshift=4cm]
{onRestart()};
\node (ActivityEnds) [startstop, left of=activityRuns, xshift=-4cm]
{Process is killed};
\node (ActivityDestroyed) [startstop, below of=onDestroyBlock]
{Activity is shut down};
% Specification of lines between nodes specified above
% with aditional nodes for description
\draw[->] (start) -- (onCreateBlock);
\draw[->] (onCreateBlock) -- (onStartBlock);
\draw[->] (onStartBlock) -- (onResumeBlock);
\draw[->] (onResumeBlock) -- (activityRuns);
\draw[->] (activityRuns) -- node[text width=4cm]
{Another activity comes in
front of the activity} (onPauseBlock);
\draw[->] (onPauseBlock) -- node {The activity is no longer visible}
(onStopBlock);
\draw[->] (onStopBlock) -- node {The activity is shut down by
user or system} (onDestroyBlock);
\draw[->] (onRestartBlock) -- (onStartBlock);
\draw[->] (onStopBlock) -| node[yshift=1.25cm, text width=3cm]
{The activity comes to the foreground}
(onRestartBlock);
\draw[->] (onDestroyBlock) -- (ActivityDestroyed);
\draw[->] (onPauseBlock) -| node(priorityXMemory)
{higher priority $\rightarrow$ more memory}
(ActivityEnds);
\draw (onStopBlock) -| (priorityXMemory);
\draw[->] (ActivityEnds) |- node [yshift=-2cm, text width=3.1cm]
{User navigates back to the activity}
(onCreateBlock);
\draw[->] (onPauseBlock.east) -- ++(2.6,0) -- ++(0,2) -- ++(0,2) --
node[xshift=1.2cm,yshift=-1.5cm, text width=2.5cm]
{The activity comes to the foreground}(onResumeBlock.east);
\end{tikzpicture}
\end{document}
\documentclass{standalone}

\usepackage{pgfgantt}
\definecolor{blue}{HTML}{74BBC9}
\definecolor{yellow}{HTML}{F7E967}
\definecolor{green}{HTML}{7CFC00}	% lawn green
\definecolor{red}{HTML}{FF6347}		% tomato
\begin{document}
%\begin{figure}
\begin{ganttchart}[
		x unit=0.35cm,
		y unit chart=1.4cm,
		canvas/.style={draw=none,fill=none}, % remove canvas borders, etc
		vgrid={*1{draw=black!12}},           % vertical gray lines every unit
		inline,                              % draw bars inline
		group/.style={draw=none,fill=none},  % remove group borders, etc
		bar top shift=0.1,                   % give bar 10% padding top/bottom
		bar height=0.8,                      % bar size 80% of vertical space
		y unit title=0.5cm,                  % crop titles a little smaller
		title/.style={draw=none,fill=none},  % remove title borders, etc
		include title in canvas=false,        % no vertical grid in title
		milestone inline label node/.append style={left=5mm}	% see if I can include milestones
	]{-1}{32}

	\gantttitle{0}{3}
	\gantttitle{4}{4}
	\gantttitle{8}{4}
	\gantttitle{12}{4}
	\gantttitle{16}{4}
	\gantttitle{20}{4}
	\gantttitle{24}{4}
	\gantttitle{28}{4}
	\gantttitle{32}{4}\\

	% Note that 2 units = 4 in the diagram
	\ganttgroup[inline=false]{CPU}{0}{1}
	\ganttbar[bar/.style={fill=red}]{$P_1$4}{0}{3}
	\ganttbar[bar/.style={fill=green}]{$P_2\mid$5}{4}{8}
	\ganttbar[bar/.style={fill=red}]{$P_1\mid$4}{9}{12}
 	\ganttbar[bar/.style={fill=green}]{$P_2\mid$5}{13}{17}
 	\ganttbar[bar/.style={fill=red}]{$P_1\mid$4}{18}{21}
 	\ganttbar[bar/.style={fill=blue}]{\tiny{$P_3\mid$2}}{22}{23}
 	\ganttbar[bar/.style={fill=white}]{\tiny {IDLE}}{24}{25}
 	\ganttbar[bar/.style={fill=blue}]{\tiny{$P_3\mid$2}}{26}{27}
  	\ganttbar[bar/.style={fill=white}]{\tiny {IDLE}}{28}{29}
	\ganttbar[bar/.style={fill=blue}]{\tiny{$P_3\mid$2}}{30}{31}
 	\\
%	\ganttmilestone{$T_4-16 =8$}{18}

	\ganttgroup[inline=false]{I/O}{0}{1}
	\ganttbar[bar/.style={fill=red}]{\tiny{$P_1\mid$2}}{4}{5}
	\ganttbar[bar/.style={fill=white}]{\tiny{IDLE}}{6}{8}
	\ganttbar[bar/.style={fill=green}]{\tiny{$P_2\mid$2}}{9}{10}
	\ganttbar[bar/.style={fill=white}]{\tiny{IDLE}}{11}{12}
	\ganttbar[bar/.style={fill=red}]{\tiny{$P_1\mid$2}}{13}{14}
	\ganttbar[bar/.style={fill=white}]{\tiny{IDLE}}{15}{23}
	\ganttbar[bar/.style={fill=blue}]{\tiny{$P_3\mid$2}}{24}{25}
	\ganttbar[bar/.style={fill=white}]{\tiny{IDLE}}{26}{27}
	\ganttbar[bar/.style={fill=blue}]{\tiny{$P_3\mid$2}}{28}{29}
	%\ganttbar[bar/.style={fill=blue}]{2}{2}{5}
	%\ganttbar[bar/.style={fill=yellow}]{6}{6}{8}
	%\ganttbar[bar/.style={fill=white}]{IDLE}{25}{29}
%	\ganttgroup[inline=false]{$T_{2,1}$}{0}{1}
%	\ganttbar[bar/.style={fill=blue}]{1}{0}{1}
%	\ganttbar[bar/.style={fill=yellow}]{7}{9}{11} \\

%	\ganttgroup[inline=false]{$T_{3,1}$}{0}{1}
%	\ganttbar[bar/.style={fill=yellow}]{4}{0}{2}

\node (a) [fill=blue,draw,anchor=south] at (current bounding box.north){$P_3$};
\node (b) [fill=green,draw,anchor=south] at ([xshift=-30pt]a.south west){$P_2$};
\node (c) [fill=red,draw,anchor=south] at ([xshift=-30pt]b.south west){$P_1$};
\node (legend) [fill=white,draw,anchor=south] at ([xshift=-30pt]c.south west){Legend:};
%\node[fill=purple,draw,anchor=west] at ([yshift=-20pt]d.south west){Box North East};
\end{ganttchart}
%\caption{A flexible job shop schedule}
%\label{fig:schedule}
%\end{figure}

\end{document}\documentclass[svgnames]{standalone}
\usepackage{tikz}
\usetikzlibrary{calc,fadings,shapes.arrows,shadows,backgrounds, positioning}
\tikzset{bubble/.style={rectangle, draw=gray,rounded corners,fill=#1,align = flush center,minimum height=1cm,minimum width=1.75cm}}
\tikzfading [name=arrowfading, top color=transparent!0, bottom color=transparent!95]
\tikzset{arrowfill/.style={top color=OrangeRed!20, bottom color=Red, general shadow={fill=black, shadow yshift=-0.8ex, path fading=arrowfading}}}
\tikzset{arrowstyle/.style={draw=FireBrick,arrowfill, single arrow,minimum height=#1, single arrow,
single arrow head extend=.4cm,}}
\begin{document}
\begin{tikzpicture}
% Bubbles
\node[bubble=ForestGreen!40] (wd) at (0,0) {working\\directory};
\node[bubble=Gold!40] (sa) at (2.5,0) {staging\\area};
\node[bubble=DodgerBlue!40] (lc) at (5,0) {local repo};
\node[bubble=Tomato!40] (rc) at (8.5,0) {remote repo};
\node[above= 1 cm of rc,font={\bf}]{Remote};
\node[above= 1 cm of sa,font={\bf}]{Local};
% Lines
\foreach \bubble in {wd,sa,lc,rc}
\draw[ultra thick, gray] ($(\bubble.south)-(0,0.25)$)--($(\bubble.south)-(0,9)$);
% Arrows
\node [arrowstyle=2.5cm,xshift=-0.1cm,yshift=-1.5cm] at ($(wd.south)!0.5!(sa.south)$) {git add};
\node [arrowstyle=2.5cm,xshift=-0.1cm,yshift=-2.5cm] at ($(sa.south)!0.5!(lc.south)$) {git commit};
\node [arrowstyle=3.5cm,xshift=-0.1cm,yshift=-3.5cm] at ($(lc.south)!0.5!(rc.south)$) {git push};
\node [arrowstyle=3.5cm,xshift=0.1cm,yshift=-5cm,shape border rotate=180] at ($(rc.south)!0.5!(lc.south)$) {git fetch};
\node [arrowstyle=5cm,xshift=0.1cm,yshift=-6.5cm,shape border rotate=180] at ($(lc.south)!0.5!(wd.south)$) {git checkout};
\node [arrowstyle=5cm,xshift=0.1cm,yshift=-8cm,shape border rotate=180] at ($(lc.south)!0.5!(wd.south)$) {git merge};
% Background
\begin{pgfonlayer}{background}
\fill[gray!10]($(lc.north)!0.5!(rc.north)+(0,0.5)$)rectangle($(lc.south)!0.5!(rc.south)+(4,-9.5)$) ;
\draw[dashed, shorten <=-1.5cm] ($(lc.south)!0.5!(rc.south)$)--($(lc.south)!0.5!(rc.south)-(0,9.5)$);
\end{pgfonlayer}
\end{tikzpicture}
\end{document}\documentclass{article}
\usepackage{tikz}
\usepackage{xparse}
\usetikzlibrary{tikzmark,decorations.pathreplacing,calc,decorations.markings}
\definecolor{colori}{RGB}{166,35,41}
\definecolor{colorii}{RGB}{248,219,162}
\NewDocumentCommand\MyArrow{O{0pt}mmmO{out=150,in=210}}
{%
\begin{tikzpicture}[overlay, remember picture]
\draw [->,thick,line width=4pt,#4]
( $ ({pic cs:#3}|-{pic cs:#2}) + (-#1,1.3ex) $ ) to[#5]
( $ (pic cs:#3) + (-#1,0) $ );
\end{tikzpicture}%
}
\begin{document}
\MyArrow[0.8em]{start1}{end1}{colorii,line width=3pt}[out=90,in=-90]
\MyArrow[1.8em]{start2}{end1}{colori}[out=120,in=250]
\MyArrow[0.4em]{start3}{end3}{colori}[out=240,in=-30]
\begin{itemize}
\item\tikzmark{end1}Processing
\item\tikzmark{start1}Embedding in paraffin blocks
\item Microtomy
\item\tikzmark{start2}Staining
\item Microscopy
\item Testing \tikzmark{start3} \hfill Math \tikzmark{end3}
\item
\end{itemize}
\end{document}\documentclass{standalone}
\usepackage{tikz}
\usetikzlibrary{tikzmark}
\usepackage{booktabs}
\usepackage{amssymb} % For more math
\usepackage{amsmath}
\usepackage{tabularx}
% no hyphens
\tolerance=1
\emergencystretch=\maxdimen
\hyphenpenalty=10000
\hbadness=10000
\begin{document}
% \begin{tabular}{cc}
% 14\tikzmark{a} & 78 \\
% 71\tikzmark{b} & \tikzmark{c}93 \\
% \end{tabular} \newline
\newcolumntype{L}{>{\centering \arraybackslash}m{4cm}}
\begin{tabular}{L L L}
(a) code-and-fix \tikzmark{a1} & & \tikzmark{a2} (a) assess risks at each step; do most critical
action first \\ \midrule
(b) evolutionary/prototyping \tikzmark{b1} & & \tikzmark{b2}(b) build an initial small requirement
spec, code it, then ``evolve'' the spec and code as
needed \\ \midrule
(c) spiral \tikzmark{c1} & & \tikzmark{c2} (c) build initial requirement specs for several releases,
then design-and-code each in sequence \\ \midrule
(d) staged delivery \tikzmark{d1} & & (d) standard phases ( \tikzmark{d2}requirements, design, code,
test) in order \\ \midrule
(e) waterfall \tikzmark{e1} & & \tikzmark{e2} (e) write some code, debug it, repeat (i.e.
ad-hoc)
\end{tabular}
\begin{tikzpicture}[overlay, remember picture, yshift=.25\baselineskip, shorten >=.5pt, shorten <=.5pt]
% \draw [->] ({pic cs:a1}) [bend left] to ({pic cs:e2});
\draw [->] ({pic cs:a1}) -- ({pic cs:e2});
\draw [->] ({pic cs:c1}) [bend right] to ({pic cs:a2});
\draw [->] ([yshift=.75pt]{pic cs:e1}) -- ({pic cs:d2});
\draw [->] ([yshift=.75pt]{pic cs:b1}) -- ({pic cs:b2});
\draw [->] ([yshift=.75pt]{pic cs:d1}) -- ({pic cs:c2});
\end{tikzpicture}
\end{document}\documentclass{standalone}
\usepackage{tikz}
\usetikzlibrary{calc}
\def\cells#1#2#3{%
% #1 = total number of cells
% #2 = number of grey cells
% #3 = index for "front" ("back" is mod(#3+#2-1, #1))
\foreach [count=\i from 0] \j in {1,...,#1} {
% \node[cell,label=above:\i] (cell\i) at (\i,0) {};
\node[cell] (cell\i) at (\i,0) {};
}
\pgfmathsetmacro{\last}{#3+#2-1}
\foreach \i in {#3,...,\last} {
\pgfmathsetmacro{\back}{mod(\i,#1)}
\node[shaded cell] (back) at (\back,0) {};
}
\node[below] at (cell#3.south) {front};
\node[below] at (back.south) {back};
}
\tikzset{
cell/.style = {draw, minimum width=1cm, minimum height=0.8cm},
shaded cell/.style = {cell, fill=black!30},
}
\begin{document}
%\begin{tikzpicture}
%\cells{6}{3}{0}
%\end{tikzpicture} \\
%
%\begin{tikzpicture}
%\cells{6}{3}{3}
%\end{tikzpicture} \\
%
%\begin{tikzpicture}
%\cells{6}{3}{4}
%\end{tikzpicture} \\
\begin{tikzpicture}
\cells{8}{7}{0}
\foreach [count=\i from 0] \number in {$P_1[0]$, $P_2[0]$, $P_3[0]$, 299, 8, 14, 53, 78}
\node at (cell\i) {\number};
\end{tikzpicture}
\end{document}\documentclass[border=20pt]{standalone}
\usepackage[english]{babel}
\usepackage{tikz-uml}
\begin{document}
\small\begin{tikzpicture}
\begin{umlseqdiag}
\umlactor{user}
\umlobject{AudioService}
\umlobject[]{Settings}
\begin{umlcall}[op=handleMessage(),return=1,name=a]{user}{AudioService}
\begin{umlcall}[op=persistVolume(),return=1]{AudioService}{AudioService}
\begin{umlcall}[op=putIntForUser(),return=1]{AudioService}{Settings}
\begin{umlcall}[op=putStringForUser(),return=1]{Settings}{Settings}
\end{umlcall}
\end{umlcall}
\end{umlcall}
\end{umlcall}
\end{umlseqdiag}
\node [below,font=\scriptsize] at (a-op.south) {MSG\_PERSIST\_VOLUME};
\end{tikzpicture}
\end{document}\documentclass{standalone}
\usepackage{tikz}
\usepackage{tikzscale}
\pgfdeclarelayer{background,foreground}
\pgfsetlayers{background,main,foreground}
\usepackage{tikz-uml}
\usepackage[english]{babel} % load this package so tikz-uml loads, it may be due to my japanesse localle lol.
\begin{document}
\begin{tikzpicture}
\begin{umlseqdiag}
\umlactor{Player A}
\umlobject{Server}
\umlactor{Player B}
% Player spawns, no other player on the map
\begin{umlcall}[op=new-player,return=update-players]{Player A}{Server}
\end{umlcall}
% Player spawns after player A, update both
\begin{umlcall}[dt=7.5,op=new-player,return=update-players]{Player B}{Server}
\begin{umlcall}[type=return,op=update-players]{Server}{Player A}
\end{umlcall}
\end{umlcall}
% Player B shoots a bullet
\begin{umlcall}[op=shoot-bullet,return=bullets-update]{Player B}{Server}
\begin{umlcall}[type=return,op=bullets-update]{Server}{Player A}
\end{umlcall}
\end{umlcall}
% Player A Moves
\begin{umlcall}[op=move-player,return=update-players]{Player B}{Server}
\begin{umlcall}[type=return,op=update-players]{Server}{Player A}
\end{umlcall}
\end{umlcall}
\begin{umlfragment}[type=loop]
\begin{umlcallself}[dt=5,op=ServerGameLoop]{Server}
\begin{umlcallself}[op=spawnHealthPacks]{Server}
\end{umlcallself}
% Update hearts, mini-ships on both sides
\begin{umlcall}[type=return,op=healthPack-update]{Server}{Player A}
\end{umlcall}
\begin{umlcall}[type=return,op=healthPack-update]{Server}{Player B}
\begin{umlcall}[type=return,op=bullet-update]{Server}{Player A}
\end{umlcall}
\begin{umlcall}[type=return,op=bullet-update]{Server}{Player B}
\end{umlcall}
\end{umlcall}
\end{umlcallself}
\end{umlfragment}
\end{umlseqdiag}
\end{tikzpicture}
\end{document}\documentclass[border=3mm]{standalone}
\usepackage[english]{babel}
\usepackage{tikz-uml}
\begin{document}
\begin{tikzpicture}
\tikzumlset{fill object = white, fill call = gray!20}
\begin{umlseqdiag}
\umlobject[class=B]{b}
\umlobject[class=C]{c}
\umlobject[class=D]{d}
\begin{umlfragment}[type=loop]
\begin{umlcallself}[op=run]{b}
\begin{umlcall}[op=send, type=asynchron]{b}{c}
\begin{umlfragment}[type=alt, label=condition, inner xsep=8]
\begin{umlcall}[op=send, type=synchron, return=send update]{c}{d}
\begin{umlcallself}[padding=1.5, op=run]{d}
\end{umlcallself}
\end{umlcall}
\begin{umlcallself}[op=assess update]{c}
\begin{umlcall}[op=send update, type=synchron, return=acknowledge]{c}{b}
\end{umlcall}
\begin{umlcall}[op=allow continue, padding=-2.5, type=asynchron]{c}{b}
\end{umlcall}
\end{umlcallself}
\umlfpart[default]
\begin{umlcall}[op=allow continue, type=asynchron]{c}{b}
\end{umlcall}
\end{umlfragment}
\end{umlcall}
\end{umlcallself}
\end{umlfragment}
\umlsdnode[dt=1.5]{b}
\umlsdnode[dt=5]{c}
\umlsdnode[dt=32]{d}
\end{umlseqdiag}
\end{tikzpicture}
\end{document}\documentclass[ border={60pt 0pt 55pt 0pt}
% left bottom right top] real order is left bottom right top
]{standalone}
\usepackage{float}
\usepackage{tikz}
\usetikzlibrary{positioning, fit, calc, shapes, arrows}
\usepackage[underline=false]{pgf-umlsd}
% message between threads
% Example:
% \bloodymess[delay]{sender}{message content}{receiver}{DIR}{start note}{end note}
\newcommand{\bloodymess}[7][0]{
\stepcounter{seqlevel}
\path
(#2)+(0,-\theseqlevel*\unitfactor-0.7*\unitfactor) node (mess from) {};
\addtocounter{seqlevel}{#1}
\path
(#4)+(0,-\theseqlevel*\unitfactor-0.7*\unitfactor) node (mess to) {};
\draw[->,>=angle 60] (mess from) -- (mess to) node[midway, above]
{#3};
\if R#5
\node (#3 from) at (mess from) {\llap{#6~}};
\node (#3 to) at (mess to) {\rlap{~#7}};
\else\if L#5
\node (#3 from) at (mess from) {\rlap{~#6}};
\node (#3 to) at (mess to) {\llap{#7~}};
\else
\node (#3 from) at (mess from) {#6};
\node (#3 to) at (mess to) {#7};
\fi
\fi
}
\begin{document}
%\begin{figure}[H]
% \centering
\begin{sequencediagram}
\newinst{c}{Client}
\newinst[6]{s}{Server}
\bloodymess[1]{c}{Requesting Access to Server}{s}{R}{Start}{Server receives}
\bloodymess[1]{s}{Access Granted}{c}{L}{Server responds}{}
\bloodymess[1]{c}{Acknowledgement}{s}{R}{2nd handshake begins}{Server receives}
\bloodymess[1]{s}{Send Data and Acknowledge}{c}{L}{}{End}
\end{sequencediagram}
%\caption{Client-Server messaging example}
%\end{figure}
\end{document}\documentclass{report}
\usepackage[table]{xcolor}
\definecolor{lightblue}{rgb}{0.93,0.95,1.0}
\begin{document}
\rowcolors{1}{lightgray}{white} %% <--- here
\noindent
\begin{tabular}[!ht]{>{\bfseries}l <{\raggedright}p{10cm}}
\rowcolor{black!90}\textcolor{white}{Identifier/Name} & \textcolor{white}{\textbf{UC1 - Login}} \\
Importance & 5/5\\
Difficulty & 1/5\\
Actor(s) & Generalized User\\
Goal & To allow the user to access the system.\\
Preconditions & The user is at the login page. \\
Summary & Will validate the users name and password and subsequently give them access to the
system.\\
Steps &
{\begin{tabular}{@{}p{4cm} | p{4cm}@{}}
1. User provides username and password. & 2. System directs user to main system page. \\
\end{tabular}} \\
Postcondition & \textbf{Success:} User is logged in. \newline \textbf{Failure:} The system reamins at the login state. \\
\end{tabular}
\end{document}\documentclass[6pt]{standalone}
\usepackage{tikz}
\usetikzlibrary{snakes}
\usepackage{fullpage}
\begin{document}
%
%\begin{figure}
%\caption{Time Line}
%\centering
%\resizebox{\linewidth}{!}{% Resize table to fit within
\begin{tikzpicture}[]
%draw horizontal line
\draw (0,0) -- (41/1.7,0);
%draw vertical lines
\foreach \x in {0, 8, 15, 22, 29, 36, 41}{
\draw (\x/1.7,3pt) -- (\x/1.7,-3pt);
}
%draw nodes
\draw (0,0) node[text width = 85pt,align=center,below=3pt] {\textbf{Submit Project Proposal}} node[above=3pt] {Nov 17 2017};
\draw (8/1.7,0) node[below=3pt] {Find Game Engine} node[above=3pt] {Nov 20 2017};
\draw (15/1.7,0) node[text width = 100pt,align=center,below=3pt] {Create Server-Client Architecture} node[above=3pt] {Nov 25 2017};
\draw (22/1.7,0) node[text width = 100pt,align=center,below=3pt] {Implement Game Logic} node[above=3pt] {Nov 29 2017};
\draw (29/1.7,0) node[text width = 100pt,align=center,below=3pt] {Add Music and Effects} node[above=3pt] {Dec 1 2017};
\draw (36/1.7,0) node[text width = 100pt,align=center,below=3pt] {\textbf{In Class Demo}} node[above=3pt] {Dec 2 2017};
\draw (41/1.7,0) node[below=3pt] {\textbf{Finish Report}} node[above=3pt] {Dec 12 2017};
\end{tikzpicture}
%}
%\label{fig:time_line}
%\end{figure}
\end{document}\documentclass{standalone}
\usepackage{forest}
\usetikzlibrary{arrows.meta,shapes,positioning,shadows,trees}
%
\tikzset{
basic/.style = {draw, text width=2cm, drop shadow, font=\sffamily, rectangle},
root/.style = {basic, rounded corners=2pt, thin, align=center,
fill=green!30},
onode/.style = {basic, thin, rounded corners=2pt, align=center, fill=green!60,text width=3cm,},
tnode/.style = {basic, thin, align=left, fill=pink!60, text width=6.5em},
xnode/.style = {basic, thin, rounded corners=2pt, align=center, fill=blue!20,text width=5cm,},
wnode/.style = {basic, thin, align=left, fill=pink!10!blue!80!red!10, text width=6.5em},
edge from parent/.style={draw=black, edge from parent fork right}
}
%
\begin{document}
\begin{forest} for tree={
grow=east,
growth parent anchor=east,
parent anchor=east,
child anchor=west,
edge path={\noexpand\path[\forestoption{edge},->, >={latex}]
(!u.parent anchor) -- +(5pt,0pt) |- (.child anchor)
\forestoption{edge label};}
}
[Networked Game Work BreakDown, root
[Software Engineering Report, xnode
[Setting shape, tnode]
[Choosing color, tnode]
[Adding shading, tnode] ]
[Game Demo Preparation, onode
[Using a Matrix, tnode]
[Relatively, tnode]
[Absolutely, tnode]
[Using overlays, wnode] ]
[Project Proposal and Game Logic, onode
[Default arrows, tnode]
[Arrow library, tnode]
[Resizing tips, tnode]
[Shortening, tnode]
[Bending, tnode] ] ]
\end{forest}
\end{document}% Inspired by Learn Algorithmic Trading by Sebastien Donadio Packt on page 10
\documentclass{standalone}
\usepackage{tikz}
\usepackage{xcolor}
\usetikzlibrary{shapes, arrows.meta, positioning}
\begin{document}
\pagestyle{empty}
\begin{tikzpicture}[
node distance=2em and 2em,
block/.style={rectangle, draw,
text width=6.5em, text centered, rounded corners, minimum height=4em},
line/.style={draw, -latex},
]
\node [block, fill=gray!15!red!15] (hc) {HealthCare};
\node [block, fill=gray!45, below right= of hc] (serv) {Services};
\node [block, fill=blue!45, below = of serv] (tech) {Technology};
\node [block,fill=blue!15, below left= of tech] (util) {Utilities};
\node [block,fill=brown!45, above left= of util] (trans) {Transportation};
\node [block, fill=red!45, above = of trans] (fin) {Financial};
% Connections
\path [line] (hc.east) to[out=0, in=90] (serv.north);
\path [line] (serv.south) -- (tech);
\path [line] (tech.south) to[out=-90, in=0] (util.east);
\path [line] (util.west) to[out=180, in=-90] (trans.south);
\path [line] (trans.north) -- (fin);
\path [line] (fin.north) to[out=90, in=180] (hc.west);
% Market Sectors label
\node [draw=none, below = 5em of hc, text width = 2cm, align = center] (label) {\LARGE Market \\[1mm] Sector};
\node [above left = -3em and 3em of util] () {Energy};
\node [above right = -3em and 3em of util] () {Cyclical Goods};
\node [above right = -1em and 0.25em of tech, text width = 3.5em] () {Non-Cyclical Goods};
\node [above right = -1.25em and 0.25em of hc, text width = 7em] () {Basic Materials};
\node [above left = -1.25em and 0.25em of hc, text width = 7em] () {Capital Goods};
\node [above left = 0.25em and -3em of trans] () {Conglomerates};
\end{tikzpicture}
\end{document}\documentclass[varwidth=true,varwidth=\maxdimen]{standalone}
\usepackage{lmodern}
% (2) specify encoding
\usepackage[T1]{fontenc}
% (3) load symbol definitions
\usepackage{textcomp}
\usepackage{tikz}
\usepackage{ifthen}
\usetikzlibrary{arrows,positioning}
% Load tikz library in file "tikzlibraryBES.code.tex"
\tikzset{
% House
hcnode/.style={circle,draw,fill=blue!30, minimum size=30},
hclink/.style={text=blue!30,fill=blue!30},
hclabel/.style={text width= 2cm, align=center},
% hypercube label pics
pics/hclabels/.style args={#1/#2/#3}{
code={
% for convience using 0 to 7
% \node[hclabel] (h10) at (0,0)
\foreach \c [count=\x from 0] in {{0\textunderscore0},{0\textunderscore1},{0\textunderscore2},{0\textunderscore3},{1\textunderscore1},{1\textunderscore0}, {1\textunderscore3},{1\textunderscore2}}
\ifthenelse{\x = #1}
{}
{
% loop through list of colored nodes
\foreach\n/\co in {#3}
\ifthenelse{\x = \n}
{\node[text=\co!60] at (0,-0.5*\x) {#2 $ \rightarrow $ \c};}
{\node at (0,-0.5*\x) {#2 $ \rightarrow $ \c};}
;
}
;
}},
pics/hclabels/.default=0/0\textunderscore0/35,
% hypercube
pics/hypercube/.style args={#1/#2/#3}{
code={
% Define house parameters
\newcommand\wallheight{#1} % 0.65
\newcommand\roofoverhang{#2} % 0.15
\newcommand\roofangle{#3} % 35
% Calculate some dependent sizes
\pgfmathsetmacro\lengthroof{0.5/cos(\roofangle)+\roofoverhang}
% draw profile of house
% \draw[line width=1pt] (-0.5,\wallheight) -- (-0.5,0) -- (0.5,0) -- (0.5,\wallheight) -- ++(-\roofangle:\roofoverhang) -- ++(180-\roofangle:\lengthroof) -- ++(180+\roofangle:\lengthroof) -- cycle;
\node[hcnode] at (0, 0) (00) {0\textunderscore0};
\node[hcnode] at (3, 0) (01) {0\textunderscore1};
\node[hcnode] at (0, -3) (02) {0\textunderscore2};
\node[hcnode] at (3, -3) (03) {0\textunderscore3};
\node[hcnode] at (10, 0) (11) {1\textunderscore1};
\node[hcnode] at (13, 0) (10) {1\textunderscore0};
\node[hcnode] at (10, -3) (13) {1\textunderscore3};
\node[hcnode] at (13, -3) (12) {1\textunderscore2};
% Arrows last
% Draw blue links
\path[draw,blue!30] (00) -- (01) -- (03) -- (02) -- (00);
\path[draw,blue!30] (11) -- (10) -- (12) -- (13) -- (11);
% inner links
\draw [-,blue!30] (01) to [out=30,in=150] (11);
\draw [-,blue!30] (03) to [out=-30,in=-150] (13);
% outer links
\draw [-,blue!30] (00) to [out=30,in=150] (10);
\draw [-,blue!30] (02) to [out=-30,in=-150] (12);
% Draw green links
% Draw Red links
}},
pics/hypercube/.default=0.65/0.15/35
}
\begin{document}
\begin{tikzpicture}
\path (+1.5,-0.85) pic[scale=1.0] {hypercube};
% Labels for Node 0
\path (0,1.5) pic[scale=1.0] {hclabels=0/0\textunderscore0/{0/black}};
% Labels for Node 2
\path (0,-3.5) pic[scale=1.0] {hclabels=2/0\textunderscore2/{2/black}};
% Labels for Node 1
\path (6,2.5) pic[scale=1.0] {hclabels=1/0\textunderscore1/{1/black}};
% Labels for Node 3
\path (6,-3.5) pic[scale=1.0] {hclabels=3/0\textunderscore3/{3/black}};
% Labels for Node 0
\path (16.5,1.5) pic[scale=1.0] {hclabels=5/1\textunderscore0/{5/black}};
% Labels for Node 2
\path (16.5,-3.5) pic[scale=1.0] {hclabels=7/1\textunderscore2/{7/black}};
% Labels for Node 1
\path (9.5,2.5) pic[scale=1.0] {hclabels=4/1\textunderscore1/{4/black}};
% Labels for Node 3
\path (9.5,-3.5) pic[scale=1.0] {hclabels=6/1\textunderscore3/{6/black}};
\end{tikzpicture}
%
% \newline
% \begin{tikzpicture}
% \path (0,0) pic[scale=1.0] {hclabels=0/0\textunderscore0/{1/red,4/green}};
% \path (+1.5,-0.85) pic[scale=1.0] {hypercube};
% \end{tikzpicture}
% \begin{tikzpicture}
% \path (+1.5,-0.85) pic[scale=1.0] {hypercube};
% \end{tikzpicture}
\end{document}\documentclass{article}
\usepackage{tikz}
\usepackage{tikz-3dplot}
\usetikzlibrary{patterns}
\begin{document}
\tdplotsetmaincoords{70}{120}
\begin{tikzpicture}[tdplot_main_coords]
\def\BigSide{5}
\def\SmallSide{1.5}
\pgfmathsetmacro{\CalcSide}{\BigSide-\SmallSide}
% The vertex at V
\tdplotsetcoord{P}{sqrt(3)*\BigSide}{55}{45}
\coordinate (sxl) at (\BigSide,\CalcSide,\BigSide);
\coordinate (syl) at (\CalcSide,\CalcSide,\BigSide);
\coordinate (szl) at (\CalcSide,\BigSide,\BigSide);
\draw[dashed]
(0,0,0) -- (Px)
(0,0,0) -- (Py)
(0,0,0) -- (Pz);
\draw[->]
(Px) -- ++ (1,0,0) node[anchor=north east]{$x$};
\draw[->]
(Py) -- ++(0,1,0) node[anchor=north west]{$y$};
\draw[->]
(Pz) -- ++(0,0,1) node[anchor=south]{$z$};
\draw[thick]
(Pxz) -- (P) -- (Pxy) -- (Px) -- (Pxz) -- (Pz) -- (Pyz) -- (P);
\draw[thick]
(Pyz) -- (Py) -- (Pxy);
\end{tikzpicture}
\end{document}\documentclass{standalone}
\usepackage{pgfplots}
\pgfplotsset{compat=newest}
%% the following commands are needed for some matlab2tikz features
\usetikzlibrary{plotmarks}
\usetikzlibrary{arrows.meta}
\usepgfplotslibrary{patchplots}
\usepackage{grffile}
\usepackage{amsmath}
%% you may also want the following commands
%\pgfplotsset{plot coordinates/math parser=false}
%\newlength\figureheight
%\newlength\figurewidth
\definecolor{mycolor1}{rgb}{0.00000,0.44700,0.74100}
\begin{document}
\begin{tikzpicture}
\begin{axis}[%
width=2.856in,
height=3.04in,
at={(0.532in,0.41in)},
scale only axis,
xmin=-100000000000,
xmax=100000000000,
tick align=outside,
xlabel style={font=\color{white!15!black}},
xlabel={x},
ymin=-100099789790,
ymax=100221383780,
ylabel style={font=\color{white!15!black}},
ylabel={y},
zmin=-100000000000,
zmax=100000000000,
zlabel style={font=\color{white!15!black}},
zlabel={z},
view={-37.5}{30},
axis background/.style={fill=white},
title style={font=\bfseries},
title={Final State for Bodies},
axis x line*=bottom,
axis y line*=left,
axis z line*=left,
xmajorgrids,
ymajorgrids,
zmajorgrids,
legend style={at={(1.03,1)}, anchor=north west, legend cell align=left, align=left, draw=white!15!black}
]
\addplot3[scatter, only marks, mark=o, color=mycolor1, mark options={}, scatter/use mapped color=mycolor1, visualization depends on={\thisrow{size} \as \perpointmarksize}, scatter/@pre marker code/.append style={/tikz/mark size=\perpointmarksize}] table[row sep=crcr]{%
x y z size\\
-99997680035 -99855857673 -99997638019 2.53722289127305\\
-99995820981 -100078368310 -58635.022346 2.53722289127305\\
-99997695110 -100009034110 99997623812 2.51246890528022\\
-99995843643 226503275.05 -99995779505 2.52487623459052\\
-99988412223 -179555862.51 -32819.532687 2.52487623459052\\
-99995844851 -181718398.34 99995769983 2.5\\
-99997702127 99812198113 -99997628815 2.51246890528022\\
-99995834363 100002281340 28394.932892 2.53722289127305\\
-99997688220 100066622950 99997631716 2.52487623459052\\
-38982.610169 -100099789790 -99995805526 2.52487623459052\\
-48117.853869 -100038411320 -32185.880326 2.52487623459052\\
24109.366574 -99841676469 99995788472 2.51246890528022\\
11726.151807 12985306.256 -99988385554 2.51246890528022\\
-28519.319386 195477542.09 -15684.045798 5.59016994374947\\
27742.353864 -21179197.996 99988377381 2.51246890528022\\
8934.5609253 100197328670 -99995811305 2.51246890528022\\
-45136.404472 99925853996 17134.979224 2.51246890528022\\
-37145.860615 100011674450 99995806820 2.52487623459052\\
99997669088 -99781825884 -99997684828 2.52487623459052\\
99995807964 -99925688910 4436.776345 2.51246890528022\\
99997695013 -100027683570 99997681472 2.52487623459052\\
99995838034 -135798071.12 -99995820437 2.53722289127305\\
99988403193 228679228.99 -16782.459343 2.51246890528022\\
99995842575 -30315078.36 99995814229 2.52487623459052\\
99997700542 100089944940 -99997679122 2.52487623459052\\
99995828402 100221383780 -17685.690958 2.52487623459052\\
99997679305 100068347900 99997674675 2.51246890528022\\
};
\end{axis}
\end{tikzpicture}
\end{document}\documentclass{standalone}
\usepackage{pgfplots}
\pgfplotsset{compat=newest}
%% the following commands are needed for some matlab2tikz features
\usetikzlibrary{plotmarks}
\usetikzlibrary{arrows.meta}
\usepgfplotslibrary{patchplots}
\usepackage{grffile}
\usepackage{amsmath}
%% you may also want the following commands
%\pgfplotsset{plot coordinates/math parser=false}
%\newlength\figureheight
%\newlength\figurewidth
\definecolor{mycolor1}{rgb}{0.00000,0.44700,0.74100}
\begin{document}
% This file was created by matlab2tikz.
%
%The latest updates can be retrieved from
% http://www.mathworks.com/matlabcentral/fileexchange/22022-matlab2tikz-matlab2tikz
%where you can also make suggestions and rate matlab2tikz.
%
% This file was created by matlab2tikz.
%
%The latest updates can be retrieved from
% http://www.mathworks.com/matlabcentral/fileexchange/22022-matlab2tikz-matlab2tikz
%where you can also make suggestions and rate matlab2tikz.
%
\definecolor{mycolor1}{rgb}{0.00000,0.44700,0.74100}%
%
\begin{tikzpicture}
\begin{axis}[%
width=2.894in,
height=3.04in,
at={(0.487in,0.41in)},
scale only axis,
xmin=0,
xmax=1500000000000,
tick align=outside,
xlabel style={font=\color{white!15!black}},
xlabel={x},
ymin=0,
ymax=2374061464.1,
ylabel style={font=\color{white!15!black}},
ylabel={y},
zmin=0,
zmax=60000000,
zlabel style={font=\color{white!15!black}},
zlabel={z},
view={-37.5}{30},
axis background/.style={fill=white},
title style={font=\bfseries},
title={Final State for Bodies},
axis x line*=bottom,
axis y line*=left,
axis z line*=left,
xmajorgrids,
ymajorgrids,
zmajorgrids,
legend style={at={(1.03,1)}, anchor=north west, legend cell align=left, align=left, draw=white!15!black}
]
\addplot3[scatter, only marks, mark=o, color=mycolor1, mark options={}, scatter/use mapped color=mycolor1, visualization depends on={\thisrow{size} \as \perpointmarksize}, scatter/@pre marker code/.append style={/tikz/mark size=\perpointmarksize}] table[row sep=crcr]{%
x y z size\\
355.01516663 0.45633240291 3.1373940057e-05 5.59016994374947\\
57860329160 2374061464.1 0.00013618376453 2.51246890528022\\
108185770600 1773462602.7 0.0014797416918 2.51246890528022\\
149592556230 1502928808.9 2189.5755515 2.51246890528022\\
149592556110 1143477886.9 51023397.742 2.5\\
227916793400 1327644037.8 0.00021862720095 2.51246890528022\\
778499725250 656310053.74 4.2228335855e-07 2.51246890528022\\
1352549908400 484968085.96 6.0340446e-08 2.51246890528022\\
};
\end{axis}
\end{tikzpicture}%
\end{document}\documentclass{article}
\usepackage[left=0.5in,right=0.5in,top=0in,bottom=0in]{geometry}
\usepackage{tikz}
\usetikzlibrary{shapes,arrows,shadows, positioning, calc}
% Define block styles used later
% Interconnection network block
\tikzstyle{intn}=[draw, fill=blue!20, text width=15em,
text centered, minimum height=2em]
% Directory block
\tikzstyle{d} = [text width=3em, text centered, minimum height=2em,rounded corners,fill=green!20]
% memory block
\tikzstyle{m} = [text width=3em, align=left, minimum height=2em,rounded corners,fill=blue!20]
% Caches
\tikzstyle{ca} = [text width=3em, text centered, minimum height=2em,rounded corners, fill=red!20]
% CPU Blocks
\tikzstyle{cpu} = [text width=3em, text centered, minimum height=2em,fill=yellow!20]
\usepackage{subcaption}
\begin{document}
\begin{figure}
\centering
\begin{subfigure}[b]{0.45\textwidth}
\begin{tikzpicture}[node distance=1.75cm and 1cm]
% Block nodes
\node (in1) [draw, intn] {Interconnection Network};
\node (d2) [yshift=-0.9cm, draw, d] {};
\node (d1) [left of = d2, draw, d] {};
\node (d3) [right of = d2, draw, d] {};
\node (m2) [yshift=-1.8cm, draw, m] {};
\node (m1) [left of = m2, draw, m] {};
\node (m3) [right of = m2, draw, m] {X};
\node (ca2) [yshift=-2.7cm, draw, ca] {};
\node (ca1) [left of = ca2, draw, ca] {};
\node (ca3) [right of = ca2, draw, ca] {};
\node (cpu2) [yshift=-3.6cm, draw, cpu] {CPU 1};
\node (cpu1) [left of = cpu2,draw, cpu] {CPU 0};
\node (cpu3) [right of = cpu2, draw, cpu] {CPU 2};
% Node within nodes
% Label inside node
\node[draw,fill=white!30] at (d3.center) {U000};
\node[draw,fill=white!30] at (m3.center) {4};
% Label nodes, comment out for preceeding diagrams
\node (dlabel) [left of = d1] {\small{Directories}};
\node (mlabel) [left of = m1] {\small{Memories}};
\node (calabel) [left of = ca1] {\small{Caches}};
% Paths to connect all nodes for first column
\draw ($(in1.south west) +(0.2,0)$) |- (d1.west);
\draw (m1.west) -| ($(in1.south west) +(0.2,0) $);
\draw (ca1.west) -| ($(in1.south west) +(0.2,0) $);
% Paths for second column
\draw ($(in1.south west) +(1.95,0)$) |- (d2.west);
\draw (m2.west) -| ($(in1.south west) +(1.95,0) $);
\draw (ca2.west) -| ($(in1.south west) +(1.95,0) $);
% Paths for third column
\draw ($(in1.south west) +(3.7,0)$) |- (d3.west);
\draw (m3.west) -| ($(in1.south west) +(3.7,0) $);
\draw (ca3.west) -| ($(in1.south west) +(3.7,0) $);
% CPU Connections
\draw (ca1) -- (cpu1);
\draw (ca2) -- (cpu2);
\draw (ca3) -- (cpu3);
% arrow outside
\node (ulabel) [right = 0.5cm of d3, text width=2cm] {\small{Information about cache block \\ containing X}};
\draw [->] (ulabel) -- (d3.east);
%\draw (cpu1.west) -| ($(in1.south west) +(0.1,0) $);
\end{tikzpicture}
\caption{}
\end{subfigure}
\hfill %add desired spacing between images, e. g. ~, \quad, \qquad, \hfill etc.
%(or a blank line to force the subfigure onto a new line)
\begin{subfigure}[b]{0.45\textwidth}
\begin{tikzpicture}[node distance=1.75cm and 1cm]
% Block nodes
\node (in1) [draw, intn] {Interconnection Network};
\node (d2) [yshift=-0.9cm, draw, d] {};
\node (d1) [left of = d2, draw, d] {};
\node (d3) [right of = d2, draw, d] {};
\node (m2) [yshift=-1.8cm, draw, m] {};
\node (m1) [left of = m2, draw, m] {};
\node (m3) [right of = m2, draw, m] {X};
\node (ca2) [yshift=-2.7cm, draw, ca] {};
\node (ca1) [left of = ca2, draw, ca] {};
\node (ca3) [right of = ca2, draw, ca] {};
\node (cpu2) [yshift=-3.6cm, draw, cpu] {CPU 1};
\node (cpu1) [left of = cpu2,draw, cpu] {CPU 0};
\node (cpu3) [right of = cpu2, draw, cpu] {CPU 2};
% Node within nodes
% Label inside node
\node[draw,fill=white!30] at (d3.center) {S001};
\node[draw,fill=white!30] at (m3.center) {4};
\node[xshift=-0.4cm] at (ca3.center) {X};
\node[draw,fill=white!30] at (ca3.center) {4};
% Label nodes, comment out for preceeding diagrams
% \node (dlabel) [left of = d1] {\small{Directories}};
% \node (mlabel) [left of = m1] {\small{Memories}};
% \node (calabel) [left of = ca1] {\small{Caches}};
% Paths to connect all nodes for first column
\draw ($(in1.south west) +(0.2,0)$) |- (d1.west);
\draw (m1.west) -| ($(in1.south west) +(0.2,0) $);
\draw (ca1.west) -| ($(in1.south west) +(0.2,0) $);
% Paths for second column
\draw ($(in1.south west) +(1.95,0)$) |- (d2.west);
\draw (m2.west) -| ($(in1.south west) +(1.95,0) $);
\draw (ca2.west) -| ($(in1.south west) +(1.95,0) $);
% Paths for third column
\draw ($(in1.south west) +(3.7,0)$) |- (d3.west);
\draw (m3.west) -| ($(in1.south west) +(3.7,0) $);
\draw (ca3.west) -| ($(in1.south west) +(3.7,0) $);
% CPU Connections
\draw (ca1) -- (cpu1);
\draw (ca2) -- (cpu2);
\draw (ca3) -- (cpu3);
%\draw (cpu1.west) -| ($(in1.south west) +(0.1,0) $);
\end{tikzpicture}
\caption{}
\end{subfigure}
% Row two
\begin{subfigure}[b]{0.3\textwidth}
\begin{tikzpicture}[node distance=1.75cm and 1cm]
% Block nodes
\node (in1) [draw, intn] {Interconnection Network};
\node (d2) [yshift=-0.9cm, draw, d] {};
\node (d1) [left of = d2, draw, d] {};
\node (d3) [right of = d2, draw, d] {};
\node (m2) [yshift=-1.8cm, draw, m] {};
\node (m1) [left of = m2, draw, m] {};
\node (m3) [right of = m2, draw, m] {X};
\node (ca2) [yshift=-2.7cm, draw, ca] {};
\node (ca1) [left of = ca2, draw, ca] {};
\node (ca3) [right of = ca2, draw, ca] {};
\node (cpu2) [yshift=-3.6cm, draw, cpu] {CPU 1};
\node (cpu1) [left of = cpu2,draw, cpu] {CPU 0};
\node (cpu3) [right of = cpu2, draw, cpu] {CPU 2};
% Node within nodes
% Label inside node
\node[draw,fill=white!30] at (d3.center) {E001};
\node[draw,fill=white!30] at (m3.center) {4};
\node[xshift=-0.4cm] at (ca3.center) {X};
\node[draw,fill=white!30] at (ca3.center) {5};
% Label nodes, comment out for preceeding diagrams
% \node (dlabel) [left of = d1] {\small{Directories}};
% \node (mlabel) [left of = m1] {\small{Memories}};
% \node (calabel) [left of = ca1] {\small{Caches}};
% Paths to connect all nodes for first column
\draw ($(in1.south west) +(0.2,0)$) |- (d1.west);
\draw (m1.west) -| ($(in1.south west) +(0.2,0) $);
\draw (ca1.west) -| ($(in1.south west) +(0.2,0) $);
% Paths for second column
\draw ($(in1.south west) +(1.95,0)$) |- (d2.west);
\draw (m2.west) -| ($(in1.south west) +(1.95,0) $);
\draw (ca2.west) -| ($(in1.south west) +(1.95,0) $);
% Paths for third column
\draw ($(in1.south west) +(3.7,0)$) |- (d3.west);
\draw (m3.west) -| ($(in1.south west) +(3.7,0) $);
\draw (ca3.west) -| ($(in1.south west) +(3.7,0) $);
% CPU Connections
\draw (ca1) -- (cpu1);
\draw (ca2) -- (cpu2);
\draw (ca3) -- (cpu3);
%\draw (cpu1.west) -| ($(in1.south west) +(0.1,0) $);
\end{tikzpicture}
\caption{}
\end{subfigure}
~ %add desired spacing between images, e. g. ~, \quad, \qquad, \hfill etc.
%(or a blank line to force the subfigure onto a new line), object d
\begin{subfigure}[b]{0.3\textwidth}
\begin{tikzpicture}[node distance=1.75cm and 1cm]
% Block nodes
\node (in1) [draw, intn] {Interconnection Network};
\node (d2) [yshift=-0.9cm, draw, d] {};
\node (d1) [left of = d2, draw, d] {};
\node (d3) [right of = d2, draw, d] {};
\node (m2) [yshift=-1.8cm, draw, m] {};
\node (m1) [left of = m2, draw, m] {};
\node (m3) [right of = m2, draw, m] {X};
\node (ca2) [yshift=-2.7cm, draw, ca] {};
\node (ca1) [left of = ca2, draw, ca] {};
\node (ca3) [right of = ca2, draw, ca] {};
\node (cpu2) [yshift=-3.6cm, draw, cpu] {CPU 1};
\node (cpu1) [left of = cpu2,draw, cpu] {CPU 0};
\node (cpu3) [right of = cpu2, draw, cpu] {CPU 2};
% Node within nodes
% Label inside node
\node[draw,fill=white!30] at (d3.center) {S011};
\node[draw,fill=white!30] at (m3.center) {5};
\node[xshift=-0.4cm] at (ca2.center) {X};
\node[draw,fill=white!30] at (ca2.center) {5};
\node[xshift=-0.4cm] at (ca3.center) {X};
\node[draw,fill=white!30] at (ca3.center) {5};
% Label nodes, comment out for preceeding diagrams
% \node (dlabel) [left of = d1] {\small{Directories}};
% \node (mlabel) [left of = m1] {\small{Memories}};
% \node (calabel) [left of = ca1] {\small{Caches}};
% Paths to connect all nodes for first column
\draw ($(in1.south west) +(0.2,0)$) |- (d1.west);
\draw (m1.west) -| ($(in1.south west) +(0.2,0) $);
\draw (ca1.west) -| ($(in1.south west) +(0.2,0) $);
% Paths for second column
\draw ($(in1.south west) +(1.95,0)$) |- (d2.west);
\draw (m2.west) -| ($(in1.south west) +(1.95,0) $);
\draw (ca2.west) -| ($(in1.south west) +(1.95,0) $);
% Paths for third column
\draw ($(in1.south west) +(3.7,0)$) |- (d3.west);
\draw (m3.west) -| ($(in1.south west) +(3.7,0) $);
\draw (ca3.west) -| ($(in1.south west) +(3.7,0) $);
% CPU Connections
\draw (ca1) -- (cpu1);
\draw (ca2) -- (cpu2);
\draw (ca3) -- (cpu3);
%\draw (cpu1.west) -| ($(in1.south west) +(0.1,0) $);
\end{tikzpicture}
\caption{}
\end{subfigure}
~
\begin{subfigure}[b]{0.3\textwidth}
\begin{tikzpicture}[node distance=1.75cm and 1cm]
% Block nodes
\node (in1) [draw, intn] {Interconnection Network};
\node (d2) [yshift=-0.9cm, draw, d] {};
\node (d1) [left of = d2, draw, d] {};
\node (d3) [right of = d2, draw, d] {};
\node (m2) [yshift=-1.8cm, draw, m] {};
\node (m1) [left of = m2, draw, m] {};
\node (m3) [right of = m2, draw, m] {X};
\node (ca2) [yshift=-2.7cm, draw, ca] {};
\node (ca1) [left of = ca2, draw, ca] {};
\node (ca3) [right of = ca2, draw, ca] {};
\node (cpu2) [yshift=-3.6cm, draw, cpu] {CPU 1};
\node (cpu1) [left of = cpu2,draw, cpu] {CPU 0};
\node (cpu3) [right of = cpu2, draw, cpu] {CPU 2};
% Node within nodes
% Label inside node
\node[draw,fill=white!30] at (d3.center) {S111};
\node[draw,fill=white!30] at (m3.center) {5};
\node[xshift=-0.4cm] at (ca1.center) {X};
\node[draw,fill=white!30] at (ca1.center) {5};
\node[xshift=-0.4cm] at (ca2.center) {X};
\node[draw,fill=white!30] at (ca2.center) {5};
\node[xshift=-0.4cm] at (ca3.center) {X};
\node[draw,fill=white!30] at (ca3.center) {5};
% Label nodes, comment out for preceeding diagrams
% \node (dlabel) [left of = d1] {\small{Directories}};
% \node (mlabel) [left of = m1] {\small{Memories}};
% \node (calabel) [left of = ca1] {\small{Caches}};
% Paths to connect all nodes for first column
\draw ($(in1.south west) +(0.2,0)$) |- (d1.west);
\draw (m1.west) -| ($(in1.south west) +(0.2,0) $);
\draw (ca1.west) -| ($(in1.south west) +(0.2,0) $);
% Paths for second column
\draw ($(in1.south west) +(1.95,0)$) |- (d2.west);
\draw (m2.west) -| ($(in1.south west) +(1.95,0) $);
\draw (ca2.west) -| ($(in1.south west) +(1.95,0) $);
% Paths for third column
\draw ($(in1.south west) +(3.7,0)$) |- (d3.west);
\draw (m3.west) -| ($(in1.south west) +(3.7,0) $);
\draw (ca3.west) -| ($(in1.south west) +(3.7,0) $);
% CPU Connections
\draw (ca1) -- (cpu1);
\draw (ca2) -- (cpu2);
\draw (ca3) -- (cpu3);
%\draw (cpu1.west) -| ($(in1.south west) +(0.1,0) $);
\end{tikzpicture}
\caption{}
\end{subfigure}
% Row 3
\begin{subfigure}[b]{0.3\textwidth}
\begin{tikzpicture}[node distance=1.75cm and 1cm]
% Block nodes
\node (in1) [draw, intn] {Interconnection Network};
\node (d2) [yshift=-0.9cm, draw, d] {};
\node (d1) [left of = d2, draw, d] {};
\node (d3) [right of = d2, draw, d] {};
\node (m2) [yshift=-1.8cm, draw, m] {};
\node (m1) [left of = m2, draw, m] {};
\node (m3) [right of = m2, draw, m] {X};
\node (ca2) [yshift=-2.7cm, draw, ca] {};
\node (ca1) [left of = ca2, draw, ca] {};
\node (ca3) [right of = ca2, draw, ca] {};
\node (cpu2) [yshift=-3.6cm, draw, cpu] {CPU 1};
\node (cpu1) [left of = cpu2,draw, cpu] {CPU 0};
\node (cpu3) [right of = cpu2, draw, cpu] {CPU 2};
% Node within nodes
% Label inside node
\node[draw,fill=white!30] at (d3.center) {E010};
\node[draw,fill=white!30] at (m3.center) {5};
\node[xshift=-0.4cm] at (ca2.center) {X};
\node[draw,fill=white!30] at (ca2.center) {9};
% Label nodes, comment out for preceeding diagrams
% \node (dlabel) [left of = d1] {\small{Directories}};
% \node (mlabel) [left of = m1] {\small{Memories}};
% \node (calabel) [left of = ca1] {\small{Caches}};
% Paths to connect all nodes for first column
\draw ($(in1.south west) +(0.2,0)$) |- (d1.west);
\draw (m1.west) -| ($(in1.south west) +(0.2,0) $);
\draw (ca1.west) -| ($(in1.south west) +(0.2,0) $);
% Paths for second column
\draw ($(in1.south west) +(1.95,0)$) |- (d2.west);
\draw (m2.west) -| ($(in1.south west) +(1.95,0) $);
\draw (ca2.west) -| ($(in1.south west) +(1.95,0) $);
% Paths for third column
\draw ($(in1.south west) +(3.7,0)$) |- (d3.west);
\draw (m3.west) -| ($(in1.south west) +(3.7,0) $);
\draw (ca3.west) -| ($(in1.south west) +(3.7,0) $);
% CPU Connections
\draw (ca1) -- (cpu1);
\draw (ca2) -- (cpu2);
\draw (ca3) -- (cpu3);
%\draw (cpu1.west) -| ($(in1.south west) +(0.1,0) $);
\end{tikzpicture}
\caption{}
\end{subfigure}
~
\begin{subfigure}[b]{0.5\textwidth}
\begin{tikzpicture}[node distance=1.5cm and 1cm]
\node[text width=25 em] (u){\textbf{Uncached(U)} --- not currently in any processor's cache.};
\node[text width=25 em, below of = u ] (s) {\textbf{Shared(S)} --- cached by one or more processors and the copy in memory is correct.};
\node[text width=25 em, below of = s ] {\textbf{Cached(C)} --- cached by exactly one processor that has written the block, so that the copy in money is obsolete.};
\end{tikzpicture}
\caption{}
\end{subfigure}
%\caption*{Directory-based Cache Operations. (a) Starting Cache from Figure 2.19. (b) State after CPU 2 reads X. (c) State after CPU 2 writes value 5 to X. (d) State after CPU 1 reads X. (e) State after CPU 0 reads X. (f) State after CPU 1 writes value 9 to X.}
\end{figure}
\end{document}\documentclass{standalone}
\usepackage{tikz}
\usepackage{sa-tikz}
\usetikzlibrary{positioning}
\begin{document}
\tikzset{module size=0.6cm,pin length factor=0.6,
module ysep=1.0, module xsep=3.5}
\begin{tikzpicture}[P=16]
\node[banyan omega={module label opacity=0}] {};
\newcounter{portb}
\setcounter{portb}{0}
\foreach \module in {1,...,8}{
\foreach \port in {1,...,2}{
\stepcounter{portb}
\pgfmathbin{\theportb-1}
\node[left] at (r0-\module-front input-\port)
{\scriptsize{\pgfmathresult}};
\node[right] at (r4-\module-front output-\port)
{\scriptsize{\pgfmathresult}};
}
}
\draw[red,ultra thick] (r0-2-front input-1) -- (r0-2-front output-1)--
(r1-3-front input-1) -- (r1-3-front output-2)-- (r2-6-front input-1)--
(r2-6-front output-1) -- (r3-3-front input-2) -- (r3-3-front output-1)--
(r4-5-front input-1) -- (r4-5-front output-1);
\end{tikzpicture}
\end{document}\documentclass[tikz]{standalone}
\usetikzlibrary{arrows,chains,positioning,scopes,quotes,bending,calc,intersections}
\tikzset{
block/.style={draw,minimum width=1em,minimum height=1em,align=center,fill=blue!30},
arrow/.style={->},
line/.style={-}
}
\begin{document}
\begin{tikzpicture}[>=stealth',node distance=0.5cm]
% Creating rows of blocks
{[start chain]
\node[on chain] (s0) {};
\node[on chain] (s1) {};
\node[on chain] (s2) {};
\node[on chain] (s3) {};
\node[on chain] (s4) {};
}
{[start chain]
\node[block,on chain, below = 0.15 cm of s0] (A0) {};
\node[block,on chain, join =by {line}] (A1) {};
\node[block,on chain, join =by {line}] (A2) {};
\node[block,on chain, join =by {line}] (A3) {};
\node[block,on chain, join =by {line}] (A4) {};
}
{[start chain]
\node[block,on chain, below = of A0] (B0) {};
\node[block,on chain, join =by {line}] (B1) {};
\node[block,on chain, join =by {line}] (B2) {};
\node[block,on chain, join =by {line}] (B3) {};
\node[block,on chain, join =by {line}] (B4) {};
}
{[start chain]
\node[block,on chain, below = of B0] (C0) {};
\node[block,on chain, join =by {line}] (C1) {};
\node[block,on chain, join =by {line}] (C2) {};
\node[block,on chain, join =by {line}] (C3) {};
\node[block,on chain, join =by {line}] (C4) {};
}
{[start chain]
\node[block,on chain, below = of C0] (D0) {};
\node[block,on chain, join =by {line}] (D1) {};
\node[block,on chain, join =by {line}] (D2) {};
\node[block,on chain, join =by {line}] (D3) {};
\node[block,on chain, join =by {line}] (D4) {};
}
% {[start chain]
% \node[block,on chain, below = of D0] (E0) {};
% \node[block,on chain, join =by {line}] (E1) {};
% \node[block,on chain, join =by {line}] (E2) {};
% \node[block,on chain, join =by {line}] (E3) {};
% \node[block,on chain, join =by {line}] (E4) {};
% }
% Drawing vertical lines
\draw (A0) -- (B0) -- (C0) -- (D0); % -- (E0);
\draw (A1) -- (B1) -- (C1) -- (D1); % -- (E1);
\draw (A2) -- (B2) -- (C2) -- (D2); % -- (E2);
\draw (A3) -- (B3) -- (C3) -- (D3); % -- (E3);
\draw (A4) -- (B4) -- (C4) -- (D4); % -- (E4);
% Drawing loop backs horizontal
\draw (A0.west) -- ($(A0.west) - (0.15, 0)$);
\draw ($(A0.west) - (0.15, 0)$) -- ($(A0.west) - (0.15, 0)+(0,0.5)$);
\draw ($(A0.west) - (0.15, 0)+(0,0.5)$) -- ($(A0.west) +(4,0.5)$);
\draw ($(A0.west) +(4,0.5)$) |- (A4.east);
% \draw (A0.north) |- (s2.north east) -| (A4.north);
% B row
\draw (B0.west) -- ($(B0.west) - (0.15, 0)$);
\draw ($(B0.west) - (0.15, 0)$) -- ($(B0.west) - (0.15, 0)+(0,0.5)$);
\draw ($(B0.west) - (0.15, 0)+(0,0.5)$) -- ($(B0.west) +(4,0.5)$);
\draw ($(B0.west) +(4,0.5)$) |- (B4.east);
% C row
\draw (C0.west) -- ($(C0.west) - (0.15, 0)$);
\draw ($(C0.west) - (0.15, 0)$) -- ($(C0.west) - (0.15, 0)+(0,0.5)$);
\draw ($(C0.west) - (0.15, 0)+(0,0.5)$) -- ($(C0.west) +(4,0.5)$);
\draw ($(C0.west) +(4,0.5)$) |- (C4.east);
% D row
\draw (D0.west) -- ($(D0.west) - (0.15, 0)$);
\draw ($(D0.west) - (0.15, 0)$) -- ($(D0.west) - (0.15, 0)+(0,0.5)$);
\draw ($(D0.west) - (0.15, 0)+(0,0.5)$) -- ($(D0.west) +(4,0.5)$);
\draw ($(D0.west) +(4,0.5)$) |- (D4.east);
% E row
%\draw (E0.west) -- ($(E0.west) - (0.15, 0)$);
%\draw ($(E0.west) - (0.15, 0)$) -- ($(E0.west) - (0.15, 0)+(0,0.5)$);
%\draw ($(E0.west) - (0.15, 0)+(0,0.5)$) -- ($(E0.west) +(4,0.5)$);
%\draw ($(E0.west) +(4,0.5)$) |- (E4.east);
% Vertical Loopbacks
% 0 column
\draw (A0.north) -- ($(A0.north) + (0.0, 0.15)$);
\draw ($(A0.north) + (0, 0.15)$) -- ($(A0.north) + (0, 0.15)+(-0.5,0)$);
\draw ($(A0.north) + (0, 0.15)+(-0.5,0)$) -- ($(D0.north) +(-0.5,-0.65)$);
\draw ($(D0.north) +(-0.5,-0.65)$) -| (D0.south);
% 1 column
\draw (A1.north) -- ($(A1.north) + (0.0, 0.15)$);
\draw ($(A1.north) + (0, 0.15)$) -- ($(A1.north) + (0, 0.15)+(-0.5,0)$);
\draw ($(A1.north) + (0, 0.15)+(-0.5,0)$) -- ($(D1.north) +(-0.5,-0.65)$);
\draw ($(D1.north) +(-0.5,-0.65)$) -| (D1.south);
% 2 column
\draw (A2.north) -- ($(A2.north) + (0.0, 0.15)$);
\draw ($(A2.north) + (0, 0.15)$) -- ($(A2.north) + (0, 0.15)+(-0.5,0)$);
\draw ($(A2.north) + (0, 0.15)+(-0.5,0)$) -- ($(D2.north) +(-0.5,-0.65)$);
\draw ($(D2.north) +(-0.5,-0.65)$) -| (D2.south);
% 3 column
\draw (A3.north) -- ($(A3.north) + (0.0, 0.15)$);
\draw ($(A3.north) + (0, 0.15)$) -- ($(A3.north) + (0, 0.15)+(-0.5,0)$);
\draw ($(A3.north) + (0, 0.15)+(-0.5,0)$) -- ($(D3.north) +(-0.5,-0.65)$);
\draw ($(D3.north) +(-0.5,-0.65)$) -| (D3.south);
% 4 column
\draw (A4.north) -- ($(A4.north) + (0.0, 0.15)$);
\draw ($(A4.north) + (0, 0.15)$) -- ($(A4.north) + (0, 0.15)+(-0.5,0)$);
\draw ($(A4.north) + (0, 0.15)+(-0.5,0)$) -- ($(D4.north) +(-0.5,-0.65)$);
\draw ($(D4.north) +(-0.5,-0.65)$) -| (D4.south);
\end{tikzpicture}
\end{document}\documentclass[tikz]{standalone}
\tikzset{near start abs/.style={xshift=1cm}}
\usetikzlibrary{positioning}
\begin{document}
\begin{tikzpicture}[node distance=1.5cm]
% place nodes
\node[circle,draw=black, fill=white, inner sep=0pt,minimum size=10pt] (r) {};
\node[circle,draw=black, fill=white, inner sep=0pt,right of=r, minimum size=10pt] (r1a) {};
\node[circle,draw=black, fill=white, inner sep=0pt,above right of=r, minimum size=10pt] (r2a) {};
\node[circle,draw=black, fill=white, inner sep=0pt,right of=r2a, minimum size=10pt] (r2b) {};
\node[circle,draw=black, fill=white, inner sep=0pt,above of=r2a, minimum size=10pt] (r3a) {};
\node[circle,draw=black, fill=white, inner sep=0pt,right of=r3a, minimum size=10pt] (r3b) {};
\node[circle,draw=black, fill=white, inner sep=0pt,above right of=r3a, minimum size=10pt] (r4a) {};
\node[circle,draw=black, fill=white, inner sep=0pt,right of=r4a, minimum size=10pt] (r4b) {};
% Extension from 7 nodes
% Blank node
\node[inner sep=0pt,below right of=r, minimum size=10pt] (t) {};
\node[circle,draw=black, fill=white, inner sep=0pt,below right of=t, minimum size=10pt] (t1) {};
\node[circle,draw=black, fill=white, inner sep=0pt,above right of=t1, minimum size=10pt] (t2a) {};
\node[circle,draw=black, fill=white, inner sep=0pt,right of=t1, minimum size=10pt] (t2b) {};
\draw (r) -- node[above] {\small{1}} ++(r1a);
\draw (r) -- node[above] {\small{2}} ++(r2a);
\draw (r3a) -- node[above] {\small{3}} ++(r);
\draw (r2a) -- node[above] {\small{1}} ++(r2b);
\draw (r3a) -- node[above] {\small{1}} ++(r3b);
\draw (r3a) -- node[above] {\small{2}} ++(r4a);
\draw (r4a) -- node[above] {\small{1}} ++(r4b);
\draw[->, thick] (r) -- node[above] {\small{4}} ++(t1);
\draw (t1) -- node[above] {\small{3}} ++(t2a);
\draw (t1) -- node[above] {\small{2}} ++(t2b);
\end{tikzpicture}
\end{document}\documentclass[tikz]{standalone}
\tikzset{near start abs/.style={xshift=1cm}}
\usetikzlibrary{positioning}
\begin{document}
\begin{tikzpicture}[node distance=1.5cm]
% place nodes
\node[circle,draw=black, fill=white, inner sep=0pt,minimum size=10pt] (r) {};
\node[circle,draw=black, fill=white, inner sep=0pt,right of=r, minimum size=10pt] (r1a) {};
\node[circle,draw=black, fill=white, inner sep=0pt,above right of=r, minimum size=10pt] (r2a) {};
\node[circle,draw=black, fill=white, inner sep=0pt,right of=r2a, minimum size=10pt] (r2b) {};
\node[circle,draw=black, fill=white, inner sep=0pt,above of=r2a, minimum size=10pt] (r3a) {};
\node[circle,draw=black, fill=white, inner sep=0pt,right of=r3a, minimum size=10pt] (r3b) {};
\node[circle,draw=black, fill=white, inner sep=0pt,above right of=r3a, minimum size=10pt] (r4a) {};
\node[circle,draw=black, fill=white, inner sep=0pt,right of=r4a, minimum size=10pt] (r4b) {};
% Extension from 7 nodes
% Blank node
\node[inner sep=0pt,below right of=r, minimum size=10pt] (t) {};
\node[circle,draw=black, fill=white, inner sep=0pt,below right of=t, minimum size=10pt] (t1) {};
\node[circle,draw=black, fill=white, inner sep=0pt,right of=t1, minimum size=10pt] (t1a) {};
\node[circle,draw=black, fill=white, inner sep=0pt,above right of=t1, minimum size=10pt] (t2a) {};
\node[circle,draw=black, fill=white, inner sep=0pt,right of=t2a, minimum size=10pt] (t2b) {};
\node[circle,draw=black, fill=white, inner sep=0pt,above of=t2a, minimum size=10pt] (t3a) {};
\node[circle,draw=black, fill=white, inner sep=0pt,right of=t3a, minimum size=10pt] (t3b) {};
\node[circle,draw=black, fill=white, inner sep=0pt,above right of=t3a, minimum size=10pt] (t4a) {};
\node[circle,draw=black, fill=white, inner sep=0pt,right of=t4a, minimum size=10pt] (t4b) {};
% Third group
\node[inner sep=0pt,below right of=t1, minimum size=10pt] (v) {};
\node[circle,draw=black, fill=white, inner sep=0pt,below right of=v, minimum size=10pt] (v1) {};
\node[circle,draw=black, fill=white, inner sep=0pt,right of=v1, minimum size=10pt] (v1a) {};
\node[circle,draw=black, fill=white, inner sep=0pt,above right of=v1, minimum size=10pt] (v2a) {};
\node[circle,draw=black, fill=white, inner sep=0pt,above right of=v1,yshift=1cm, minimum size=10pt] (v3a) {};
\node[circle,draw=black, fill=white, inner sep=0pt,above right of=v3a, minimum size=10pt] (v4a) {};
\draw (r) -- node[above] {\small{1}} ++(r1a);
\draw (r) -- node[above] {\small{2}} ++(r2a);
\draw (r3a) -- node[above] {\small{3}} ++(r);
\draw (r2a) -- node[above] {\small{1}} ++(r2b);
\draw (r3a) -- node[above] {\small{1}} ++(r3b);
\draw (r3a) -- node[above] {\small{2}} ++(r4a);
\draw (r4a) -- node[above] {\small{1}} ++(r4b);
% Second nodes
\draw (t1) -- node[above] {\small{1}} ++(t1a);
\draw (t1) -- node[above] {\small{2}} ++(t2a);
\draw (t3a) -- node[above] {\small{3}} ++(t1);
\draw (t2a) -- node[above] {\small{1}} ++(t2b);
\draw (t3a) -- node[above] {\small{1}} ++(t3b);
\draw (t3a) -- node[above] {\small{2}} ++(t4a);
\draw (t4a) -- node[above] {\small{1}} ++(t4b);
% Third node
\draw (v1) -- node[above] {\small{1}} ++(v1a);
\draw (v1) -- node[above] {\small{2}} ++(v2a);
\draw (v3a) -- node[above] {\small{3}} ++(v1);
\draw (v4a) -- node[above] {\small{2}} ++(v3a);
\draw (r) -- node[above] {\small{4}} ++(t1);
\draw[->, thick] (v1) -- node[above] {\small{5}} ++(t1);
% \draw (t1) -- node[above] {\small{3}} ++(t2a);
% \draw (t1) -- node[above] {\small{2}} ++(t2b);
\end{tikzpicture}
\end{document}\documentclass[tikz]{standalone}
\tikzset{near start abs/.style={xshift=1cm}}
\usetikzlibrary{positioning}
\begin{document}
\begin{tikzpicture}[node distance=1.5cm]
% place nodes
\node[circle,draw=black, fill=white, inner sep=0pt,minimum size=10pt] (r) {};
\node[circle,draw=black, fill=white, inner sep=0pt,right of=r, minimum size=10pt] (r1a) {};
\node[circle,draw=black, fill=white, inner sep=0pt,above right of=r, minimum size=10pt] (r2a) {};
\node[circle,draw=black, fill=white, inner sep=0pt,right of=r2a, minimum size=10pt] (r2b) {};
\node[circle,draw=black, fill=white, inner sep=0pt,above of=r2a, minimum size=10pt] (r3a) {};
\node[circle,draw=black, fill=white, inner sep=0pt,right of=r3a, minimum size=10pt] (r3b) {};
\node[circle,draw=black, fill=white, inner sep=0pt,above right of=r3a, minimum size=10pt] (r4a) {};
\draw (r) -- node[above] {\small{1}} ++(r1a);
\draw (r) -- node[above] {\small{2}} ++(r2a);
\draw[->,thick] (r3a) -- node[above] {\small{3}} ++(r);
\draw (r2a) -- node[above] {\small{1}} ++(r2b);
\draw[<-,thick] (r3a) -- node[above] {\small{1}} ++(r3b);
\draw[<-,thick] (r3a) -- node[above] {\small{2}} ++(r4a);
\end{tikzpicture}
\end{document}\documentclass{standalone}
\usepackage{pgfplots}
\pgfplotsset{compat=newest}
%% the following commands are needed for some matlab2tikz features
\usetikzlibrary{plotmarks}
\usetikzlibrary{arrows.meta}
\usepgfplotslibrary{patchplots}
\usepackage{grffile}
\usepackage{amsmath}
%% you may also want the following commands
%\pgfplotsset{plot coordinates/math parser=false}
%\newlength\figureheight
%\newlength\figurewidth
\definecolor{mycolor1}{rgb}{0.00000,0.44700,0.74100}
\begin{document}
\begin{tikzpicture}
\begin{axis}[%
width=3.055in,
height=3.17in,
at={(0.524in,0.428in)},
scale only axis,
xmin=-100000000000,
xmax=100000000000,
tick align=outside,
ymin=-100000000000,
ymax=100000000000,
zmin=-100000000000,
zmax=100000000000,
view={-37.5}{30},
axis background/.style={fill=white},
axis x line*=bottom,
axis y line*=left,
axis z line*=left,
xmajorgrids,
ymajorgrids,
zmajorgrids,
legend style={at={(1.03,1)}, anchor=north west, legend cell align=left, align=left, draw=white!15!black}
]
\addplot3[scatter, only marks, mark=o, color=mycolor1, mark options={}, scatter/use mapped color=mycolor1, visualization depends on={\thisrow{size} \as \perpointmarksize}, scatter/@pre marker code/.append style={/tikz/mark size=\perpointmarksize}] table[row sep=crcr]{%
x y z size\\
-100000000000 -100000000000 -100000000000 2.53722289127305\\
-100000000000 -100000000000 0 2.53722289127305\\
-100000000000 -100000000000 100000000000 2.51246890528022\\
-100000000000 0 -100000000000 2.52487623459052\\
-100000000000 0 0 2.52487623459052\\
-100000000000 0 100000000000 2.5\\
-100000000000 100000000000 -100000000000 2.51246890528022\\
-100000000000 100000000000 0 2.53722289127305\\
-100000000000 100000000000 100000000000 2.52487623459052\\
0 -100000000000 -100000000000 2.52487623459052\\
0 -100000000000 0 2.52487623459052\\
0 -100000000000 100000000000 2.51246890528022\\
0 0 -100000000000 2.51246890528022\\
0 0 0 5.59016994374947\\
0 0 100000000000 2.51246890528022\\
0 100000000000 -100000000000 2.51246890528022\\
0 100000000000 0 2.51246890528022\\
0 100000000000 100000000000 2.52487623459052\\
100000000000 -100000000000 -100000000000 2.52487623459052\\
100000000000 -100000000000 0 2.51246890528022\\
100000000000 -100000000000 100000000000 2.52487623459052\\
100000000000 0 -100000000000 2.53722289127305\\
100000000000 0 0 2.51246890528022\\
100000000000 0 100000000000 2.52487623459052\\
100000000000 100000000000 -100000000000 2.52487623459052\\
100000000000 100000000000 0 2.52487623459052\\
100000000000 100000000000 100000000000 2.51246890528022\\
};
\end{axis}
\end{tikzpicture}
\end{document}
\documentclass{standalone}

  \usepackage{pgfplots}
  \pgfplotsset{compat=newest}
  %% the following commands are needed for some matlab2tikz features
  \usetikzlibrary{plotmarks}
  \usetikzlibrary{arrows.meta}
  \usepgfplotslibrary{patchplots}
  \usepackage{grffile}
  \usepackage{amsmath}

  %% you may also want the following commands
  %\pgfplotsset{plot coordinates/math parser=false}
  %\newlength\figureheight
  %\newlength\figurewidth
\definecolor{mycolor1}{rgb}{0.00000,0.44700,0.74100}
\begin{document}

% This file was created by matlab2tikz.
%
%The latest updates can be retrieved from
%  http://www.mathworks.com/matlabcentral/fileexchange/22022-matlab2tikz-matlab2tikz
%where you can also make suggestions and rate matlab2tikz.
%
\definecolor{mycolor1}{rgb}{0.00000,0.44700,0.74100}%
%
\begin{tikzpicture}

\begin{axis}[%
width=2.853in,
height=3.04in,
at={(0.528in,0.41in)},
scale only axis,
xmin=0,
xmax=1500000000000,
tick align=outside,
xlabel style={font=\color{white!15!black}},
xlabel={x},
ymin=-400000000,
ymax=0,
ylabel style={font=\color{white!15!black}},
ylabel={y},
zmin=-1,
zmax=1,
zlabel style={font=\color{white!15!black}},
zlabel={z},
view={-37.5}{30},
axis background/.style={fill=white},
title style={font=\bfseries},
title={Initial State for Bodies},
axis x line*=bottom,
axis y line*=left,
axis z line*=left,
xmajorgrids,
ymajorgrids,
zmajorgrids,
legend style={at={(1.03,1)}, anchor=north west, legend cell align=left, align=left, draw=white!15!black}
]
\addplot3[scatter, only marks, mark=o, color=mycolor1, mark options={}, scatter/use mapped color=mycolor1, visualization depends on={\thisrow{size} \as \perpointmarksize}, scatter/@pre marker code/.append style={/tikz/mark size=\perpointmarksize}] table[row sep=crcr]{%
x	y	z	size\\
0	0	0	5.59016994374947\\
57910000000	0	0	2.51246890528022\\
108200000000	0	0	2.51246890528022\\
149600000000	0	0	2.51246890528022\\
149600000000	-363300000	0	2.5\\
227920000000	0	0	2.51246890528022\\
778500000000	0	0	2.51246890528022\\
1352550000000	0	0	2.51246890528022\\
};

\end{axis}
\end{tikzpicture}%
\end{document}\documentclass[varwidth]{standalone}
\usepackage{tikz}
\usetikzlibrary{positioning}
\usetikzlibrary{chains}
\usetikzlibrary{shapes.multipart}
\begin{document}
\newlength\nodewidth
\setlength\nodewidth{120mm}
\begin{tikzpicture}
\tikzset{every node/.style={rectangle split, draw, rotate=90}, rectangle split parts=10}
\node[rectangle split, minimum width= 1.2cm,
minimum height = 1cm] {};
\end{tikzpicture}
\end{document}\documentclass[tikz]{standalone}
\usetikzlibrary{arrows,chains,positioning,scopes,quotes,bending,calc}
\tikzset{
edge/.style={draw,text width=8em,minimum height=1em,align=center,fill=blue!30},
blade/.style={draw,text width=1em,minimum height=5em,align=center,fill=red!30},
switch/.style={draw,text width=4em,minimum height=3em,align=center,fill=yellow!30},
arrow/.style={->}
}
\begin{document}
\begin{tikzpicture}[>=stealth']
% Direction Switches
{[start chain]
\node[switch,on chain] (M0) {Direction Switch};
\node[switch,on chain,right=3cm of M0] (M1) {Direction Switch 2};
}
% Edge switches
{[start chain]
\node[edge,on chain,below left=2cm and 0.25cm of M0] (N0) {Edge Switch 1};
\node[edge,on chain,right=1cm of N0] (N1) {Edge Switch 2};
%\node[block,on chain,join=by {arrow},right=1cm of N1] (N2) {N2};
\node[on chain,right=1cm of N1] (N2) {$\cdots$};
\node[edge,on chain,right=1cm of N2] (N3) {Edge Switch 56};
}
% Blade Switches
{[start chain]
\node[blade,on chain, below left=0.7cm and 0.1cm of N0] (B0) {B \\ l \\ a \\ d \\ e \\ 0 \\ 0};
\node[blade,on chain,right=0.25cm of B0] (B1) {B \\ l \\ a \\ d \\ e \\ 0 \\ 1 };
%\node[block,on chain,join=by {arrow},right=1cm of N1] (N2) {N2};
\node[on chain,right=0.25cm of B1] (B2) {$\cdots$};
\node[blade,on chain,right=0.25cm of B2] (B3) {B \\ l \\ a \\ d \\ e \\ 1 \\ 7};
}
% node containing number of blades
\node[below =0.25cm of N0] (L1) {\underline{18}};
% arrows from blade to edge
\draw [->] (B0.north) -- (N0);
\draw [->] (B1.north) -- (N0);
\draw [->] (B3.north) -- (N0);
\draw[red,thick,dotted] ($(B0.north west)+(-0.3,0.1)$) rectangle ($(B3.south east)+(0.3,-0.1)$);
\node [below = 1cm of B2](Lsd0) {\small{chasis 0}};
{[start chain]
\node[blade,on chain, below left=0.7cm and 0.1cm of N1] (C0) {B \\ l \\ a \\ d \\ e \\ 0 \\ 0 };
\node[blade,on chain,right=0.25cm of C0] (C1) {B \\ l \\ a \\ d \\ e \\ 0 \\ 1 };
%\node[block,on chain,join=by {arrow},right=1cm of N1] (N2) {N2};
\node[on chain,right=0.25cm of C1] (C2) {$\cdots$};
\node[blade,on chain,right=0.25cm of C2] (C3) {B \\ l \\ a \\ d \\ e \\ 1 \\ 7};
}
% node containing number of blades
\node[below =0.25cm of N1] (L2) {\underline{18}};
% arrows from blade to edge
\draw [->] (C0.north) -- (N1);
\draw [->] (C1.north) -- (N1);
\draw [->] (C3.north) -- (N1);
% bounding box
\draw[red,thick,dotted] ($(C0.north west)+(-0.3,0.1)$) rectangle ($(C3.south east)+(0.3,-0.1)$);
\node [below = 1cm of C2](Lsd1) {\small{chasis 1}};
{[start chain]
\node[blade,on chain, below left=0.7cm and 0.1cm of N3] (D0) {B \\ l \\ a \\ d \\ e \\ 0 \\ 0};
\node[blade,on chain,right=0.25cm of D0] (D1) {B \\ l \\ a \\ d \\ e \\ 0 \\ 1 };
%\node[block,on chain,join=by {arrow},right=1cm of N1] (N2) {N2};
\node[on chain,right=0.25cm of D1] (D2) {$\cdots$};
\node[blade,on chain,right=0.25cm of D2] (D3) {B \\ l \\ a \\ d \\ e \\ 1 \\ 7};
}
% node containing number of blades
\node[below =0.25cm of N3] (L3) {\underline{18}};
% arrows from blade to edge
\draw [->] (D0.north) -- (N3);
\draw [->] (D1.north) -- (N3);
\draw [->] (D3.north) -- (N3);
% bounding box
\draw[red,thick,dotted] ($(D0.north west)+(-0.3,0.1)$) rectangle ($(D3.south east)+(0.3,-0.1)$);
\node [below = 1cm of D2](Lsd3) {\small{chasis 56}};
% Edge switchs to direction switches arrows
\path (N1.north west) edge[blue,->,bend left=10] node [left] {} (M0);
\path (N1.north west) edge[blue,->,bend left=30] node [left] {} (M0);
\path (N1.north west) edge[blue,->] node [left] {} (M0);
\path (N1.north east) edge[blue,->,bend left=10] node [left] {} (M1);
\path (N1.north east) edge[blue,->,bend left=30] node [left] {} (M1);
\path (N1.north east) edge[blue,->] node [left] {} (M1);
% N1, switch 2
\path (N0.north west) edge[blue,->,bend left=10] node [left] {} (M0);
\path (N0.north west) edge[blue,->,bend left=30] node [left] {} (M0);
\path (N0.north west) edge[blue,->] node [left] {} (M0);
\path (N0.north east) edge[blue,->,bend left=10] node [left] {} (M1);
\path (N0.north east) edge[blue,->,bend left=30] node [left] {} (M1);
\path (N0.north east) edge[blue,->] node [left] {} (M1);
% N3, edge switch 56
\path (N3.north west) edge[blue,->,bend left=20] node [left] {} (M0.east);
\path (N3.north west) edge[blue,->,bend left=40] node [left] {} (M0.east);
\path (N3.north west) edge[blue,->] node [left] {} (M0.east);
\path (N3) edge[blue,->,bend left=20] node [left] {} (M1);
\path (N3) edge[blue,->,bend left=40] node [left] {} (M1);
\path (N3) edge[blue,->] node [left] {} (M1);
\node[above right =0.10cm of N1.north west] (NL1) {\underline{9}};
\node[above =0.25cm of N0.north west] (NL0) {\underline{9}};
\node[above =0.25cm of N0.north west] (NL0) {\underline{9}};
\end{tikzpicture}
\end{document}\documentclass[tikz]{standalone}
\tikzset{near start abs/.style={xshift=1cm}}
\usetikzlibrary{positioning}
\begin{document}
\begin{tikzpicture}[node distance=1.5cm]
% place nodes
\node[circle,draw=black, fill=black, inner sep=0pt,minimum size=10pt] (r) {};
\node[circle,draw=black, fill=white, inner sep=0pt,right of=r, minimum size=10pt] (r1a) {};
\node[circle,draw=black, fill=white, inner sep=0pt,above right of=r, xshift=-0.25cm, minimum size=10pt] (r2a) {};
\node[circle,draw=black, fill=white, inner sep=0pt,above of=r, minimum size=10pt] (r2t) {};
\node[circle,draw=black, fill=white, inner sep=0pt,above right of=r2t, minimum size=10pt] (r3) {};
\node[circle,draw=black, fill=white, inner sep=0pt,above of=r1a, minimum size=10pt] (r2tb) {};
\node[circle,draw=black, fill=white, inner sep=0pt,above right of=r1a, minimum size=10pt] (r2tc) {};
\node[circle,draw=black, fill=white, inner sep=0pt,above right of=r2tb, minimum size=10pt] (r3tb) {};
% Arrows, right subgraph
\draw[->,thick] (r) -- node[above] {\small{1}} ++(r1a);
\draw[->,thick] (r1a) -- node[right] {\small{3}} ++(r2tc);
\draw[->,thick] (r1a) -- node[right] {\small{2}} ++(r2tb);
\draw[->,thick] (r2tb) -- node[right] {\small{3}} ++(r3tb);
% Left subgraph
\draw[->,thick] (r) -- node[right] {\small{3}} ++(r2a);
\draw[->,thick] (r) -- node[right] {\small{2}} ++(r2t);
\draw[->,thick] (r2t) -- node[right] {\small{3}} ++(r3);
\end{tikzpicture}
\end{document}\documentclass{standalone}
\usepackage{tikz}
\usetikzlibrary{arrows,positioning,calc}
\usetikzlibrary{chains}
\usetikzlibrary{shapes.multipart}
\usetikzlibrary{shapes}
\begin{document}
\newsavebox{\task}
\savebox{\task}{%
\begin{tikzpicture}[font=\small,
>=stealth,
]
\tikzset{every node/.style={rectangle split, draw, rotate=90}, rectangle split parts=5}
\node[rectangle split, minimum width= 1.2cm,
minimum height = 1cm] {};
\end{tikzpicture}%
}
\begin{tikzpicture}
{[start chain]
\node[ellipse, start chain, minimum width=90pt, draw] (t1){\usebox{\task}};
\node[ellipse, on chain, right=1cm of t1, draw] (t2) {\usebox{\task}};
%\node[block,on chain,join=by {arrow},right=1cm of N1] (N2) {N2};
\node[ellipse,on chain,right=1cm of t2, draw] (t3) {\usebox{\task}};
\node[ellipse,on chain, right=1cm of t3] (t4) {$\cdots$};
\node[ellipse,on chain,right=1cm of t4, draw] (t5) {\usebox{\task}};
}
% Arrows
\path (t1) edge[very thick,->,bend left=30] node [left] {} (t2);
\path (t2) edge[very thick,->,bend left=30] node [left] {} (t3);
\path (t3) edge[very thick, ->,bend left=30] node [left] {} (t4);
\path (t4) edge[very thick, ->,bend left=30] node [left] {} (t5);
% Arrows
\path (t5) edge[very thick, ->,bend left=30] node [left] {} (t4);
\path (t4) edge[very thick, ->,bend left=30] node [left] {} (t3);
\path (t3) edge[very thick, ->,bend left=30] node [left] {} (t2);
\path (t2) edge[very thick, ->,bend left=30] node [left] {} (t1);
\end{tikzpicture}
\end{document}\documentclass{standalone}
\usepackage{tikz}
\usetikzlibrary{arrows,positioning,calc}
\usetikzlibrary{chains}
\usetikzlibrary{shapes.multipart}
\usetikzlibrary{shapes}
\begin{document}
\newsavebox{\task}
\savebox{\task}{%
\begin{tikzpicture}[font=\small,
>=stealth,
]
\tikzset{every node/.style={rectangle split, draw, rotate=90}, rectangle split parts=5}
\node[rectangle split, minimum width= 1.2cm,
minimum height = 1cm] {};
\end{tikzpicture}%
}
\begin{tikzpicture}
{[start chain]
\node[circle, start chain, draw] (t1){t[0]};
\node[circle, on chain, right=1cm of t1, draw] (t2) {t[1]};
%\node[block,on chain,join=by {arrow},right=1cm of N1] (N2) {N2};
\node[circle,on chain,right=1cm of t2, draw] (t3) {t[2]};
\node[circle,on chain, right=1cm of t3] (t4) {$\cdots$};
\node[circle,on chain,right=1cm of t4, draw] (t5) {t[3]};
}
% Arrows
\path (t1) edge[very thick,->,bend left=30] node [left] {} (t2);
\path (t2) edge[very thick,->,bend left=30] node [left] {} (t3);
\path (t3) edge[very thick, ->,bend left=30] node [left] {} (t4);
\path (t4) edge[very thick, ->,bend left=30] node [left] {} (t5);
% Arrows
\path (t5) edge[very thick, ->,bend left=30] node [left] {} (t4);
\path (t4) edge[very thick, ->,bend left=30] node [left] {} (t3);
\path (t3) edge[very thick, ->,bend left=30] node [left] {} (t2);
\path (t2) edge[very thick, ->,bend left=30] node [left] {} (t1);
\end{tikzpicture}
\end{document}\documentclass{article}
\usepackage[T1]{fontenc}
\usepackage{lmodern}
\usepackage{url}
\DeclareUrlCommand\function{\urlstyle{sf}}
\usepackage{xcolor}
\usepackage{tikz}
\usepackage{booktabs}
\usepackage{array}
\usepackage{multirow}
\usepackage{siunitx}
\definecolor{chart Idle}{gray}{.6}
\definecolor{chart Poor}{RGB}{242,28,28}
\definecolor{chart Ok}{RGB}{248,172,37}
\definecolor{chart Ideal}{RGB}{1,151,0}
\definecolor{chart Over}{RGB}{0,125,234}
\newdimen\tempdim
\newcommand*{\Triangle}{%
\settoheight{\tempdim}{L}%
\tikz[x=\tempdim, y=\tempdim]\draw(0,0) -- (.5,.5) -- (0,1) --cycle;%
}
\newcommand*{\ChartLegend}[1]{%
\ifdim\lastkern=1sp %
\hspace{1em}%
\fi
\ChartBox{0.75em}{#1}%
\,#1%
\kern-1sp\kern1sp\ignorespaces
}
\newcommand*{\ChartBox}[2]{%
\begingroup
\settoheight{\tempdim}{L}%
\edef\tempheight{\the\tempdim}%
\settodepth{\tempdim}{g}%
\edef\tempdepth{\the\tempdim}%
\tikz[
baseline=0pt,
inner sep=0pt,
]
\node[
fill={chart #2},
draw,
rounded corners=1pt,
anchor=base,
]{%
\vphantom{g\"A}%
\pgfmathsetlength{\tempdim}{#1}%
\kern\tempdim\relax
};%
\endgroup
}
\begin{document}
\sffamily
\renewcommand*{\arraystretch}{1.2}
\newcommand*{\chart}[2]{%
#1 & \ChartBox{55mm/3.420*#1}{#2}%
}
\noindent
\begin{tabular}{>{\Triangle\,}lS[mode=text,detect-family,table-format=1.3]@{\,s~}l}
\toprule
\multicolumn{1}{c}{%
\multirow{2}{*}{Source Function\,/\,Function\,/\,Call Stack}%
}&
\multicolumn{2}{c}{CPU Time by Utilization}\\
\multicolumn{1}{c}{}& \multicolumn{2}{l}{%
\ChartLegend{Idle}
\ChartLegend{Poor}
\ChartLegend{Ok}
\ChartLegend{Ideal}
\ChartLegend{Over}
}\\
\midrule
\relax[Loop at line 151 in \function{divergence_part_1}] &
\chart{3.420}{Poor} \\
\relax[Loop at line 1071 in \function{radiation_fvm}] &
\chart{3.270}{Poor} \\
\function{scalar_face_value} &
\chart{3.090}{Poor} \\
\relax[Loop at line 102 in \function{get_match}] &
\chart{1.700}{Poor} \\
\function{get_sensible_enthalpy_diff} &
\chart{1.250}{Poor} \\
\function{compare_vec3} &
\chart{1.140}{Poor} \\
\bottomrule
\end{tabular}
\end{document}% Preamble: \
\documentclass{standalone}
\usepackage{pgfplots}
\usepackage{tikz}
\pgfplotsset{width=7cm,compat=1.16}
\usepackage{color}
\definecolor{mypink1}{rgb}{0.858, 0.188, 0.478}
\definecolor{blacktext}{HTML}{000000}
\definecolor{mainnet}{HTML}{29B6AF}
\definecolor{kovan}{HTML}{7057ff}
\definecolor{rinkeby}{HTML}{F6C343}
\definecolor{ropsten}{HTML}{FF4A8D}
\begin{document}
\begin{tikzpicture}
\begin{axis}[
x tick label style={
/pgf/number format/1000 sep=},
%xlabel=Smart Contracts,
ylabel=Gas Limits (Units),
%enlargelimits=0.15,
%legend style={cells={align=left}}
legend style={at={(0.4,-0.30)},
anchor=north,legend columns=3,cells={align=left}},
ybar,
bar width=7pt,
ytick={0,1.25e6,2.5e6,3.75e6,5e6, 6.25e6,7.5e6, 8.75e6,10e6},
ymin = 0,
ymax = 9.75e6,
xticklabels={ERC20,ERC721,StoreFront,Registry,Deployer},xtick={1930,1940,1950,1960,1970},
x tick label style={rotate=35,anchor=east}]
]
\addplot coordinates {
(1930,28e5) (1940,26e5)
(1950,49e5) (1960,59e5) (1970,0)
};
\addplot coordinates {
(1930,26e5) (1940,24e5)
(1950,41e5) (1960,46e5) (1970,0)
};
\addplot coordinates {
(1930,28e5) (1940,26e5)
(1950,25e5) (1960,36e5) (1970,28e5)
};
\addplot [dashed, mainnet,line legend,
sharp plot,update limits=false,
] coordinates { (1910,80e5) (1950,80e5) }
node [above] at (1950,80e5) {\textcolor{mainnet}{Mainnet} \textcolor{blacktext}{and} \textcolor{kovan}{Kovan}};
\addplot [dashed,kovan,line legend,
sharp plot,update limits=false,
] coordinates { (1950,80e5) (1980,80e5) };
\addplot [dashed, ropsten,line legend,
sharp plot,update limits=false,
] coordinates { (1920,47e5) (1990,47e5) }
node [above,align=left] at (1940,47e5) {\textcolor{ropsten}{Ropsten} \\ \textcolor{ropsten}{(July 27)}};
\addplot [dashed, ropsten,line legend,
sharp plot,update limits=false,
] coordinates { (1910,94.8e5) (1990,94.8e5) }
node [below] at (1950,100.5e5) {\textcolor{ropsten}{Ropsten} \textcolor{ropsten} (July 29)};
\addplot [ dashed, rinkeby,line legend,
sharp plot,update limits=false,
] coordinates { (1910,76e5) (1990,76e5) }
node [below] at (1960,76e5) {\textcolor{rinkeby}{Rinkeby}};
\legend{Original, Finding \\ Efficiencies, Using \\ Deployer}
\end{axis}
\end{tikzpicture}
\end{document}
% Mainnet 8 mil 8000029
% Kovan 8 mil
% Rinkeby 7.6 mil
% Ropsten 4.7 mil July 27
% Renting out processing power to increase limits
% Ropsten 9.48 mil July 29
% Do unoptimizated
StoreFront Deployment costs
Gas Price is 20000000000 wei
gas estimation = 4924865 units
gas cost estimation = 98497300000000000 wei
gas cost estimation = 0.0984973 ether
HarvestSFRegistry Deployment cost.
Gas Price is 20000000000 wei
gas estimation = 5885566 units
gas cost estimation = 117711320000000000 wei
gas cost estimation = 0.11771132 ether
RewardToken Deployment cost.
Gas Price is 20000000000 wei
gas estimation = 2583571 units
gas cost estimation = 51671420000000000 wei
gas cost estimation = 0.05167142 ether
HarvestToken Deployment cost.
Gas Price is 20000000000 wei
gas estimation = 2780371 units
gas cost estimation = 55607420000000000 wei
gas cost estimation = 0.05560742 ether
% Opt by removing functionality
StoreFront Deployment costs
Gas Price is 20000000000 wei
gas estimation = 4154023 units
gas cost estimation = 98497300000000000 wei
gas cost estimation = 0.0984973 ether
HarvestSFRegistry Deployment cost.
Gas Price is 20000000000 wei
gas estimation = 4602312 units
gas cost estimation = 117711320000000000 wei
gas cost estimation = 0.11771132 ether
RewardToken Deployment cost.
Gas Price is 20000000000 wei
gas estimation = 2580571 units
gas cost estimation = 51671420000000000 wei
gas cost estimation = 0.05167142 ether
HarvestToken Deployment cost.
Gas Price is 20000000000 wei
gas estimation = 2750371 units
gas cost estimation = 55607420000000000 wei
gas cost estimation = 0.05560742 ether
% Optimizated by deployer
StoreFront Deployment costs
Gas Price is 20000000000 wei
gas estimation = 2154023 units
gas cost estimation = 98497300000000000 wei
gas cost estimation = 0.0984973 ether
HarvestSFRegistry Deployment cost.
Gas Price is 20000000000 wei
gas estimation = 2902312 units
gas cost estimation = 117711320000000000 wei
gas cost estimation = 0.11771132 ether
RewardToken Deployment cost.
Gas Price is 20000000000 wei
gas estimation = 2583571 units
gas cost estimation = 51671420000000000 wei
gas cost estimation = 0.05167142 ether
HarvestToken Deployment cost.
Gas Price is 20000000000 wei
gas estimation = 2750371 units
gas cost estimation = 55607420000000000 wei
gas cost estimation = 0.05560742 ether
Deployer 721 Cost
2825921 gas uints
% Using deployer\documentclass[border=3mm]{standalone}
\usepackage{tikz}
\usetikzlibrary{backgrounds,shadows,positioning,fit,matrix,shapes.geometric, shapes.arrows} % add shadows #1
% a way to cut shadows in a cell #2
%https://tex.stackexchange.com/questions/129318/remove-drop-shadow-from-one-node
\makeatletter
\tikzset{no shadows/.code=\let\tikz@preactions\pgfutil@empty}
\makeatother
\tikzset{background/.style={rectangle, fill=red!10, inner sep=0.2cm},
backgroundN/.style={rectangle, fill=white, inner sep=0.3cm},
backgroundNN/.style={rectangle, fill=red!10, inner sep=0.2cm}}
\tikzset{back/.style={rectangle, fill=blue!10, inner sep=0.2cm},
backgroundN/.style={rectangle, fill=white, inner sep=0.3cm},
backgroundNN/.style={rectangle, fill=red!10, inner sep=0.2cm}}
\definecolor{mybluei}{RGB}{124,156,205}
\definecolor{myblueii}{RGB}{73,121,193}
\definecolor{mygreen}{RGB}{202,217,126}
\definecolor{mypink}{RGB}{233,198,235}
\definecolor{antiquefuchsia}{rgb}{0.57, 0.36, 0.51}
\definecolor{byzantium}{rgb}{0.44, 0.16, 0.39}
\definecolor{darkcandyapplered}{rgb}{0.64, 0.0, 0.0}
\definecolor{darkbyzantium}{rgb}{0.36, 0.22, 0.33}
\definecolor{jasper}{rgb}{0.84, 0.23, 0.24}
\definecolor{pastelred}{rgb}{1.0, 0.41, 0.38}
\definecolor{pinkpearl}{rgb}{0.91, 0.67, 0.81}
\definecolor{blue(pigment)}{rgb}{0.2, 0.2, 0.6}
\newcommand\widernode[5][widebox]{
\node[
#1,
fit={(#2) (#3)},
label=center:{\sffamily\bfseries\color{black}#4}] (#5) {};
}
\begin{document}
\begin{tikzpicture}[node distance=2pt,outer sep=0pt, % just do nothing after modification
boxstyle/.style={
draw=white,
fill=#1,
rounded corners, drop shadow, %to get a shadow in below a node
font={\sffamily\bfseries\color{white}},
align=center,
minimum height=30pt
},
box/.style={
boxstyle=#1,
text width=2.5cm},
box/.default=mybluei,
title/.style={font={\sffamily\bfseries\color{black}}},
widebox/.style={draw=white,inner sep=0pt, rounded corners,fill=#1,drop shadow},
widebox/.default=mybluei,
mylabel/.style={font={\sffamily\bfseries\color{black}}},
database/.style={
cylinder,
cylinder uses custom fill,
cylinder body fill=yellow!50,
cylinder end fill=yellow!50,
shape border rotate=90,
aspect=0.25,
draw
}
]
\matrix (stack) [% boxstyle=mybluei!40,%will overpaint blocks with background
column sep=10pt, row sep=10pt, inner sep=4mm,%
matrix of nodes,
nodes={box, outer sep=0pt, anchor=center, inner sep=3pt},%
nodes in empty cells=false,% #3
row 1/.style={nodes={fill=none,draw=none,minimum height=3mm}},
]
{
|[no shadows]| & & & [1cm] & & |[no shadows]| \\ % #5
%RCP main & Authoring & Browsing & Publishing & Search&|[no shadows]| \\
|[no shadows]| & & |[no shadows]| & |[no shadows]|& &|[no shadows]| \\
|[box=byzantium]| ERC20 Deployer & |[box=byzantium]| Harvest Registry & |[box=byzantium]| ERC721 Deployer &|[no shadows]| & |[no shadows]|& |[box=blue(pigment)]| Web3 \\
|[box=byzantium]| Exchanger & |[no shadows]| &|[no shadows]| & |[no shadows]| &|[no shadows]| & |[box=blue(pigment)]| Truffle \\
|[box=byzantium]| ERC20 & |[no shadows]| & |[no shadows]| & |[no shadows]| & |[no shadows]| & |[box=blue(pigment)]| React \\};
\widernode[]{stack-1-1}{stack-1-6}{Harvest Architecture}{EPF} %#5
\widernode[widebox=mygreen]{stack-2-1}{stack-2-3}{Smart Contracts in Solidity}{SM}
\widernode[widebox=pastelred]{stack-2-4}{stack-2-6}{Front End Libraries and Tools in Javascript}{FE}
\widernode{stack-3-4}{stack-3-5}{Metamask}{MM}
% \widernode{stack-3-6}{stack-3-6}{Web3}{AA}
\widernode{stack-4-4}{stack-4-5}{Webpack}{BB}
% \widernode{stack-4-6}{stack-4-6}{Truffle}{CC}
\widernode{stack-5-4}{stack-5-5}{Drizzle}{DC}
% \widernode{stack-5-6}{stack-5-6}{React}{MC23}
%\widernode[widebox=pinkpearl]{stack-4-1}{stack-4-1}{Exchanger}{UMA23}
\widernode[widebox=pinkpearl]{stack-4-2}{stack-4-3}{StoreFront}{UMA}
%\widernode{stack-4-4}{stack-4-5}{Export/Import}{ExImp}
\widernode[widebox=pinkpearl]{stack-5-2}{stack-5-3}{ERC721}{EMF}
%\widernode[widebox=mygreen]{stack-6-1}{stack-6-5}{RCP Runtime}{RCPrun}
% \widernode[widebox, text width=1.5cm, align=center]{stack-2-6}{stack-3-6}{Normal text works}{NTWorks}
%
%\node [fit={(stack.south west)(stack.south east)},boxstyle=myblueii,draw=black,inner sep=0pt,below=3pt of stack.south,anchor=north,label={[mylabel]center:Java Runtime}] (JavaR) {};
%
%
%
\begin{pgfonlayer}{background}
\coordinate (aux) at ([xshift=1mm]stack-5-6.east);
\node [back,
fit=(stack-1-1) (stack-5-1) (aux), draw, drop shadow,
] {};
%\node [backgroundN,
% fit=(stack-3-5) ] {};
%\node [backgroundNN,draw, drop shadow,
% fit=(stack-3-5) ] {};
\end{pgfonlayer}
% % smth to create an arbitrary block with a border and shadow
%Background for smart contracts
\begin{pgfonlayer}{background}
\coordinate (aux) at ([xshift=1mm]stack-5-3.east);
\node [background,
fit=(stack-2-1) (stack-5-1) (aux), draw, drop shadow,
] {};
%\node [backgroundN,
% fit=(stack-3-5) ] {};
%\node [backgroundNN,draw, drop shadow,
% fit=(stack-3-5) ] {};
\end{pgfonlayer}
\begin{pgfonlayer}{background}
\coordinate (aux) at ([xshift=1mm]stack-5-6.east);
\node [background,
fit=(stack-2-4) (stack-5-4) (aux), draw, drop shadow,
] {};
%\node [backgroundN,
% fit=(stack-3-5) ] {};
%\node [backgroundNN,draw, drop shadow,
% fit=(stack-3-5) ] {};
\end{pgfonlayer}
\end{tikzpicture}
\end{document}\documentclass[border=3mm]{standalone}
\usepackage{tikz}
\usetikzlibrary{backgrounds,shadows,positioning,fit,matrix,shapes.geometric, shapes.arrows} % add shadows #1
% a way to cut shadows in a cell #2
%https://tex.stackexchange.com/questions/129318/remove-drop-shadow-from-one-node
\makeatletter
\tikzset{no shadows/.code=\let\tikz@preactions\pgfutil@empty}
\makeatother
\tikzset{background/.style={rectangle, fill=red!10, inner sep=0.2cm},
backgroundN/.style={rectangle, fill=white, inner sep=0.3cm},
backgroundNN/.style={rectangle, fill=red!10, inner sep=0.2cm}}
\tikzset{back/.style={rectangle, fill=blue!10, inner sep=0.2cm},
backgroundN/.style={rectangle, fill=white, inner sep=0.3cm},
backgroundNN/.style={rectangle, fill=red!10, inner sep=0.2cm}}
\definecolor{mybluei}{RGB}{124,156,205}
\definecolor{myblueii}{RGB}{73,121,193}
\definecolor{mygreen}{RGB}{202,217,126}
\definecolor{mypink}{RGB}{233,198,235}
\definecolor{rinkeby}{HTML}{F6C343}
\definecolor{kovan}{HTML}{7057ff}
\definecolor{ropsten}{HTML}{FF4A8D}
\definecolor{mainnet}{HTML}{29B6AF}
\definecolor{antiquefuchsia}{rgb}{0.57, 0.36, 0.51}
\definecolor{byzantium}{rgb}{0.44, 0.16, 0.39}
\definecolor{darkcandyapplered}{rgb}{0.64, 0.0, 0.0}
\definecolor{darkbyzantium}{rgb}{0.36, 0.22, 0.33}
\definecolor{jasper}{rgb}{0.84, 0.23, 0.24}
\definecolor{pastelred}{rgb}{1.0, 0.41, 0.38}
\definecolor{pinkpearl}{rgb}{0.91, 0.67, 0.81}
\definecolor{blue(pigment)}{rgb}{0.2, 0.2, 0.6}
\newcommand\widernode[5][widebox]{
\node[
#1,
fit={(#2) (#3)},
label=center:{\sffamily\bfseries\color{black}#4}] (#5) {};
}
\begin{document}
\begin{tikzpicture}[node distance=2pt,outer sep=0pt, % just do nothing after modification
boxstyle/.style={
draw=white,
fill=#1,
rounded corners, drop shadow, %to get a shadow in below a node
font={\sffamily\bfseries\color{white}},
align=center,
minimum height=30pt
},
box/.style={
boxstyle=#1,
text width=2.5cm},
box/.default=mybluei,
title/.style={font={\sffamily\bfseries\color{black}}},
widebox/.style={draw=white,inner sep=0pt, rounded corners,fill=#1,drop shadow},
widebox/.default=mybluei,
mylabel/.style={font={\sffamily\bfseries\color{black}}},
database/.style={
cylinder,
cylinder uses custom fill,
cylinder body fill=yellow!50,
cylinder end fill=yellow!50,
shape border rotate=90,
aspect=0.25,
draw
}
]
\matrix (stack) [% boxstyle=mybluei!40,%will overpaint blocks with background
column sep=10pt, row sep=10pt, inner sep=4mm,%
matrix of nodes,
nodes={box, outer sep=0pt, anchor=center, inner sep=3pt},%
nodes in empty cells=false,% #3
row 1/.style={nodes={fill=none,draw=none,minimum height=3mm}},
]
{
|[no shadows]| & & & [1cm] & & |[no shadows]| \\ % #5
%RCP main & Authoring & Browsing & Publishing & Search&|[no shadows]| \\
|[no shadows]| & & |[no shadows]| & |[no shadows]|& &|[no shadows]| \\
|[no shadows]| & |[no shadows]| & |[no shadows]| &|[no shadows]| & |[no shadows]|& |[box=blue(pigment)]| Web3 \\
|[no shadows]|& |[no shadows]| &|[no shadows]| & |[no shadows]| &|[no shadows]| & |[box=blue(pigment)]| Truffle \\
||[no shadows]| & |[no shadows]| & |[no shadows]| & |[no shadows]| & |[no shadows]| & |[box=blue(pigment)]| React \\};
\widernode[]{stack-1-1}{stack-1-6}{Harvest Architecture}{EPF} %#5
\widernode[widebox=mygreen]{stack-2-1}{stack-2-3}{Blockchain Stack}{SM}
\widernode[widebox=pastelred]{stack-2-4}{stack-2-6}{Front End Stack}{FE}
\widernode[widebox=mainnet]{stack-3-1}{stack-3-3}{Etherum}{Ethereum}
\widernode{stack-3-4}{stack-3-5}{Metamask}{MM}
% \widernode{stack-3-6}{stack-3-6}{Web3}{AA}
\widernode[widebox=rinkeby]{stack-4-1}{stack-4-3}{Solidity}{Solidity}
\widernode{stack-4-4}{stack-4-5}{Webpack}{BB}
% \widernode{stack-4-6}{stack-4-6}{Truffle}{CC}
\widernode[widebox=kovan]{stack-5-1}{stack-5-3}{IPFS}{IPFS}
\widernode{stack-5-4}{stack-5-5}{Drizzle}{DC}
% \widernode{stack-5-6}{stack-5-6}{React}{MC23}
%\widernode[widebox=pinkpearl]{stack-4-1}{stack-4-1}{Exchanger}{UMA23}
%\widernode[widebox=pinkpearl]{stack-4-2}{stack-4-3}{StoreFront}{UMA}
%\widernode{stack-4-4}{stack-4-5}{Export/Import}{ExImp}
%\widernode[widebox=pinkpearl]{stack-5-2}{stack-5-3}{ERC721}{EMF}
%\widernode[widebox=mygreen]{stack-6-1}{stack-6-5}{RCP Runtime}{RCPrun}
% \widernode[widebox, text width=1.5cm, align=center]{stack-2-6}{stack-3-6}{Normal text works}{NTWorks}
%
%\node [fit={(stack.south west)(stack.south east)},boxstyle=myblueii,draw=black,inner sep=0pt,below=3pt of stack.south,anchor=north,label={[mylabel]center:Java Runtime}] (JavaR) {};
%
%
%
\begin{pgfonlayer}{background}
\coordinate (aux) at ([xshift=1mm]stack-5-6.east);
\node [back,
fit=(stack-1-1) (stack-5-1) (aux), draw, drop shadow,
] {};
%\node [backgroundN,
% fit=(stack-3-5) ] {};
%\node [backgroundNN,draw, drop shadow,
% fit=(stack-3-5) ] {};
\end{pgfonlayer}
% % smth to create an arbitrary block with a border and shadow
%Background for smart contracts
\begin{pgfonlayer}{background}
\coordinate (aux) at ([xshift=1mm]stack-5-3.east);
\node [background,
fit=(stack-2-1) (stack-5-1) (aux), draw, drop shadow,
] {};
%\node [backgroundN,
% fit=(stack-3-5) ] {};
%\node [backgroundNN,draw, drop shadow,
% fit=(stack-3-5) ] {};
\end{pgfonlayer}
\begin{pgfonlayer}{background}
\coordinate (aux) at ([xshift=1mm]stack-5-6.east);
\node [background,
fit=(stack-2-4) (stack-5-4) (aux), draw, drop shadow,
] {};
%\node [backgroundN,
% fit=(stack-3-5) ] {};
%\node [backgroundNN,draw, drop shadow,
% fit=(stack-3-5) ] {};
\end{pgfonlayer}
\end{tikzpicture}
\end{document}\documentclass[border=5pt]{standalone}
\usepackage{fontawesome}
\usepackage{tikz}
\usetikzlibrary{matrix, positioning}
\definecolor{bluei}{RGB}{83,116,191}
\definecolor{blueii}{RGB}{207,212,232}
\definecolor{greeni}{RGB}{135,200,81}
\definecolor{greenii}{RGB}{216,235,207}
\definecolor{redi}{RGB}{196,125,82}
\definecolor{redii}{RGB}{234,214,207}
\tikzset{
myiblock/.style 2 args={
draw=white,
fill=#1,
line width=1pt,
rounded corners,
minimum height=1cm,
align=center,
text=white,
font=\sffamily,
text width=#2
},
myoblock/.style={
matrix of nodes,
fill=#1,
rounded corners,
align=center,
inner xsep=10pt,
draw=none,
row sep=0.5cm
},
mylabel/.style={
black,
minimum height=0pt
}
}
\begin{document}
\begin{tikzpicture}
\matrix (A) [myoblock={blueii}, nodes={myiblock={bluei}{3cm}}, row sep=3pt]
{|[label={[mylabel]\faUserSecret \ Personal Info}]|{ Name, Address }\\
Date Of Birth \\
Zip Code\\
};
\matrix (B) [myoblock={greenii}, nodes={myiblock={greeni}{3cm}},
row sep=3pt, right=5mm of A.north east, anchor=north west]
{|[label={[mylabel] \faBank \ Financial Info}]| Credit Score \\
Income \\
SIN Number\\
};
\matrix (C) [myoblock={redii}, nodes={myiblock={redi}{3cm}},
row sep=3pt, right=5mm of B.north east, anchor=north west]
{|[label={[mylabel] \faHome \ Property Info}]| Mortgage Amount \\
Purchase Amount \\
Other Properties \\
};
\end{tikzpicture}
\end{document}\documentclass[tikz,multi,border=10pt]{standalone}
\usepackage{datenumber,xparse}
\usetikzlibrary{arrows.meta,backgrounds}
\newcounter{chronosstartdate}
\newcounter{chronosenddate}
\newcounter{chronosstartyear}
\newcounter{chronosendyear}
\newcounter{chronosyeardate}
\newcounter{chronosthingdate}
\newcounter{chronosotherthingdate}
\pgfkeys{/pgf/number format,
int detect,
set thousands separator={},
}
\tikzset{
chronos/.code={% https://tex.stackexchange.com/a/159856/ - Claudio Fiandrino
\tikzset{%
align=center,
anchor=mid,
/chronos/.cd,
#1
}%
\setstartyear{\chronosstartyear}%
\setmydatenumber{chronosstartdate}{\chronosstartyear}{\chronosstartmonth}{\chronosstartday}%
\setmydatenumber{chronosenddate}{\chronosendyear}{\chronosendmonth}{\chronosendday}%
\pgfmathsetmacro\chronosunit{(\chronoswidth-20pt)/(\thechronosenddate-\thechronosstartdate)}%
\draw [line width=\chronosheight] (-10pt,0) coordinate (chronos pre) -- +(\chronoswidth,0) coordinate (chronos post);
\coordinate (chronos start) at (0,0);
\coordinate (chronos end) at ([xshift=-10pt]chronos post);
\setcounter{chronosstartyear}{\chronosstartyear}%
\setcounter{chronosendyear}{\chronosendyear}%
\def\tempa{01}%
\ifx\chronosstartmonth\tempa
\ifx\chronosstartday\tempa
\else\stepcounter{chronosstartyear}%
\fi
\else\stepcounter{chronosstartyear}%
\fi
\def\tempa{12}%
\def\tempb{31}%
\ifx\chronosendmonth\tempa
\ifx\chronosendday\tempb
\stepcounter{chronosendyear}%
\fi
\fi
\foreach \i in {\thechronosstartyear,...,\thechronosendyear} {%
\setmydatenumber{chronosyeardate}{\i}{01}{01}%
\node [above, anchor=south, yshift=.5*\chronosheight] at ({(\thechronosyeardate-\thechronosstartdate)*\chronosunit pt},0) {\i}; }
},
chronos set date/.code args={#1-#2-#3:#4}{%
\tikzset{%
/chronos/.cd,
#4 year={#1},
#4 month={#2},
#4 day={#3},
}%
\setmydatenumber{chronos#4date}{\csname chronos#4year\endcsname}{\csname chronos#4month\endcsname}{\csname chronos#4day\endcsname}%
},
chronos date/.style args={#1-#2-#3}{%
chronos set date/.expanded={#1-#2-#3:thing}%
},
chronos period date/.style args={#1-#2-#3}{%
chronos set date/.expanded={#1-#2-#3:otherthing}%
},
/chronos/.search also={/tikz},
/chronos/.cd,
start year/.store in=\chronosstartyear,
start month/.store in=\chronosstartmonth,
start day/.store in=\chronosstartday,
end year/.store in=\chronosendyear,
end month/.store in=\chronosendmonth,
end day/.store in=\chronosendday,
thing year/.store in=\chronosthingyear,
thing month/.store in=\chronosthingmonth,
thing day/.store in=\chronosthingday,
otherthing year/.store in=\chronosotherthingyear,
otherthing month/.store in=\chronosotherthingmonth,
otherthing day/.store in=\chronosotherthingday,
start date/.style args={#1-#2-#3}{%
start year={#1},
start month={#2},
start day={#3},
},
end date/.style args={#1-#2-#3}{%
end year={#1},
end month={#2},
end day={#3},
},
width/.store in=\chronoswidth,
height/.store in=\chronosheight,
period/.style={draw=gray},
period event line/.style={draw=gray, -{Triangle[width=1.5pt, reversed, length=.75pt, fill=gray]}},
period event/.style={anchor=north, fill=gray!25, draw=gray, rounded corners, align=center, font=\footnotesize},
event line/.style={draw=gray, -{Triangle[width=1.5pt, reversed, length=.75pt, fill=gray]}},
event/.style={anchor=north, fill=gray!25, draw=gray, rounded corners, align=center, font=\footnotesize},
start date=1001-10-01,
end date=1003-06-14,
width=100mm,
height=1pt,
chronos date=1850-01-01,
chronos period date=1851-01-01,
}
\NewDocumentCommand \chronosevent { O {} m O {} +m D () { -10pt-.5*\chronosheight } }
{%
\scoped[on background layer]{\path [postaction={/chronos/event line, #1}, chronos date/.expanded={#2}] ({(\thechronosthingdate-\thechronosstartdate)*\chronosunit pt},0) -- +(0,#5) node [/chronos/event, #3] {\chronosthingday/\chronosthingmonth/\chronosthingyear\\#4};}
}
\NewDocumentCommand \chronosperiod { O {} m O {} m O {} +m D () { -10pt-.5*\chronosheight } }
{%
\tikzset{%
chronos date/.expanded={#2}, chronos period date/.expanded={#4}
}
\path [postaction={line width=\chronosheight, /chronos/period, #1}] ({(\thechronosthingdate-\thechronosstartdate)*\chronosunit pt},0) -- ({(\thechronosotherthingdate-\thechronosstartdate)*\chronosunit pt},0);
\scoped[on background layer]{\path [postaction={/chronos/period event line, #3}] ({(.5*\thechronosotherthingdate+.5*\thechronosthingdate-\thechronosstartdate)*\chronosunit pt},0) -- +(0,#7) node [/chronos/period event, #5] {\chronosthingday/\chronosthingmonth/\chronosthingyear--\chronosotherthingday/\chronosotherthingmonth/\chronosotherthingyear\\#6};}
}
\begin{document}
\begin{tikzpicture}
[
% yscale = 5,
chronos={%
width=360mm,
height=10pt,
start date=2008-01-01,
end date=2018-05-05,
period/.style={draw=green},
event line/.append style={draw=blue},
period event line/.append style={draw=green},
event/.append style={fill=blue!25, draw=blue, text=blue},
period event/.append style={fill=green!25, draw=green!75!black, text=green!75!black},
}
]
%\chronosperiod [draw=red] {2011-10-10} [draw=red] {2012-01-16} [fill=red!25, draw=red, text=red] {Leave}
%\chronosperiod {2013-03-23} {2014-05-27} {training}
\chronosevent[draw=green] {2008-01-03} [draw=black,fill=green!10, draw=green, text=black]{Bitcoin White Paper}
\chronosevent[draw=green] {2009-01-03} [draw=black,fill=green!10, draw=green, text=black]{Bitcoin “Genesis” Block}
\chronosperiod [draw=red] {2010-08-16} [draw=red] {2013-02-20} [fill=red!25, draw=red, text=red] {Bitcoin popular explodes \\ 1,309 BTC to \$1 USD in 2010 \\ to 1 BTC = \$31 USD in 2013}
\chronosperiod {2013-01-01} [draw=red] {2013-12-31} {Ethereum White paper published \\ Ethereum yellow paper published}
\chronosevent {2015-06-15} {Ethereum \\ “Genesis” \\ Block}
% See https://blog.seedly.sg/cryptocurrency-timeline-beginning-end-everything/
\chronosevent {2015-12-31} {Hyperledger \\ project \\ started.}
\chronosevent {2017-04-04} {Hyperledger Burrow \\ 0.16.0 released}
\chronosevent {2018-04-19} {Amazon Launches \\ AWS BlockChain Templates}
% Researchers published a paper showing that by November 2013 bitcoin commerce was no longer driven by “sin” activities but instead by legitimate enterprises. Uber switched to bitcoin in Argentina after the government blocked credit card companies from dealing with Uber.
%https://hackernoon.com/blockchain-jobs-and-salaries-2018-report-45d3e7741c19
\end{tikzpicture}
\end{document}\documentclass[border=3mm]{standalone}
\usepackage{tikz}
\usetikzlibrary{positioning,matrix,shapes.arrows}
\tikzset{
modulematrix/.style={draw=blue!50!red,rounded corners,matrix of nodes,row sep=1cm,column sep=1cm,nodes={draw=green!70,align=center,font=\sffamily},inner ysep=0.5cm},
module/.style={rounded corners, align=center, font=\sffamily, thick},
simple module/.style={module, top color=blue!10, bottom color=blue!35, draw=blue!75, text width=40mm, minimum height=15mm},
module down arrow/.style={module arrow, shape border rotate=-90},
module right arrow/.style={module arrow},
module arrow/.style={single arrow, single arrow head extend=2.5mm, draw=gray!75, inner color=gray!20, outer color=gray!35, thick, shape border uses incircle, anchor=tail,minimum height=0.7cm},
}
\begin{document}
\begin{tikzpicture}
\node [simple module] (mA) {Module A};
\matrix[modulematrix,below=of mA,label={[anchor=south]below:Module B}] (mB) {Description 1 & Description 2 \\};
\matrix[modulematrix,right=of mB,nodes={text width=5cm,align=center},label={[anchor=north]above:Module C}] (mC) {Description 3 \\ Description 4 \\};
\matrix[modulematrix,below=of mC,label={[anchor=south]below:Module D}] (mD) {Description 5 & Description 6 \\};
\node [simple module,below=of mD] (mE) {Module E};
\foreach \n in {mA,mC-1-1,mC,mD}
\node[module down arrow,below=1mm of \n] {};
\foreach \n in {mB-1-1,mB,mD-1-1}
\node[module right arrow,right=1mm of \n] {};
\end{tikzpicture}
\end{document}
\documentclass[tikz]{standalone}
\usetikzlibrary{shadows,chains,scopes}
\usetikzlibrary{decorations.pathmorphing, shapes}
\begin{document}
\begin{tikzpicture}
  [
    start chain=going right,
    node distance=5mm,
    every on chain/.style={
      thick,
      draw=black,
      top color=white,
      bottom color=yellow!40,
      font=\sffamily\small,
      minimum width=6mm,
      minimum height=6mm,
      %drop shadow,
      %label={below:block \tikzchaincount},
    },
    decoration={coil},
    dna/.style={decorate, thick, decoration={aspect=0, segment length=5cm}},
%    post join/.style={
%      -stealth,
%      line width=1.5mm,
%      red,
%      rounded corners=1mm,
%    },
	square/.style={thick,
	      draw=black,
	      top color=white,
	      bottom color=black!10,
	      font=\sffamily\small,
	      minimum width=12mm,
	      minimum height=10mm,
	      drop shadow},
    every label/.style={
      font=\sffamily\scriptsize
    },
  ]
  \draw[dna, decoration={amplitude=.15cm}] (0,-0) -- (1.1,-0);
  \draw[dna, decoration={amplitude=.35cm}] (1.15,0) -- (1.15,-1.1);
  \draw[dna, decoration={amplitude=.35cm}] (1.15,-1.1) -- (0,-1.1);
  \draw[dna, decoration={amplitude=.35cm}] (0,-1.1) -- (0,0);
%  \draw[dna, decoration={amplitude=.15cm}] (.1,-0) -- (1.5,-0);
%
%  \draw[dna, decoration={amplitude=.15cm}] (2.25,-0) -- (3.65,-0);
%   %\draw[dna, decoration={amplitude=.35cm}] (.9,-0) -- (1.5,-0);
%  \draw[dna, decoration={amplitude=.15cm}] (1.85,-0) -- (3.25,-0);
%
%  \draw[dna, decoration={amplitude=.15cm}] (.5,-2.5) -- (1.9,-2.5);
%  %\draw[dna, decoration={amplitude=.35cm}] (.9,-0) -- (1.5,-0);
%  \draw[dna, decoration={amplitude=.15cm}] (.1,-2.5) -- (1.5,-2.5);
%
%  \draw[dna, decoration={amplitude=.15cm}] (2.25,-2.5) -- (3.65,-2.5);
%   %\draw[dna, decoration={amplitude=.35cm}] (.9,-0) -- (1.5,-0);
%   \draw[dna, decoration={amplitude=.15cm}] (1.85,-2.5) -- (3.25,-2.5);

   %% Path for dots
  \node [on chain] {};
  \node [on chain] {};
  \node [on chain=going below] {};
  {[continue chain=going left]
    \node [on chain] {};
  }
  %\node[square,left of= chain-6] {G};
  {[transparency group, opacity=.25]
%    \draw [post join] (chain-1.south) |- (chain-3.center) |- (chain-6.center) -- (chain-6.north);
  }
 %\path (chain-3.south) -- (chain-4.north) node [black, font=\Huge, midway, sloped,xshift=0cm] {$\dots$};

%\node[] at (1.75,-1.25) { \textsc{BLOCKCHAIN}};
\end{tikzpicture}
\end{document}%\documentclass[class=scrreprt,preview]{standalone}
\documentclass[class=scrreprt,pagesize=off]{standalone}
\usepackage{graphicx}
\usepackage[T1]{fontenc}
\usepackage{tikz}
\usetikzlibrary{calc,positioning,shapes.geometric}
\usetikzlibrary{positioning,matrix,shapes.arrows}
\usetikzlibrary{arrows}
\tikzset{
modulematrix/.style={draw=blue!50,rounded corners,matrix of nodes,row sep=1cm,column sep=2cm,nodes={draw=blue,align=center,font=\sffamily},inner ysep=0.5cm},
module/.style={rounded corners, align=center, font=\sffamily, thick},
simple module/.style={module, top color=blue!10, bottom color=blue!35, draw=blue!75, text width=7.5mm, minimum height=5mm},
module down arrow/.style={module arrow, shape border rotate=-90},
module right arrow/.style={module arrow},
module arrow/.style={single arrow, single arrow head extend=2.5mm, draw=gray!75, inner color=blue!45, outer color=gray!35, thick, shape border uses incircle, anchor=tail,minimum height=0.7cm},
}
\tikzset{
database/.style={
cylinder,
cylinder uses custom fill,
cylinder body fill=blue!45,
cylinder end fill=blue!45,
shape border rotate=90,
aspect=0.25,
draw
}
}
\begin{document}
\begin{tikzpicture}
\node[inner sep=0pt] (user) at (0,0)
{\includegraphics[width=.05\textwidth]{person.pdf}};
\node [simple module,right = 0.5 cm of user] (app) at (1.5,0) {App};
\node[database,right = 2cm of app] (db) {DB};
\matrix[modulematrix,right=3.2cm of db,label={[anchor=north]above:Ethereum Node}] (ethNode) {Sign Transactions \\ Unlocked Account \\};
\foreach \n in {ethNode-1-1}
\node[module down arrow,below=1mm of \n] {};
\node[inner sep=0pt, right = 3.5cm of ethNode] (bchain)
{\includegraphics[width=.45\textwidth]{linkedBlocks.pdf}};
% Arrows
\draw [->,very thick,bend right] (user) -- node [text width=2.5cm,midway,above=3em,draw=blue,align=center,font=\sffamily] {Transaction using Ethereum browser } (app);
% app to node
\draw [->, very thick] (app) to [bend left](db);
\draw [->, very thick] (db) to [bend left](app);
% db to node
\draw [->, very thick] (db) to [bend left=15](ethNode);
\draw [<-, very thick] (db) to [bend right=15](ethNode);
% node to blockchain
\draw [->, very thick] (ethNode) to [bend left=8](bchain);
\draw [<->, very thick] (ethNode) to [bend right=8](bchain);
% Paths, label about arrows
\path (app) -- node [very thick,text width=2.5cm,midway,above=3em,draw=blue,align=center,font=\sffamily] {submit transactions to database} (db);
\path (app) -- node [very thick,text width=2.5cm,midway,above=-6em,draw=blue,align=center,font=\sffamily] {query database for information on transactions} (db);
% Paths, eth node
\path (db) -- node [very thick,text width=2.5cm,midway,above=3em,draw=blue,align=center,font=\sffamily] {send updates to private ethereum node} (ethNode);
\path (db) -- node [very thick,text width=2.5cm,midway,above=-6em,draw=blue,align=center,font=\sffamily] {update \\ transactional data in DB} (ethNode);
% eth node to blockchain
\path (ethNode) -- node [very thick,text width=2.5cm,midway,above=3em,draw=blue,align=center,font=\sffamily] {Broadcast Transactions to blockchain} (bchain);
\path (ethNode) -- node [very thick,text width=2.5cm,midway,above=-6em,draw=blue,align=center,font=\sffamily] {synchronize state with ethereum Node} (bchain);
% Perform transaction % Footnotes
% \node[inner sep=0pt,outer sep=0pt, font=\footnotesize,label={[yshift=-2ex]north west:{\large Note:}},text width=1.5\textwidth,anchor=north west] at ([yshift=-13,xshift=1cm]current bounding box.south west) (a)
% {\large
% A blockchain is a digitized, decentralized, public ledger of all cryptocurrency transactions.
% To access websites on the Ethereum blockchain and use dapps a specialized browser is needed, or a plugin like metamask. \\
% \textbf{Signing Transactions}: with a private local ethereum node, use its JSON RPC interface from the application to \\ perform all your blockchain operations. In order to sign something, a mathematical function is used to "sign" a piece of document/data. A digital signature of a document/data is a number generated using a private key. The private key has a corresponding public key. \\};
\end{tikzpicture}
\end{document}\documentclass[border=10pt]{standalone}
\usepackage{tikz}
\usetikzlibrary{decorations.pathmorphing, shapes}
\begin{document}
\begin{tikzpicture}[decoration={coil},
dna/.style={decorate, thick, decoration={aspect=0, segment length=0.5cm}}]
%DNA
\draw[dna, decoration={amplitude=.15cm}] (.1,0) -- (11,0);
\draw[dna, decoration={amplitude=-.15cm}] (0,0) -- (11,0);
\node at (0,0.5) {DNA};
\end{tikzpicture}
\end{document}\documentclass[tikz]{standalone}
\usepackage{lmodern}
\usetikzlibrary{shadows,chains,scopes}
\usetikzlibrary{decorations.pathmorphing, shapes}
\begin{document}
\begin{tikzpicture}
[
start chain=going right,
node distance=5mm,
every on chain/.style={
thick,
draw=black,
top color=white,
bottom color=blue!20,
font=\sffamily\small,
minimum width=12mm,
minimum height=10mm,
drop shadow,
%label={below:block \tikzchaincount},
},
decoration={coil},
dna/.style={decorate, thick, decoration={aspect=0, segment length=0.75cm}},
% post join/.style={
% -stealth,
% line width=1.5mm,
% red,
% rounded corners=1mm,
% },
square/.style={thick,
draw=black,
top color=white,
bottom color=black!10,
font=\sffamily\small,
minimum width=12mm,
minimum height=10mm,
drop shadow},
every label/.style={
font=\sffamily\scriptsize
},
]
\draw[dna, decoration={amplitude=.15cm}] (.5,-0) -- (1.9,-0);
%\draw[dna, decoration={amplitude=.35cm}] (.9,-0) -- (1.5,-0);
\draw[dna, decoration={amplitude=.15cm}] (.1,-0) -- (1.5,-0);
\draw[dna, decoration={amplitude=.15cm}] (2.25,-0) -- (3.65,-0);
%\draw[dna, decoration={amplitude=.35cm}] (.9,-0) -- (1.5,-0);
\draw[dna, decoration={amplitude=.15cm}] (1.85,-0) -- (3.25,-0);
\draw[dna, decoration={amplitude=.15cm}] (.5,-2.5) -- (1.9,-2.5);
%\draw[dna, decoration={amplitude=.35cm}] (.9,-0) -- (1.5,-0);
\draw[dna, decoration={amplitude=.15cm}] (.1,-2.5) -- (1.5,-2.5);
\draw[dna, decoration={amplitude=.15cm}] (2.25,-2.5) -- (3.65,-2.5);
%\draw[dna, decoration={amplitude=.35cm}] (.9,-0) -- (1.5,-0);
\draw[dna, decoration={amplitude=.15cm}] (1.85,-2.5) -- (3.25,-2.5);
%% Path for dots
\node [on chain,label={above:block 1}] {A};
\node [on chain,label={above:block 2}] {B};
\node [on chain,label={above:block 3}] {C};
\node [on chain=going below,yshift=-1cm,label={below:block n--2}] {D};
{[continue chain=going left]
\node [on chain,label={below:block n--1}] {E};
\node [on chain,label={below:block n}] {F};
}
%\node[square,left of= chain-6] {G};
{[transparency group, opacity=.25]
% \draw [post join] (chain-1.south) |- (chain-3.center) |- (chain-6.center) -- (chain-6.north);
}
\path (chain-3.south) -- (chain-4.north) node [black, font=\Huge, midway, sloped,xshift=0cm] {$\dots$};
\node[] at (1.75,-1.25) { \textsc{BLOCKCHAIN}};
\end{tikzpicture}
\end{document}\documentclass[tikz]{standalone}
\usetikzlibrary{positioning,fit}
\begin{document}
\tikzset{
pobl/.style={
inner sep=0pt, outer sep=0pt, fill=#1,
},
pobl gron/.style n args={2}{
pobl=#1, rounded corners=#2,
},
pics/person/.style n args={3}{
code={
\node (-corff) [pobl=#1, minimum width=.25*#2, minimum height=.375*#2, rotate=#3, pic actions] {};
\node (-pen) [minimum width=.3*#2, circle, pobl=#1, outer sep=.01*#2, anchor=south, rotate=#3, pic actions] at (-corff.north) {};
\node (-coes dde) [pobl gron={#1}{1pt}, anchor=north west, minimum width=.12125*#2, minimum height=.25*#2, rotate=#3, pic actions] at (-corff.south west) {};
\node [pobl=#1, anchor=north, minimum width=.12125*#2, minimum height=.15*#2, rotate=#3, pic actions] at (-coes dde.north) {};
\node (-coes chwith) [pobl gron={#1}{1pt}, anchor=north east, minimum width=.12125*#2, minimum height=.25*#2, rotate=#3, pic actions] at (-corff.south east) {};
\node [pobl=#1, anchor=north, minimum width=.12125*#2, minimum height=.15*#2, rotate=#3, pic actions] at (-coes chwith.north) {};
\node (-braich dde) [pobl gron={#1}{.75pt}, minimum width=.075*#2, minimum height=.325*#2, outer sep=.0064*#2, anchor=north west, rotate=#3, pic actions] at (-corff.north east) {};
\node [pobl=#1, minimum width=.05*#2, minimum height=.2*#2, outer sep=.0064*#2, anchor=north west, rotate=#3, pic actions] at (-corff.north east) {};
\node (-braich chwith) [pobl gron={#1}{.75pt}, minimum width=.075*#2, minimum height=.325*#2, outer sep=.0064*#2, anchor=north east, rotate=#3, pic actions] at (-corff.north west) {};
\node [pobl=#1, minimum width=.0375*#2, minimum height=.2*#2, outer sep=.0064*#2, anchor=north east, rotate=#3, pic actions] at (-corff.north west) {};
\node (-fit person) [fit={(-pen.north) (-braich dde.east) (-coes chwith.south) (-braich chwith.west)}] {};
% \node (-pwy) [below=25pt of -fit person, every pin] {\tikzpictext};
% This draws the arrow
%\draw [every pin edge] (-fit person) -- (-pwy);
},
},
}
\begin{tikzpicture}
% [
% every pin edge/.append style={latex-, shorten <=-2.5pt},
% ]
\draw pic (person) [pic text={}] {person={blue}{25pt}{0}};
\end{tikzpicture}
\end{document}\documentclass[6pt]{standalone}
\usepackage{tikz}
\usetikzlibrary{snakes}
\usepackage{fullpage}
\begin{document}
%
%\begin{figure}
%\caption{Time Line}
%\centering
%\resizebox{\linewidth}{!}{% Resize table to fit within
\begin{tikzpicture}[]
%draw horizontal line
\draw (0,0) -- (41/1.7,0);
%draw vertical lines
\foreach \x in {0, 8, 15, 22, 29, 36, 41}{
\draw (\x/1.7,3pt) -- (\x/1.7,-3pt);
}
%draw nodes
\draw (0,0) node[text width = 85pt,align=center,below=3pt] {\textbf{Submit Project Proposal}} node[above=3pt] {Nov 17 2017};
\draw (8/1.7,0) node[below=3pt] {Find Game Engine} node[above=3pt] {Nov 20 2017};
\draw (15/1.7,0) node[text width = 100pt,align=center,below=3pt] {Create Server-Client Architecture} node[above=3pt] {Nov 25 2017};
\draw (22/1.7,0) node[text width = 100pt,align=center,below=3pt] {Implement Game Logic} node[above=3pt] {Nov 29 2017};
\draw (29/1.7,0) node[text width = 100pt,align=center,below=3pt] {Add Music and Effects} node[above=3pt] {Dec 1 2017};
\draw (36/1.7,0) node[text width = 100pt,align=center,below=3pt] {\textbf{In Class Demo}} node[above=3pt] {Dec 2 2017};
\draw (41/1.7,0) node[below=3pt] {\textbf{Finish Report}} node[above=3pt] {Dec 12 2017};
\end{tikzpicture}
%}
%\label{fig:time_line}
%\end{figure}
\end{document}\documentclass[svgnames]{standalone}
\usepackage{lmodern}
\usepackage{tikz}
\usetikzlibrary{positioning}
\usepackage{xcolor}
\definecolor{lightgray}{rgb}{0.83, 0.83, 0.83}
\definecolor{lightblue}{rgb}{0.68, 0.85, 0.9}
\definecolor{brandeisblue}{rgb}{0.0, 0.44, 1.0}
\definecolor{darkpastelgreen}{rgb}{0.01, 0.75, 0.24}
\definecolor{electricgreen}{rgb}{0.0, 1.0, 0.0}
\usetikzlibrary{fadings,shapes.arrows,shadows,calc}
\tikzset{bubble/.style={rectangle, draw=gray,rounded corners,fill=#1,align = flush center,minimum height=1cm,minimum width=1.25cm}}
\tikzfading [name=arrowfading, top color=transparent!0, bottom color=transparent!95]
\tikzset{arrowfill/.style={top color=OrangeRed!20, bottom color=Red, general shadow={fill=black, shadow yshift=-0.8ex, path fading=arrowfading}}}
\tikzset{arrowstyle/.style={draw=FireBrick,arrowfill, single arrow,minimum height=#1, single arrow,
single arrow head extend=.2cm,}}
\begin{document}
\begin{tikzpicture}[
bigcircle/.style={ % style for the circles
text width=1.6cm, % diameter
align=center, % center align
line width=0.5mm, % thickness of border
draw, % draw the border
circle, % shape
font=\sffamily\footnotesize % font of the year
}
node distance=10mm and 16000mm % vertical and horizontal separation of nodes, when positioned with e.g. above=of othernode
]
\node [rectangle,draw=lightgray!80, line width=2mm, inner sep=0pt,rounded corners,minimum width=1.6cm, minimum height=2.45cm,label={below:SOURCE CODE}] (contractCode) {\includegraphics[width=2.1cm]{if_source_moc_7003.png}};
\node [rectangle, line width = 0.01 mm, draw=black, below = 0.5cm of contractCode, minimum height=1.45cm,text width=3.85cm] () {self-executing code that faciliates agreement \\ between parties};
\node [rectangle,draw=lightblue!80, line width=2mm, inner sep=0pt,rounded corners,minimum width=2.2cm, minimum height=2.45cm,right= 1.75cm of contractCode,label={below:\textsc{TRANSPARENT}}] (handshake) {\includegraphics[width=2.1cm]{handshake.png}};
\node [rectangle, line width = 0.01 mm, draw=black, below = 0.5cm of handshake, minimum height=1.45cm,text width=3.85cm] () {terms of contract are available on the public ledger};
\node [rectangle,draw=brandeisblue!80, line width=2mm, inner sep=0pt,rounded corners,minimum width=2.2cm, minimum height=2.45cm,right= 1.75cm of handshake,label={below:\textsc{BLOCKCHAIN}}] (blockchain) {\includegraphics[width=1.9cm]{blockchain.pdf}};
\node [rectangle, line width = 0.01 mm, draw=black, below = 0.5cm of blockchain, minimum height=1.45cm,text width=3.95cm] () {event triggers the \\ execution of the contract (redeeming a ticket)};
\node [rectangle,draw=darkpastelgreen!80, line width=2mm, inner sep=0pt,rounded corners,minimum width=2.2cm, minimum height=2.45cm,right= 1.75cm of blockchain,label={below:\textsc{PAYMENT}}] (payment) {\includegraphics[width=1.9cm]{transferMoney.png}};
\node [rectangle, line width = 0.01 mm, draw=black, below = 0.5cm of payment, minimum height=1.45cm,text width=3.85cm] () {accounts are updated, parties recieve amounts based on contracts};
% Arrows
\node [arrowstyle=1.25cm] at ($(contractCode.east)!0.5!(handshake.west)$) {};
\node [arrowstyle=1.25cm] at ($(handshake.east)!0.5!(blockchain.west)$) {};
\node [arrowstyle=1.25cm] at ($(blockchain.east)!0.5!(payment.west)$) {};
%\node [arrowstyle=2.5cm,xshift=-0.1cm,yshift=-2.5cm] at ($(sa.south)!0.5!(lc.south)$) {git commit};
%\node [arrowstyle=3.5cm,xshift=-0.1cm,yshift=-3.5cm] at ($(lc.south)!0.5!(rc.south)$) {git push};
\end{tikzpicture}
\end{document}\documentclass{standalone}
\usepackage{datatool}
\usepackage{tikz}
\usetikzlibrary{shadows}
\usetikzlibrary{positioning}
%\usetikzlibrary{calc,intersections}
\usepackage{filecontents}
\begin{filecontents*}{tasks.dat}
phase,taskid,name,position,size
initial,initialmeeting,Initial Meeting,-2,4
planning,needsassesment,Needs Assesment,0,7
planning,research,Research,3,15
planning,siteoutline,Site Outline,5,7
content,contentoutline,Content Outline,10,7
\end{filecontents*}
\DTLloaddb[noheader=false]{tasks}{tasks.dat}
\begin{document}
\begin{tikzpicture}[week/.style={font=\bfseries, text=white},
initial/.style={fill=black!60,circle,opacity=0.5},
planning/.style={fill=red,circle,opacity=0.5},
content/.style={fill=yellow,circle,opacity=0.5} ]
%%%%% Tasks
\DTLforeach*{tasks}{\phase=phase, \taskid=taskid, \name=name, \position=position,\size=size}{\node(\taskid)[\phase, minimum size=\size em] at (\position, 0) {};
\draw (node cs:name=\taskid, anchor=north) to ++(0,3) node[above, scale=\size/6] {\name};
}
\filldraw[fill=black, draw=white,line width=1ex,opacity=0.75] (-3.5,-0.5) rectangle (54,0.5);
%%%%% Weeks.
\node[week] at (0,0) {WEEK1};
\node[week] at (7,0) {WEEK2};
\node[week] at (14,0) {WEEK3};
\node[week] at (21,0) {WEEK4};
\node[week] at (28,0) {WEEK5};
\node[week] at (35,0) {WEEK6};
\node[week] at (42,0) {WEEK7};
\node[week] at (49,0) {WEEK8};
\end{tikzpicture}
\end{document} \documentclass{standalone}
\usepackage{tikz}
\usetikzlibrary{arrows.meta,
calc, chains,
quotes,
positioning,
shapes.geometric}
\begin{document}
\begin{tikzpicture}[
node distance = 8mm and 16mm,
start chain = A going below,
base/.style = {draw, minimum width=32mm, minimum height=8mm,
align=center, on chain=A},
startstop/.style = {base, rectangle, rounded corners, fill=red!30},
process/.style = {base, rectangle, fill=orange!30},
io/.style = {base, trapezium,
trapezium left angle=70, trapezium right angle=110,
fill=blue!30},
decision/.style = {base, diamond, fill=green!30},
every edge quotes/.style = {auto=right}]
]
\node [startstop] {Read Video}; % <-- A-1
\node [process] {Extract Frames};
\node [io] {Read Frame};
\node [decision] {Completed?};
\node [process] {Save Watermarked Video};
\node [process] {Stop}; % <-- A-6
%
\node [process, % <-- A-7
right=of A-4] {Get Next Frame};
%%
\draw [arrows=-Stealth]
(A-1) edge["read data"] (A-2)
(A-2) edge["get watermark"] (A-3)
(A-3) edge[text width=3cm,"apply watermark to all frames "] (A-4)
(A-4) edge["yes"] (A-5)
(A-5) edge["exit"] (A-6)
(A-4) edge["no"'] (A-7) % <-- by ' is swapped label position
(A-7) |- ($(A-2.south east)!0.5!(A-3.north east)$)
-| ([xshift=7mm] A-3.north)
;
\end{tikzpicture}
\end{document}\documentclass{standalone}
\usepackage{tikz}
\usetikzlibrary{calc, chains,positioning}
\usepackage{fontawesome}
\begin{document}
\begin{tikzpicture}[
start chain = going right,
bin/.style={
%draw,
% text width=6mm,
inner sep=5pt,
%fill=blue!20,
on chain
}
]
% Move label below icon
\node[] (mob) {\LARGE{\faMobilePhone}};
\node[right = 2cm of mob] (cam) {\LARGE{\faCamera}};
\node[right = 2cm of cam] (lap) {\LARGE \faLaptop};
\node[below = 0.1 cm of mob] (moblabel) {\tiny{Phone}};
\node[below = 0.1 cm of cam] (camlabel) {\tiny{Camera}};
\node[below = 0.1 cm of lap] (laplabel) {\tiny{Server}};
\node[bin,below left=of lap] (c1) {\tiny{Cardboard}};
\node[bin] (c2) {\tiny{Food}};
\node[bin] (c3) {\tiny{Glass}};
\node[bin] (c4) {\tiny{$\cdots$}};
\node[bin] (c5) {\tiny{Landfill}};
\path[every node/.style={font=\sffamily\small}]
(laplabel) edge node[right] {} (c1)
(laplabel) edge node[left] {} (c2)
(laplabel) edge node[] {} (c3)
(laplabel) edge node[] {} (c5);
\node[below = 0.1 cm of c3] (label) {\tiny{Categories}};
% \draw[thick] (c3) -> (moblabel);
\path[->] (c1) edge [bend left=50, below] node {\tiny{send result to phone}} (moblabel);
\path[->] (mob) edge [below] node {\tiny{take picture}} (cam);
\path[->] (cam) edge [below] node {\tiny{send picture}} (lap);
\draw[thick,dotted] ($(c1.north west)+(0.025,-0.125)$) rectangle ($(c5.north east)+(0.25,-0.35)$);
\end{tikzpicture}
\end{document}
\documentclass[tikz]{standalone}
\usepackage{tikz}
\usetikzlibrary{shapes,snakes}
\usetikzlibrary{calc, shapes.geometric,shapes.symbols,fit,positioning,shadows}
\begin{document}
\begin{tikzpicture}
\node [circle split,draw,rotate=90, align=center,label={[anchor=north, inner sep=0pt, yshift=1.2em] east:{\selectfont Neural Body}}] (part){\rotatebox{-90}{ \parbox{1.5cm}{Network input to neuron z} } \nodepart{lower} \rotatebox{-90}{\parbox{1.5cm}{Neuron Output o}} };
\draw[->,rounded corners=5pt] (part.south) -- ($(part.south)+(1.5,0)$);
\node[right = 3 em of part.south, label=Neuron Output] () {};

\node[above left = 0em and 10em of part.east] (t1) {$I_1-$Input 1};
\node[left = 4em of part.north] (t2) {$I_2-$Input 2};
\node[below left = 4em and 4em of part.north] (t3) {$I_3-$Input 3};

\draw[->] (t1) -- (part) node[midway,sloped,above] {$W_1$};
\draw[->] (t2) -- (part) node[midway,sloped,above] {$W_2$};
\draw[->] (t3) -- (part) node[midway,sloped,above] {$W_3$};
\end{tikzpicture}
\end{document}
\documentclass[tikz,11pt]{standalone}
\usepackage{tikz}
\usetikzlibrary{shapes.geometric,shapes.symbols,fit,positioning,shadows}
\usetikzlibrary{arrows, arrows.meta, backgrounds, calc, shapes.misc, positioning}
\begin{document}
\tikzset{
    purpleBox/.style n args={3}{
        text centered, fill=purpleVue, minimum width = #1, minimum height= #2, text=white,
        text width = #3,
        rounded corners
    },
    redBox/.style n args={3}{
        text centered, fill=redVue, minimum width = #1, minimum height= #2, text=white,
        text width = #3,
        rounded corners
    },
    orangeBox/.style n args={3}{
        fill=orangeVue, minimum width = #1, minimum height= #2, text=white,
        text centered,
        rounded corners
    },
    greenCircle/.style n args={3}{
        fill=greenVue, minimum width = #1, minimum height= #2, text=white,
        text centered,
        circle
    },
    lineCustom/.style={
        very thick,
        color=gray,
        dotted,
        shorten <=2pt,
        shorten >=2pt
    },
    arrowCustom/.style={
        >=triangle 60,
        ->,
        very thick,
        color=gray,
        dotted
    },
    database/.style={
      cylinder,
      cylinder uses custom fill,
      cylinder body fill=greenVue,
      cylinder end fill=greenVue,
      shape border rotate=90,
      aspect=0.25,
      draw
    }
}
\definecolor{purpleVue}{rgb}{0.6,0.5,0.9}

\definecolor{orangeVue}{rgb}{0.975,0.7,0.2}

\definecolor{greenVue}{rgb}{0.15,0.65,0.4}
\definecolor{redVue}{rgb}{0.95,0.45,0.55}
\definecolor{blueBox}{rgb}{0.3,0.65,0.85}
% Hardcoded positioning
\begin{tikzpicture}
\node[rectangle, draw, minimum width= 10cm, minimum height=10cm, label={[anchor=north, inner sep=0pt, yshift=-0.6em, text=black]north:Online banking software}]
(online) {};
\node[right= 2cm of online, draw, rectangle, minimum width= 10cm, minimum height=10cm,label={[anchor=north, inner sep=0pt, yshift=-0.6em, text=black]north:Bank   teller software}]
(soft) {};

\node[rectangle, draw,thin, fill=blueBox, text width=2cm, align=center,
text=white,minimum width=2.2cm,copy shadow={shadow xshift=1ex, shadow yshift=-1.5ex},minimum height=1.5cm]
at ([xshift=0em, yshift=-4em] online.north) (upa){User Profile App};


\node[draw, left=5cm of upa]
(label) {Customer};
\node[rectangle, draw,thin, fill=blueBox, text width=2cm, align=center,
text=white,minimum width=2.2cm,copy shadow={shadow xshift=1ex, shadow yshift=-1.5ex},minimum height=1.5cm]
at ([xshift=5em, yshift=-7.5em] upa.center) (us){User Surface};

\node[database, draw,thin, text width=2cm, align=center,
text=white,minimum width=2.2cm,minimum height=1.5cm]
at ([yshift=-7.5em] us.center) (db){Database};

\node[rounded corners, draw, fill=blueBox,
minimum width=2.2cm,minimum height=5cm, text width=2cm, align=center,
double=black, %% here
double distance =1pt, dashed, below left = -4em and 5 em of us] (as){Auth subsystem};

\node[database, draw,thin, text width=2cm, align=center,
text=white,minimum width=2.2cm,minimum height=1.5cm]
at ([yshift=-7.5em] us.center) (db){Database};

\node[rectangle, draw,thin, fill=blueBox, text width=2cm, align=center,
text=white,minimum width=2.2cm,copy shadow={shadow xshift=1ex, shadow yshift=-1.5ex},minimum height=1.5cm]
at ([xshift=-3em, yshift=-4em] soft.north) (a1){App};

\node[rectangle, draw,thin, fill=blueBox, text width=2cm, align=center,
text=white,minimum width=2.2cm,copy shadow={shadow xshift=1ex, shadow yshift=-1.5ex},minimum height=1.5cm]
at ([xshift=10em] a1.center) (a2){App};

\node[rectangle, draw,thin, fill=blueBox, text width=2cm, align=center,
text=white,minimum width=2.2cm,copy shadow={shadow xshift=1ex, shadow yshift=-1.5ex},minimum height=1.5cm]
at ([yshift=-8em] a1.center) (ps1){Promotion Service};

\node[rectangle, draw,thin, fill=blueBox, text width=2cm, align=center,
text=white,minimum width=2.2cm,copy shadow={shadow xshift=1ex, shadow yshift=-1.5ex},minimum height=1.5cm]
at ([yshift=-8em] a2.center) (ps2){Promotion Service};

\node[database, draw,thin, text width=2cm, align=center,
text=white,minimum width=2.2cm,minimum height=1.5cm]
at ([yshift=-7.5em] ps2.center) (bp){Branch Promotions};

\node[database, draw,thin, text width=2cm, align=center,
text=white,minimum width=2.2cm,minimum height=1.5cm]
at ([yshift=-7.5em] ps1.center) (cust){Customers};

\node[draw, above=1cm of soft]
(bt) {Bank Teller};

\draw [->] (upa) edge (us) (upa) edge (as) (us) edge (db);

\draw [->] (a1) edge (a2) (ps1) edge (cust) (a1) edge (ps1) (a2) edge (ps2) (ps2) edge (bp);
\end{tikzpicture}

\end{document}\documentclass[tikz,11pt]{standalone}
\usepackage{tikz}
\usetikzlibrary{shapes.geometric,shapes.symbols,fit,positioning,shadows}
\usetikzlibrary{arrows, arrows.meta, backgrounds, calc, shapes.misc, positioning}
\begin{document}
% Finish off green box and then browser outline tmmr
\tikzset{
purpleBox/.style n args={3}{
text centered, fill=purpleVue, minimum width = #1, minimum height= #2, text=white,
text width = #3,
rounded corners
},
redBox/.style n args={3}{
text centered, fill=redVue, minimum width = #1, minimum height= #2, text=white,
text width = #3,
rounded corners
},
orangeBox/.style n args={3}{
fill=orangeVue, minimum width = #1, minimum height= #2, text=white,
text centered,
rounded corners
},
greenCircle/.style n args={3}{
fill=greenVue, minimum width = #1, minimum height= #2, text=white,
text centered,
circle
},
lineCustom/.style={
very thick,
color=gray,
dotted,
shorten <=2pt,
shorten >=2pt
},
arrowCustom/.style={
>=triangle 60,
->,
very thick,
color=gray,
dotted
},
}
\definecolor{purpleVue}{rgb}{0.6,0.5,0.9}
\definecolor{orangeVue}{rgb}{0.975,0.7,0.2}
\definecolor{greenVue}{rgb}{0.15,0.65,0.4}
\definecolor{redVue}{rgb}{0.95,0.45,0.55}
% Hardcoded positioning
\begin{tikzpicture}[background rectangle/.style={fill=black}, show background rectangle]
% Browser Box that wraps around UI and Client Addons box
\node[rounded corners, draw,
double=redVue, %% here
double distance =1pt, minimum height= 9.5em, minimum width=27em, dashed]
(Browser) {};
% Label for browser
\node[rounded corners,
text=redVue] at ([xshift=-3em, yshift=4em]
% See https://tex.stackexchange.com/questions/27843/level-of-boldness-changeable
Browser.west) (BrowserLabel) {\fontseries{bx}\selectfont Browser};
% Green box in upper left
\node[rounded corners, fill=greenVue, text=white, minimum height= 7.5em, minimum width=10em, text centered, right = 0.75em of Browser.west] (UI) {User Interface};
% Purple box in upper right
\node[rounded corners, %fill=black,
text depth = 5em, minimum width=15em,
draw,
double=purpleVue, %% here
double distance =1pt, %% here
%font=\Large,
minimum height= 7.5em,
text=purpleVue, right = 0.5 em of UI] (CA){Client Addons};
% Hardcoded nodes
\node[purpleBox={6em}{1.5em}{6em}] at ([xshift=-3.5em] CA.center){Injection};
\node[purpleBox={6em}{1.5em}{6em}] at ([xshift=3.5em] CA.center) (Mix) {Mixins};
\node[purpleBox={6em}{1.5em}{6em}] at ([xshift=-3.5em, yshift=-2em] CA.center) (comp) {Components};
\node[purpleBox={6em}{1.5em}{6em}] at ([xshift=3.5em, yshift=-2em] CA.center) (routes) {Routes};
% Mix is used as an example node to use offset
% \node[rounded corners, fill=greenVue, text=white, minimum height= 7.5em, minimum width=10em, text centered, right = 0.75em of Mix] (UI2) {User Interface};
% Node Js Box
\node[rounded corners, draw,
double=redVue, %% here
double distance =1pt, minimum height= 45em, minimum width=27em, dashed, below = 5 em of Browser]
(Nodejs) {};
% Label for browser
\node[rounded corners,
text=redVue] at ([yshift=-14em]
BrowserLabel.south){\fontseries{bx}\selectfont Node.Js};
\node[rounded corners, %fill=black,
text depth = 5em, minimum width=15em,
draw,
double=redVue, %% here
double distance =1pt, %% here
%font=\Large,
minimum height= 10.5em,
minimum width= 25em,
text=redVue] at ([yshift=-6.5em]
Nodejs.north) (BProcess){};
% Label Node, seperate node is used
% to have control over node positioning
\node[text=redVue] at ([yshift=-1.5em]
BProcess.north) {\fontseries{bx}\selectfont Build Process};
\node[purpleBox={5.75em}{7em}{5em}] at ([xshift=3.25em, yshift=-0.5em] BProcess.west) (devStatic){DEV/Static Server};
%% WEBPACK CODE
% Sample label label={[anchor=north, draw=red, inner sep=0pt, yshift=-0.2em]north:Webpack}
\node[orangeBox={5.75em}{7em}{5em}, label={[anchor=north, inner sep=0pt, yshift=-0.6em, text=white]north:Webpack}] at ([xshift=6.15em] devStatic.center) (webpack) {};
\node[purpleBox={4.5em}{3em}{4.5em}] at ([yshift=-0.5em] webpack.center) (webpackPlugin) {Webpack Plugin};
% MARKDOWN IT BOX
\node[orangeBox={6.75em}{7em}{5em},label={[anchor=north, inner sep=0pt, yshift=-0.6em, text=white]north:markdown-it}] at ([xshift=6.75em] webpack.center) (markdownIt) {};
\node[purpleBox={5.25em}{3em}{5.25em}] at ([yshift=-0.5em] markdownIt.center) (webpackPlugin) {markdown-it plugin};
\node[purpleBox={3.75em}{7em}{3.75em}] at ([xshift=2.7em] markdownIt.east) (dynMod){Dynamic Modules};
% USER PROJECT
\node[rounded corners, %fill=black,
text depth = 5em,
draw,
double=redVue, %% here
double distance =1pt, %% here
%font=\Large,
minimum height= 13em,
minimum width= 15em,
text=redVue, label={[anchor=north, inner sep=0pt, yshift=-1.2em, text=redVue] north:{\fontseries{bx}\selectfont User Project}}] at ([xshift=-2cm, yshift=-10.5em]
BProcess.south) (UP){};
% Configuration Files and Plugin box
\node[purpleBox={8em}{3.75em}{8em}] at ([xshift=5em, yshift=2em] UP.west) (confFiles){Configuration Files};
\node[greenCircle={2em}{2em}{2em}] at ([xshift=3em] confFiles.east) (CFP1){Plugin};
\node[redBox={8em}{3.75em}{8em}] at ([yshift=-3em] confFiles.south) (markFiles){Markdown Files};
\node[greenCircle={2em}{2em}{2em}] at ([xshift=3em] markFiles.east) (CFP2){Plugin};
% THEME BLOCK
\node[rounded corners, %fill=black,
text depth = 5em,
draw,
double=redVue, %% here
double distance =1pt, %% here
%font=\Large,
minimum height= 13em,
minimum width= 15em,
text=redVue, label={[anchor=north, inner sep=0pt, yshift=-1.2em, text=redVue] north:{\fontseries{bx}\selectfont Theme}}] at ([yshift=-7.5em]
UP.south) (theme){};
% Configuration Files and Plugin box
\node[purpleBox={8.75em}{3.75em}{7em}] at ([xshift=5em, yshift=2em] theme.west) (tconfFiles){Configuration Files};
\node[greenCircle={2em}{2em}{2em}] at ([xshift=3em] tconfFiles.east) (tCFP1){Plugin};
% Figure out non hacky way
\node[redBox={8.75em}{3.75em}{7em}] at ([yshift=-3em] tconfFiles.south) (tLayoutComp){Layout Components};
\node[greenCircle={2em}{2em}{2em}] at ([xshift=3em] tLayoutComp.east) (tCFP2){Plugin};
% Plugin API
\node[purpleBox={5em}{25em}{5em}] at ([xshift=9.5em, yshift=-17.5em]
BProcess.south) (pluginAPI){Plugin API};
% Paths
% \path[color=white] (pluginAPI) -- (dynMod);
% Make path style
% latex'-
% \draw[->,>=latex,very thick, color=gray,dotted] (pluginAPI) -- (pluginAPI |- dynMod.south);
\draw[lineCustom] (pluginAPI) -- (pluginAPI |- dynMod.south);
\draw[lineCustom] (CFP1) -- (CFP1 -| pluginAPI.west);
\draw[lineCustom] (CFP2) -- (CFP2 -| pluginAPI.west);
\draw[lineCustom] (tCFP1) -- (tCFP1 -| pluginAPI.west);
\draw[lineCustom] (tCFP2) -- (tCFP2 -| pluginAPI.west);
\draw[arrowCustom] (devStatic) -- (devStatic |- UI.south) node [midway, left, yshift=2em] {Assets};
% Super advanced arrow
\draw[lineCustom, rounded corners=5pt] (dynMod) |- ($(comp.south) + (0, -4.5em)$) node[above] {MetaData};
\draw[arrowCustom, rounded corners=5pt] ($(comp.south) + (0, -4.5em)$) -| ( $(UI.south) + (3em, 0)$);
\draw[lineCustom, rounded corners=5pt] (devStatic.south) |- ($0.5*(dynMod.south)+0.5*(pluginAPI.north)$);
\draw[lineCustom, rounded corners=5pt] ($0.5*(dynMod.south)+0.5*(pluginAPI.north)$) -| ($(routes.south) + (3.35em, -4.5em)$);
\draw[lineCustom, rounded corners=5pt] ($(routes.south) + (3.35em, -4.85em)$) |- ($(routes.south) + (0, -3.23em)$);
\draw[arrowCustom, rounded corners=5pt] ($(routes.south) + (0.25em, -3.23em)$) -| (CA.south);
% Webpack to end line below
\draw[lineCustom, rounded corners=5pt] (webpack.south) |- ($0.5*(dynMod.south)+0.5*(pluginAPI.north)$);
\draw[lineCustom, rounded corners=5pt] (markdownIt.south) |- ($0.5*(dynMod.south)+0.5*(pluginAPI.north)$);
\end{tikzpicture}
\end{document}
\documentclass[11pt]{standalone}
\usepackage[T1]{fontenc}
\usepackage{tikz}
\usetikzlibrary{calc,positioning,shapes.geometric}

\begin{document}
  \begin{tikzpicture}[
    >=stealth,
    node distance=1.5cm,
    database/.style={
      cylinder,
      text opacity=0,
      cylinder uses custom fill,
      cylinder body fill=blue!10,
      cylinder end fill=white!50,
      shape border rotate=90,
      aspect=0.25,
      draw
    }
  ]
    \node[database, label={[anchor=north, inner sep=0pt, yshift=-0.6em, text=black]south:data source 1}] (db1) at (0,0) {DB1};
    \node[database, label={[anchor=north, inner sep=0pt, yshift=-0.6em, text=black]south:data source 2}, below of=db1] (db2) {DB2};
    \node[below of=db2] (dbDots) {$\vdots$};
    \node[database, label={[anchor=north, inner sep=0pt, yshift=-0.6em, text=black]south:data source n}, below of=dbDots] (db3) {DB3};

    % THEME BLOCK
    \node[rounded corners, %fill=black,
    text depth = 5em,
    draw,
    % double distance =1pt,    %% here
    %font=\Large,
    minimum height= 13em,
    minimum width= 20em,
    fill=blue!10,
    label={[anchor=north, inner sep=0pt, yshift=-1em] south:{Data warehouse}}] at ([xshift=25.5em, yshift=-2em]
    db2.west) (dw){};

    % Configuration Files and Plugin box
    \node[rounded corners, %fill=black,
    draw,
    text centered,
    text width = 0.20\textwidth,
    fill=white,
    minimum height= 9em,
    minimum width= 2em] at ([xshift=5em] dw.west) (dl){Data loaders};
    \node[rounded corners, %fill=black,
    draw,
    text centered,
    text width = 0.20\textwidth,
    fill=white,
    minimum height= 9em,
    minimum width= 2em,
    label={[anchor=north, inner sep=0pt, yshift=-0.2em] south:{DBMS}}] at ([xshift=-5em] dw.east) (dbms){};
    \node[database] at ([yshift=-2.5em] dbms.north) {din1};
    \node[database] at ([yshift= 2em] dbms.south) {din2};


    \node[circle, fill=blue!10, draw, minimum width=2em] at ([xshift=10em] dw.east) (c2) {};
    \node[circle, fill=blue!10, draw, minimum width=2em] at ([yshift=4.5em, xshift=10em] dw.east) (c1) {};
    \node[circle, fill=blue!10, draw, minimum width=2em] at ([yshift=-4.5em, xshift=10em] dw.east) (c3) {};

    % arrows

    \draw (db1.east) -- (dw);
    \draw (db2.east) -- (dw);
    \draw (db3.east) -- (dw);
    \draw[->] (dw) -> (c1);
    \draw[->] (dw) -> (c2);
    \draw[->] (dw) -> (c3);

    % Extra Thick arrow
    \draw[->, very thick] (dl) -> (dbms);
  \end{tikzpicture}
\end{document}\documentclass[tikz]{standalone}
\usepackage{tikz}
\usepackage{color}
\usepackage[utf8]{inputenc}
\usetikzlibrary{shapes, positioning}
\definecolor{aliceblue}{rgb}{0.94, 0.97, 1.0}
\definecolor{aqua}{rgb}{0.0, 1.0, 1.0}
\begin{document}
\begin{tikzpicture}
\node[draw, rectangle,fill=aqua!50!blue!10
, text width=4cm,minimum height=3cm,minimum width=20cm, align=center, label={[anchor=north, inner sep=0pt, yshift=-0.6em, text=black]north:\LARGE{View Level}}] at
(0,0) (rect) {};
\node[draw, rectangle,fill=aqua!50!blue!40
, text width=1cm,minimum height=1cm,minimum width=2cm, align=center] at
([xshift=10em, yshift=-1em]rect.west) (v1) {view 1};
\node[draw, rectangle,fill=aqua!50!blue!40
, text width=1cm,minimum height=1cm,minimum width=2cm, align=center] at
([xshift=8em]v1.east) (v2) {view 2};
\node[draw=none, align=center] at
([xshift=6em]v2.east) (v3) {$\cdots$};
\node[draw, rectangle,fill=aqua!50!blue!40
, text width=1cm,minimum height=1cm,minimum width=2cm, align=center] at
([xshift=8em]v3.east) (v4) {view 4};
\node[draw, rectangle,fill=aqua!50!blue!40
, text width=1cm,minimum height=1cm,minimum width=2cm, align=center] at
([yshift=-5em]rect.south) (ll) {Logical level};
\node[draw, rectangle,fill=aqua!50!blue!40
, text width=2cm,minimum height=1cm,minimum width=2cm, align=center] at
([yshift=-5em]ll.south) (pl) {Physical level};
\draw (rect) -- (ll);
\draw (ll) -- (pl);
\end{tikzpicture}
\end{document}
\documentclass[tikz,border=0]{standalone}
\usepackage{tikz}
\usetikzlibrary{trees}
\usetikzlibrary{shadows}
\begin{document}
\begin{tikzpicture}[level distance=1.5cm,
level 1/.style={sibling distance=3.5cm},
level 2/.style={sibling distance=1cm}]
\tikzstyle{every node}=[circle, draw, fill=blue!30]
% Preamble:
\tikzset{no shadows/.style={general shadow/.style=}}
every label/.append style = {
     label distance=1em,
     font=\scriptsize,
     every shadow/.style={opacity=0}, % <- add this
  }
\node (Root) [circular drop shadow, label={[label distance=0.5cm]0:Frame Opportunities}] {}
    child {
    node[circular drop shadow, label={[left, label distance=-1cm]0:Form Insights}] {}
    child {
        node[circular drop shadow, xshift=-4.5em, label={[left, label distance=-1cm]0:Make Observations}] {}
        child { node[circular drop shadow, xshift=-4.5em, label={[left, label distance=-1cm]0:Define the problem}] {} }
    }
}
child {
    node[circular drop shadow, label={[right, label distance=1cm]0:Generate Ideas}] {}
    child {
        node[circular drop shadow, xshift=4.5em, label={[right, label distance=1cm]0:Refine Solutions}] {}
        child { node[circular drop shadow, xshift=4.5em, label={[right, label distance=1cm]0:Try Prototypes}] {} }
    }
};

% Harcoded line
\draw [blue!30,dash dot] (-8,-1) -- (8,-1);
\node[draw=none, fill=none, text width= 2cm, align=center] at (-7.25, -1) {\textbf{Opportunity Problem}};
\end{tikzpicture}
\end{document}
% Flutter in Action Eric Windmill
% Litereally the first page
\documentclass{standalone}
\usepackage{tikz}
\usetikzlibrary{shapes,positioning}
\usetikzlibrary{arrows.meta}
\begin{document}
\tikzset{
graynode/.style={shape=rectangle, fill=gray!25},
bluenode/.style={shape=rectangle, draw=blue, line width=2},
greennode/.style={shape=rectangle, draw=green, line width=2},
rednode/.style={shape=rectangle, draw=red, line width=2},
lineCustom/.style={
thick,
color=black,
-latex
},
}
\begin{tikzpicture}
% Widget Content Bar
\node[rectangle,draw,minimum width=5in, minimum height=5.5in, fill=none] (content) {};
% Header bar
\node[graynode,draw, minimum width=5in, anchor=east] (header) at (content.north east) {\small{ \textbf{Widget Lifecycles}}};
% Stateless widgets
\node[rectangle, fill=gray!25, draw, text=black, text centered, below right = 3em and 0.75em of content.north west] (stateless) {\textbf{Stateless widget}};
\node[rectangle, fill=gray!15, draw, text=black, text centered, below = 2em of stateless.south] (statelessCon) {Constructor};
\node[rectangle, fill=gray!50, draw, text=black, text centered, below = 2em of statelessCon.south] (statelessBuild) { build() };
\node[draw=none, fill=none, below left = 1em and 2em of statelessBuild] (buildLoop) {};
\node[below right=-1.5em and 4em of buildLoop, text width=8em] {Rebuilds when configuration changes};
% Stateless arrows
\draw[lineCustom] (stateless.south) -- (statelessCon);
\draw[lineCustom] (statelessCon) -- (statelessBuild);
\draw[lineCustom, -] (statelessBuild.south) |- (buildLoop.west);
\draw[lineCustom] (buildLoop.west) |- (statelessBuild.west);
% Stateful widgets before state
\node[rectangle, fill=gray!25, draw, text=black, text centered, below left = 3em and 8em of content.north east] (stateful) {\textbf{Stateful widget}};
\node[rectangle, fill=gray!15, draw, text=black, text centered, below = 2em of stateful.south] (statefulCon) {Constructor};
\node[rectangle, fill=gray!50, draw, text=black, text centered, below = 2em of statefulCon.south] (createState) { createState() };
\node[draw=none, fill=none, below left = 1em and 2em of createState] (createStateLoop) {};
% Stateless arrows
\draw[lineCustom] (stateful.south) -- (statefulCon);
\draw[lineCustom] (statefulCon) -- (createState);
\draw[lineCustom, -] (createState.south) |- (createStateLoop.west);
\draw[lineCustom] (createStateLoop.west) |- (createState.west);
% Stateful widgets after states
\node[above right=-0.75em and 5.25em of createStateLoop, text width=12em] (stateObjText){Produces a State Object};
% Arrow
\draw[lineCustom] (createState.east) to [bend left] (stateObjText);
% State Object
\node[draw, rectangle, below = 5em of createState, fill=gray!20] (stateObj){\textbf{State object}};
\draw[lineCustom] (stateObjText.south) to [bend right] (stateObj);
% Mounted
\node[draw=gray, rectangle, below = 1em of stateObj, fill=gray!20] (mounted){(Mounted)};
% initState()
\node[draw=gray, rectangle, below = 1.75em of mounted, fill=gray!50] (initState){initState()};
% mounted -> initState()
\draw[lineCustom] (mounted.south) to (initState);
% Dirty State
\node[draw=gray, rectangle, below = 1.75em of initState, fill=gray!20] (dirtyState){(Dirty State)};
\draw[lineCustom] (initState.south) to (dirtyState);
\node[draw=gray, rectangle, below = 2em of dirtyState, fill=gray!50] (statefulBuild){build()};
\node[draw=gray, rectangle, left = 2em of statefulBuild, fill=gray!50] (widgetDidUpdate){widgetDidUpdate()};
\node[draw=gray, rectangle, right = 2em of statefulBuild, fill=gray!50] (setState){setState()};
\node[below=4em of widgetDidUpdate, text width=9em, align=center] (configuration){When it recieves new configuration};
% CleanState
\node[draw=gray, rectangle, below = 2em of statefulBuild, fill=gray!20] (cleanState){(Clean State)};
\node[below=4em of setState, text width=6em, align=center] (internalState){When internal State Changes};
% dispose
\node[draw=gray, rectangle, below = 2em of cleanState, fill=gray!50] (dispose){dispose()};
% Down Arrows
\draw[lineCustom] (dirtyState.south) to (statefulBuild);
\draw[lineCustom] (statefulBuild.south) to (cleanState);
\draw[lineCustom] (cleanState.south) to (dispose);
% Right Angle Arrows
\draw[lineCustom] (cleanState.west) -| (widgetDidUpdate);
\draw[lineCustom] (widgetDidUpdate.north) |- (dirtyState.west);
\draw[lineCustom] (dirtyState.east) -| (setState.north);
\draw[lineCustom] (setState.south) |- (cleanState.east);
\end{tikzpicture}
\end{document}% Author: David Li
% Basic Stock Software Architecture
\documentclass[tikz, margin=3mm]{standalone}
\usetikzlibrary{shapes.multipart}
\usetikzlibrary{matrix, fit}
\usetikzlibrary{backgrounds}
\usetikzlibrary{positioning, calc}
% Define Colors
\definecolor{cloudrunMain}{rgb}{0.3, 0.0, 0.9}
\definecolor{cloudrunSecond}{rgb}{0.3, 0.0, 0.6}
\definecolor{lightblue}{rgb}{0.68, 0.85, 0.9}
\definecolor{dodgerblue}{rgb}{0.12, 0.56, 1.0}
\definecolor{appengineMain}{rgb}{1.85,0.45,0.68}
\definecolor{appengineSecond}{rgb}{0.72, 0.1, 0.26}
\definecolor{reportsMain}{rgb}{0.1, 0.5, 0.2}
\definecolor{reportsSecond}{rgb}{0.4, 0.8, 0.3}
\usetikzlibrary{fadings, shapes.arrows, shadows,calc}
\tikzset{
sectionHeader/.style args = {#1}{
draw=none,
rectangle split, rectangle split horizontal, rectangle split parts=2,
rectangle split draw splits=false, % figure this out
%text width=3cm,
align=center, thick,
rectangle split part fill={#1,none}% end of the append after command
},
sectionContainer/.style = {
draw,
rectangle,
inner sep=0.3cm,
fill=gray,
minimum height=3cm
},
coloredBox/.style n args={4}{
text centered, fill=#4, minimum width = #1, minimum height= #2, text=white,
text width = #3,
rounded corners
},
}
\begin{document}
\begin{tikzpicture}
% Invisible reference center node
\node[draw=none] (stock-arch) {};
% Cloud stocks
\node[rectangle, rounded corners=0.25em,draw=none, minimum width=15em, minimum height=15em, fill=blue!30] (fstocks) at ([xshift=-15em] stock-arch.west) {};
% Needed to adjust the yshift to get it perfectly positioned
\node[sectionHeader={cloudrunMain}, yshift=-0.725em, anchor=west] (title) at (fstocks.north west) {\nodepart[color=white]{one} Cloud Run
\nodepart{two} \textcolor{cloudrunSecond}{\textbf{FStocks Python}}};
\node[coloredBox={10em}{2.5em}{10em}{cloudrunSecond}, yshift=-4.5em, line width=0.01pt] (fstocks-key) at (fstocks.north) {Key Indicators};
\node[coloredBox={10em}{2.5em}{10em}{cloudrunSecond}, yshift=-1em, below of = fstocks-key, line width=0.01pt] (fstocks-data) {Stock Prices and Data};
\node[coloredBox={10em}{2.5em}{10em}{cloudrunSecond}, yshift=-1em, below of = fstocks-data, line width=0.01pt] (fstocks-news) {Breaking News};
% Google Cloud C# stocks
\node[rectangle,rounded corners=0.25em,draw=none, minimum width=15em, minimum height=15em, fill=blue!30] (stocks-app) at ([xshift=15em] stock-arch.east) {};
% Needed to adjust the yshift to get it perfectly positioned
\node[sectionHeader={cloudrunMain}, yshift=-0.725em, anchor=west] (title) at (stocks-app.north west) {\nodepart[color=white]{one} Cloud Run
\nodepart{two} \textcolor{cloudrunSecond}{\textbf{Stocks C\#}}};
\node[coloredBox={10em}{2.5em}{10em}{cloudrunSecond}, yshift=-4.5em, line width=0.01pt] (stocks-app-data) at (stocks-app.north) {Fred Charts};
\node[coloredBox={10em}{2.5em}{10em}{cloudrunSecond}, yshift=-1em, below of = stocks-app-data, line width=0.01pt] (stocks-app-profit) {Profit Calculator};
\node[coloredBox={10em}{2.5em}{10em}{cloudrunSecond}, yshift=-1em, below of = stocks-app-profit, line width=0.01pt] (stocks-app-news) {News Articles};
% GAE Golang library switch colours
\node[rectangle,rounded corners=0.25em,draw=none, minimum width=15em, minimum height=15em, fill=red!50] (gae-server) at ([yshift=15em] fstocks.north) {};
% Needed to adjust the yshift to get it perfectly positioned
\node[sectionHeader={appengineMain}, yshift=-0.725em, anchor=west] (title) at (gae-server.north west) {\nodepart[color=white]{one} App Engine
\nodepart{two} \textcolor{appengineSecond}{\textbf{Golang Api}}};
\node[coloredBox={10em}{2.5em}{10em}{appengineSecond}, yshift=-4.5em, line width=0.01pt] (gae-server-data) at (gae-server.north) {Sentiment Analysis};
\node[coloredBox={10em}{2.5em}{10em}{appengineSecond}, yshift=-1em, below of = gae-server-data, line width=0.01pt] (gae-server-profit) {Yahoo Finance Tickers};
\node[coloredBox={10em}{2.5em}{10em}{appengineSecond}, yshift=-1em, below of = gae-server-profit, line width=0.01pt] (gae-server-news) {Crypto Prices};
% GAE Golang library switch colours
\node[rectangle,rounded corners=0.25em,draw=none, minimum width=15em, minimum height=15em, fill=green!30] (reports) at ([yshift=15em] stocks-app.north) {};
% Needed to adjust the yshift to get it perfectly positioned
\node[sectionHeader={reportsMain}, yshift=-0.725em, anchor=west] (title) at (reports.north west) {\nodepart[color=white]{one} Reports
\nodepart{two} \textcolor{reportsMain}{\textbf{Latex}}};
\node[coloredBox={10em}{2.5em}{10em}{reportsSecond}, yshift=-4.5em, line width=0.01pt] (reports-new) at (reports.north) {New Stock Report};
\node[coloredBox={10em}{2.5em}{10em}{reportsSecond}, yshift=-1em, below of = reports-new, line width=0.01pt] (reports-mlfinlab) {mlfinlab};
\node[coloredBox={10em}{2.5em}{10em}{reportsSecond}, yshift=-1em, below of = reports-mlfinlab, line width=0.01pt] (reports-prediction) {Prediction};
\end{tikzpicture}
\end{document}% This is an original Diagram
% License: CC0 or do whatever you want
% Inspired by diagrams encountered at work, probably not illegal
\documentclass{standalone}
\usepackage{tikz}
\usetikzlibrary{shapes.multipart}
\usepackage[default]{lato}
\usepackage[T1]{fontenc}
\usetikzlibrary{matrix, positioning, fit}
\tikzset{
moduleheader/.style args = {#1}{
rectangle split, rectangle split horizontal, rectangle split parts=2,
draw=none,
thick,
line width=2,
rectangle split part fill={#1,white}% end of the append after command
}% end of the box style definition
}
\begin{document}
\begin{tikzpicture}[font=\ttfamily,
mymodule/.style={matrix of nodes, nodes=typetag, row sep=5em, column sep=5em},
mycontainer/.style={draw=gray, inner sep=1ex},
typetag/.style={draw=gray, inner sep=1ex, anchor=west},
title/.style={draw=none, color=gray, inner sep=0pt}
]
\matrix[mymodule] (mx1) {
\node [moduleheader=red!80] (d1)
{ \nodepart[color=white]{one} {\Huge Data}\nodepart{two} {\Huge Apis}}; & \\
\node[draw, text width=3.5cm] (gcp) {
\textbf{\small \textcolor{blue}{GCP}|Bucket} \newline
\newline
Report Upload
}; &
\node[draw, text width=3.5cm] (newsapi) {
\textbf{\small \textcolor{green}{NewsApi}|Python} \newline
\newline
News from purchased stocks
};\\
\node[draw, text width=3.5cm] (yahoo) {
\textbf{\small \textcolor{purple}{Conversion}|USD $\leftrightarrow$ CAD} \newline
\newline
Exchanges Rates API
}; &
\node[draw, text width=3.5cm] (test) {
\textbf{\small \textcolor{red}{Stocks}|Yahoo Api} \newline
\newline
Daily data
}; \\
};
\matrix[mymodule, right=of mx1.north east, matrix anchor=north west] (mx2) {
\node [moduleheader=green!80] (d2)
{ \nodepart[color=white]{one} {\Huge Analysis}\nodepart{two} {}}; & \\
\node[draw, text width=3.5cm] (gcp) {
\textbf{\small \textcolor{orange}{Stocker}|Charting} \newline
\newline
Generate Stock Price Predictions
}; &
\node[draw, text width=3.5cm] (newsapi) {
\textbf{\small \textcolor{green}{TextBlob}|Python} \newline
\newline
Sentiment Analysis
};\\
\node[draw, text width=3.5cm] (yahoo) {
\textbf{\small \textcolor{purple}{AlphaVantgage}} \newline
\newline
Technical metrics (consider streamlit analysis)
}; &
\\
};
\node[mycontainer, fit=(mx1)] {};
\node[mycontainer, fit=(mx2)] {};
\end{tikzpicture}
\end{document}% Dupplicated from https://code.visualstudio.com/docs/remote/containers
\documentclass[11pt]{standalone}
\usepackage[T1]{fontenc}
\usepackage{tikz}
\usetikzlibrary{calc,positioning,shapes.geometric}
\begin{document}
\begin{tikzpicture}[
>=stealth,
node distance=1cm,
orange/.style={
minimum width = 11em,
fill=orange!50,
draw=red!40,
text width = 0.35\textwidth,
text centered,
},
database/.style={
cylinder,
cylinder uses custom fill,
cylinder body fill=green!60!black!50,
cylinder end fill=green!10,
shape border rotate=90,
aspect=0.25,
draw
}
]
\node[rounded corners, %fill=black,
text depth = 5em,
draw=blue!80,
% double distance =1pt, %% here
%font=\Large,
minimum height= 20em,
minimum width= 20em,
label={[anchor=north, color=blue!90, inner sep=0pt, xshift=3em, yshift=-1em] north west:{Local OS}}] (dw){};
\node[rounded corners, %fill=black,
text depth = 5em,
draw=blue!80,
% double distance =1pt, %% here
%font=\Large,
minimum height= 20em,
minimum width= 30em,
label={[anchor=north, color=blue!90, inner sep=0pt, xshift=3em, yshift=-1em] north west:{Container}},
right = of dw] (container){};
\node[ %fill=black,
draw=blue!90,
text centered,
text width = 0.20\textwidth,
fill=blue!50,
minimum height= 7em,
minimum width= 15em,
label={[anchor=north, inner sep=0pt, yshift=-0.2em] north:{\Large \textcolor{white}{VS Code}}}] at ([yshift=2em] dw.center) (code){};
\node[orange] at ([yshift=-1.25em] code.center) (t1) {Theme/UI Extension} ;
\node[orange] at ([yshift= 0.75em] code.center) (t2) {Theme/UI Extension};
\node[ %fill=black,
draw=blue!90,
text centered,
text width = 0.20\textwidth,
fill=blue!50,
minimum height= 7em,
minimum width= 15em,
label={[anchor=north, inner sep=0pt, yshift=-0.2em] north:{\Large \textcolor{white}{VS Code Server}}}] at ([xshift=10em, yshift=2em] container.west) (codeserver){};
\node[orange] at ([yshift=-1.25em] codeserver.center) (we1) {WorkSpace Extension} ;
\node[orange] at ([yshift= 0.75em] codeserver.center) (we2) {WorkSpace Extension};
% Data Sources
% Source Code
\node[database] (db1) at ([yshift=-5em] code.south) (scOS) {Source Code};
\node[database, opacity=0.6] (db1) at ([yshift=-5em] codeserver.south) (scContainer) {Source Code};
% Container Stuff
% Container widgets
% Configuration Files and Plugin box
\node[
draw=black!10,
text centered,
fill=green!30,
minimum width= 10em] at ([xshift=7em, yshift=-3em] codeserver.north east) (tp){Terminal Processes};
\node[
draw=black!10,
text centered,
fill=green!30,
minimum width= 10em] at ([xshift=7em, yshift=-5em] codeserver.north east) (ra){Running Application};
\node[
draw=black!10,
text centered,
fill=green!30,
minimum width= 10em] at ([xshift=7em, yshift=-7em] codeserver.north east) (debug){Debugger};
\node[database] (db1) at ([yshift=2em, xshift=7em] codeserver.north east) (fs) {File System};
% Connect and labels
% Arrows
\draw[->, very thick, draw=blue!40] (code.east) -> (codeserver.west);
% Labels
\node[rounded corners, %fill=black,
draw=none,
minimum height= 2em,
fill = white,
% double distance =1pt, %% here
%font=\Large,
text width = 0.11\textwidth,
text centered,
minimum width=1.5em,
xshift=3.75em] at (code.east) (dw1){Exposed port};
\draw[->, very thick, draw=blue!40] (scOS.east) -> (scContainer.west);
\node[rounded corners, %fill=black,
draw=none,
minimum height= 2em,
fill = white,
% double distance =1pt, %% here
%font=\Large,
text width = 0.11\textwidth,
text centered,
minimum width=1.5em,
xshift=8.25em] at (scOS.east) (dw1){Volume Mount};
\draw[->, very thick, draw=blue!40] (codeserver) -> (fs.west);
\draw[->, very thick, draw=blue!40] (codeserver) -> (tp);
\draw[->, very thick, draw=blue!40] (codeserver) -> (ra.west);
\draw[->, very thick, draw=blue!40] (codeserver) -> (debug.west);
\end{tikzpicture}
\end{document}% Author David Li
% Inspired by Machine Learning for Algorithmic Trading Second Edition
% see https://github.com/PacktPublishing/Machine-Learning-for-Algorithmic-Trading-Second-Edition
% References Shapes from
% http://tug.ctan.org/info/visualtikz/VisualTikZ.pdf
\documentclass[tikz,border=3.14mm]{standalone}
\usepackage{enumitem}
\usetikzlibrary{shapes.geometric}
\usetikzlibrary{shapes.symbols}
\tikzset{database/.style={cylinder,aspect=0.5,draw,rotate=90,path picture={
\draw (path picture bounding box.160) to[out=180,in=180] (path picture bounding
box.20);
\draw (path picture bounding box.200) to[out=180,in=180] (path picture bounding
box.340);
}}}
\newsavebox{\tptable}
\sbox{\tptable}{\tiny{
\begin{tabular}{c c }
\textbf{Symbol} & \textbf{Position} \\
AMZN & 3800 \\
V & 2300 \\
UBER & -500
\end{tabular}
}}
\newsavebox{\lptable}
\sbox{\lptable}{\tiny{
\begin{tabular}{c c }
\textbf{Symbol} & \textbf{Position} \\
AMZN & 5000 \\
V & 1500 \\
UBER & -350
\end{tabular}
}}
\newsavebox{\orderstable}
\sbox{\orderstable}{\tiny{
\begin{tabular}{p{0.5cm}p{0.65cm}p{0.45cm}p{0.5cm}}
\textbf{Symbol} & \textbf{Position} & \textbf{Shares} & {Limit} \\
AMZN & BUY & 200 & 123.45 \\
V & SELL & 50 & 321.23 \\
UBER & SELL & 250 & 145.83
\end{tabular}
}}
\begin{document}
\setlist[itemize]{noitemsep, topsep=2pt}
\begin{tikzpicture}
% data sources
\node[rectangle, rounded corners=0.25em,draw=none, minimum width=12em, minimum height=4em, fill=blue!10] (data_source) {};
\node[database, label={[label distance=0cm]180:\tiny{Market}}] (market) at ([xshift=1.5em] data_source.west) {};
\node[database, label={[label distance=0cm]180:\tiny{Fundamental}}] (fundamental) at ([xshift=-0.5em] data_source) {};
\node[database, label={[label distance=0cm]180:\tiny{Alternative}}] (alternative) at ([xshift=-2.0em] data_source.east) {};
\node[
signal,signal to = east,
fill=blue!10,draw=black,
signal pointer angle=155,
text width=5em,align=center,
font=\color{black}\bfseries,
minimum height=4em
] (pit_adj) at ([xshift=4.0em] data_source.east) {\tiny{Point in Time Adjustments}};
\node[
signal,signal to = east,
fill=blue!10,draw=black,
signal pointer angle=155,
text width=6em,align=center,
font=\color{black}\bfseries,
minimum height=4em
] (ffe) at ([xshift=4.0em] pit_adj.east) {\tiny{Factor \& Feature Engineering}};
\node[
signal,signal to = south,
signal pointer angle=155,
fill=red!10,draw=black,
text width=7em,align=center,
font=\color{black},
minimum height=2em
] (mml) at ([xshift=5.0em, yshift=-1.75em] ffe.north east) {
\tiny{\textbf{Machine Learning Models}}
\tiny{{\begin{itemize}[leftmargin=*]
\item Normal Design
\item Parameter Tuning
\item Cross-Validation
\end{itemize}}}};
\node[
signal,signal to = south,
signal pointer angle=155,
fill=red!10,draw=black,
text width=7em,align=center,
font=\color{black},
minimum height=2em
] (pred) at ([ yshift=-2.5em] mml.south) {
\tiny{\textbf{Predictions}}
\tiny{{\begin{itemize}[leftmargin=*]
\item Risk Factors
\item Prices and Returns
\item Covariance
\end{itemize}}}};
\node[
signal,signal to = east,
signal pointer angle=155,
fill=blue!10,draw=black,
text width=11em,align=center,
font=\color{black},
minimum height=2em,
anchor=east
] (monitor_and_eval) at ([xshift=-0.5em] pred.west) {
\tiny{\textbf{Monitoring \& Evaluation}}
\tiny{{\begin{itemize}[]
\item Risk Management
\item Performance
\item Attribution
\end{itemize}}}};
\node[
signal,signal to = east,
signal pointer angle=155,
fill=blue!10,draw=black,
text width=7em,align=center,
font=\color{black},
minimum height=2em,
anchor=east
] (live_portfolio) at ([xshift=-0.5em] monitor_and_eval.west) {
\tiny{\textbf{Live Portfolio}}
{\usebox{\lptable}}
};
\node[
signal,signal to = east,
signal pointer angle=155,
fill=red!10,draw=black,
text width=4em,align=center,
font=\color{black},
minimum height=2em,
anchor=east
] (execution) at ([xshift=-0.5em] live_portfolio.west) {
\tiny{\textbf{Execution}}
\tiny{Global Markets}
};
\node[
signal,signal to = north,
signal pointer angle=155,
fill=red!10!blue!10,draw=black,
text width=10.75em,align=center,
font=\color{black},
minimum height=2em,
anchor=north
] (orders) at ([xshift=2em, yshift=-1.5em] execution.south) {
\tiny{\textbf{Orders}}
\usebox{\orderstable}
};
\node[
signal,signal to = west,
signal pointer angle=155,
fill=red!10,draw=black,
text width=7em,align=center,
font=\color{black},
minimum height=4em,
anchor=west
] (target_portfolio) at ([xshift=0.75em, yshift=0.15em] orders.east) {
\tiny{\textbf{Target Portfolio}}
\usebox{\tptable}
};
\node[
signal,signal to = west,
signal pointer angle=155,
fill=red!10,draw=black,
text width=6.75em,align=center,
font=\color{black},
minimum height=4em,
anchor=west
] (portfolio_optimizer) at ([xshift=0.75em, yshift=-0em] target_portfolio.east) {
\tiny{\textbf{Portfolio Optimizer}}
\tiny{{\begin{itemize}[leftmargin=*]
\item Asset Allocation
\item Sectors Weight
\item Risk-Return Profile
\end{itemize}}}
};
\node[
signal,signal to = west,
signal pointer angle=155,
fill=red!10,draw=black,
text width=5em,align=center,
font=\color{black},
minimum height=4em,
anchor=west
] (asset_selection) at ([xshift=0.75em, yshift=-0em] portfolio_optimizer.east) {
\tiny{\textbf{Asset Selection}}
\tiny{{\begin{itemize}[leftmargin=*]
\item Rule-based
\item Model-based
\item Bet Sizing
\end{itemize}}}
};
\end{tikzpicture}
\end{document}
