The Boston Police Department (BPD) provides crime event reports to chronicle the basic information surrounding an occurrence to which BPD officers respond. This is a dataset of records from the new crime incident report system, which has a smaller number of fields focused on documenting the type of occurrence and when and where it happened. The new system began keeping records in June of 2015.
The updated incident data from the Mark43 RMS Database, which started in September of 2019 and is complete, except for data that falls under MGL ch.41 s.98f, is now available in the Analyze Boston Data Exports. The initial 2019 data included combined exports from the Intergraph RMS and the Mark43 RMS for the year; however, the Extract/Transfer/Load procedure was not updated throughout the transfer. We're still working on getting the gap data from our legacy Intregraph RMS from January to September 2019, and we'll post it as soon as we're done.
The Data is collected from Kaggle - https://data.boston.gov/dataset/crime-incident-reports-august-2015-to-date-source-new-system
Finally I generated a story using Tableau to support my findings: https://public.tableau.com/app/profile/aditya.agarwal1269/viz/BostonCrimeAnalysis_16448932240530/Story1
- incident_num - Internal BPD report number
- offense_code - Numerical code of offense description
- Offense_Code_Group_Description - Internal categorization of offense_description
- Offense_Description - Primary descriptor of incident
- district - What district the crime was reported in
- reporting_area - RA number associated with the where the crime was reported from.
- shooting - Indicated a shooting took place.
- occurred_on - Earliest date and time the incident could have taken place
- UCR_Part - Universal Crime Reporting Part number (1,2, 3)
- street - Street name the incident took place
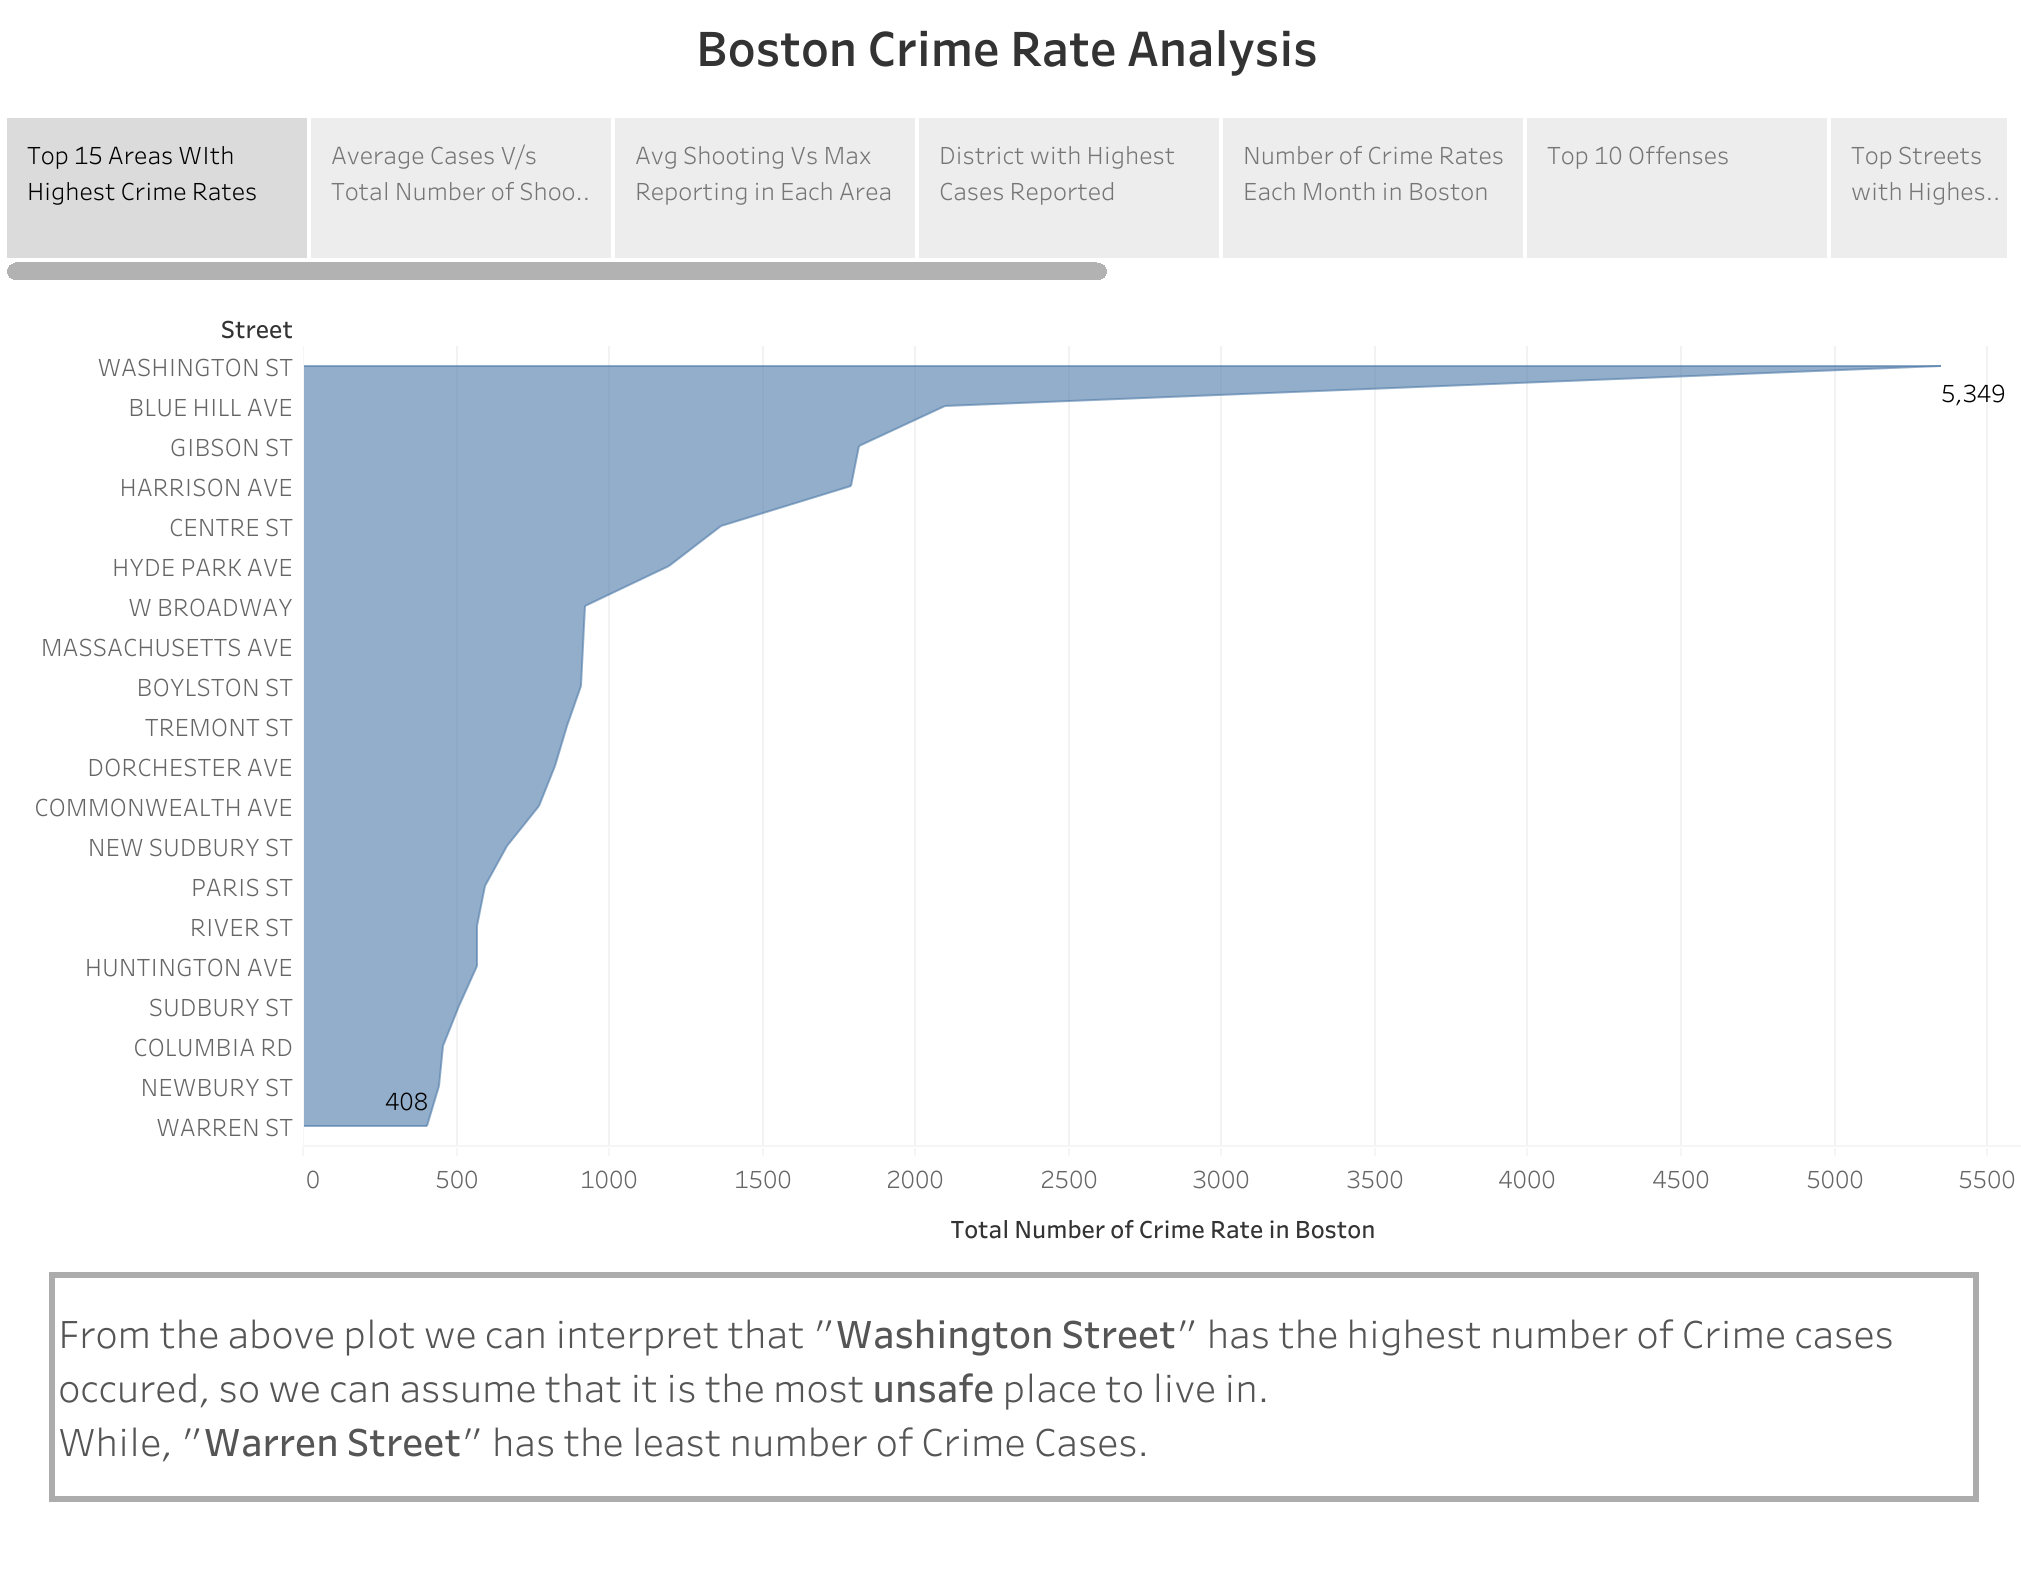
- Top 15 Areas with Highest Crime Rate in Boston -
From the above plot we can interpret that "Washington Street" has the highest number of Crime cases occured, so we can assume that it is the most unsafe place to live in. While, "Warren Street" has the least number of Crime Cases.
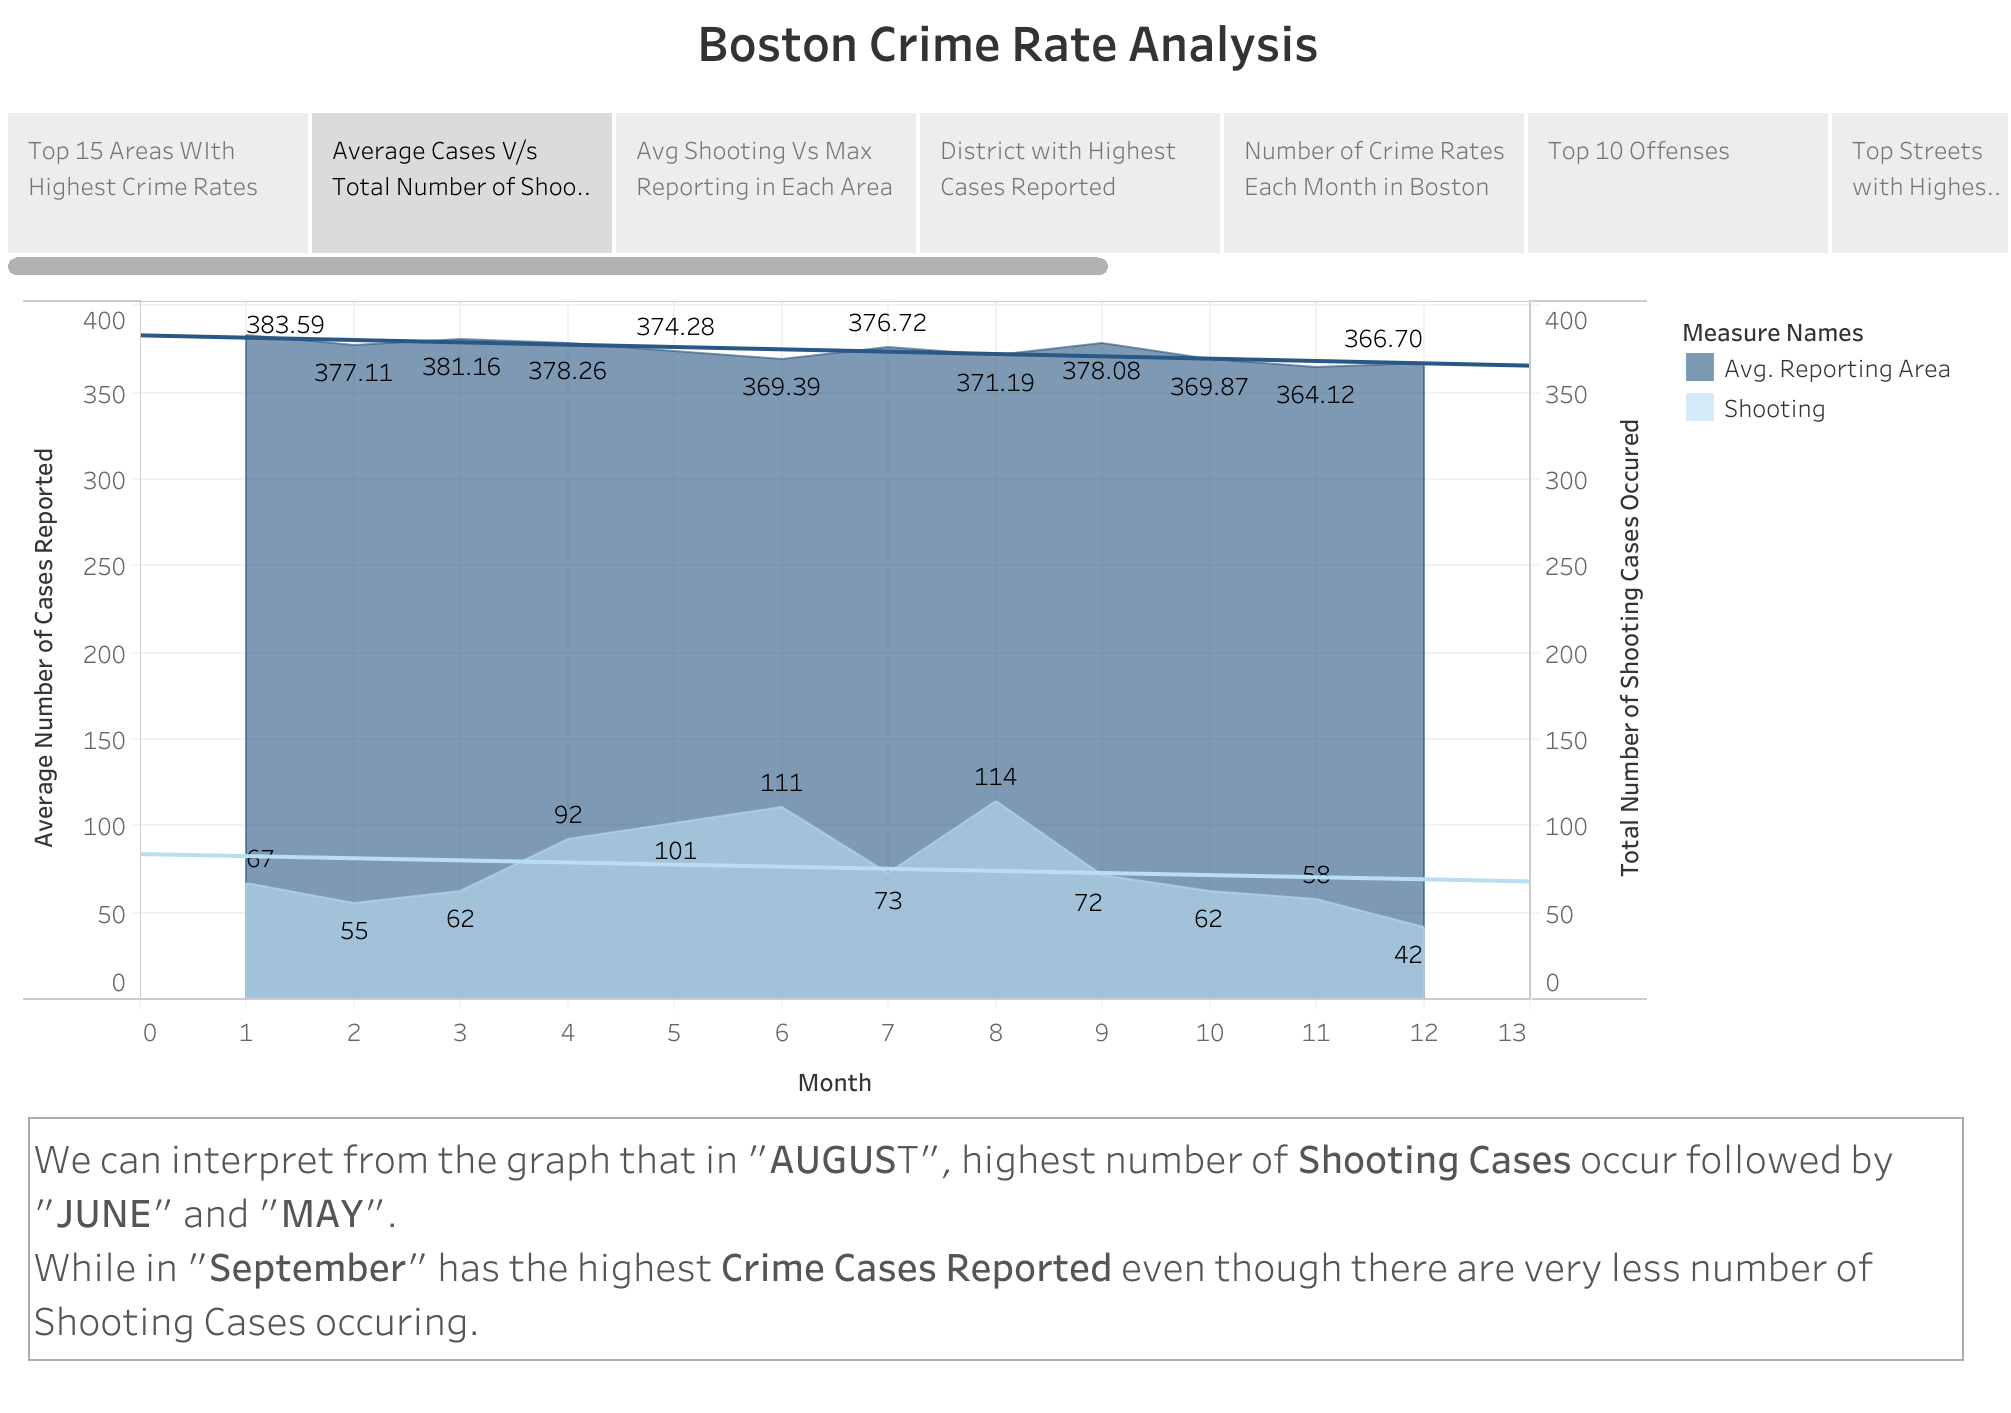
- Average Cases V/s Total Number of Shooting Reported in Boston -
We can interpret from the graph that in "AUGUST", highest number of Shooting Cases occur followed by "JUNE" and "MAY". While in "September" has the highest Crime Cases Reported even though there are very less number of Shooting Cases occuring.
- Top 10 Offenses in Boston -
From the above plot, we can interpret that highest number of Crime Rate occured for "Personal Investigation" offense while the lowest crime rate occured during "Verbal Dispute".
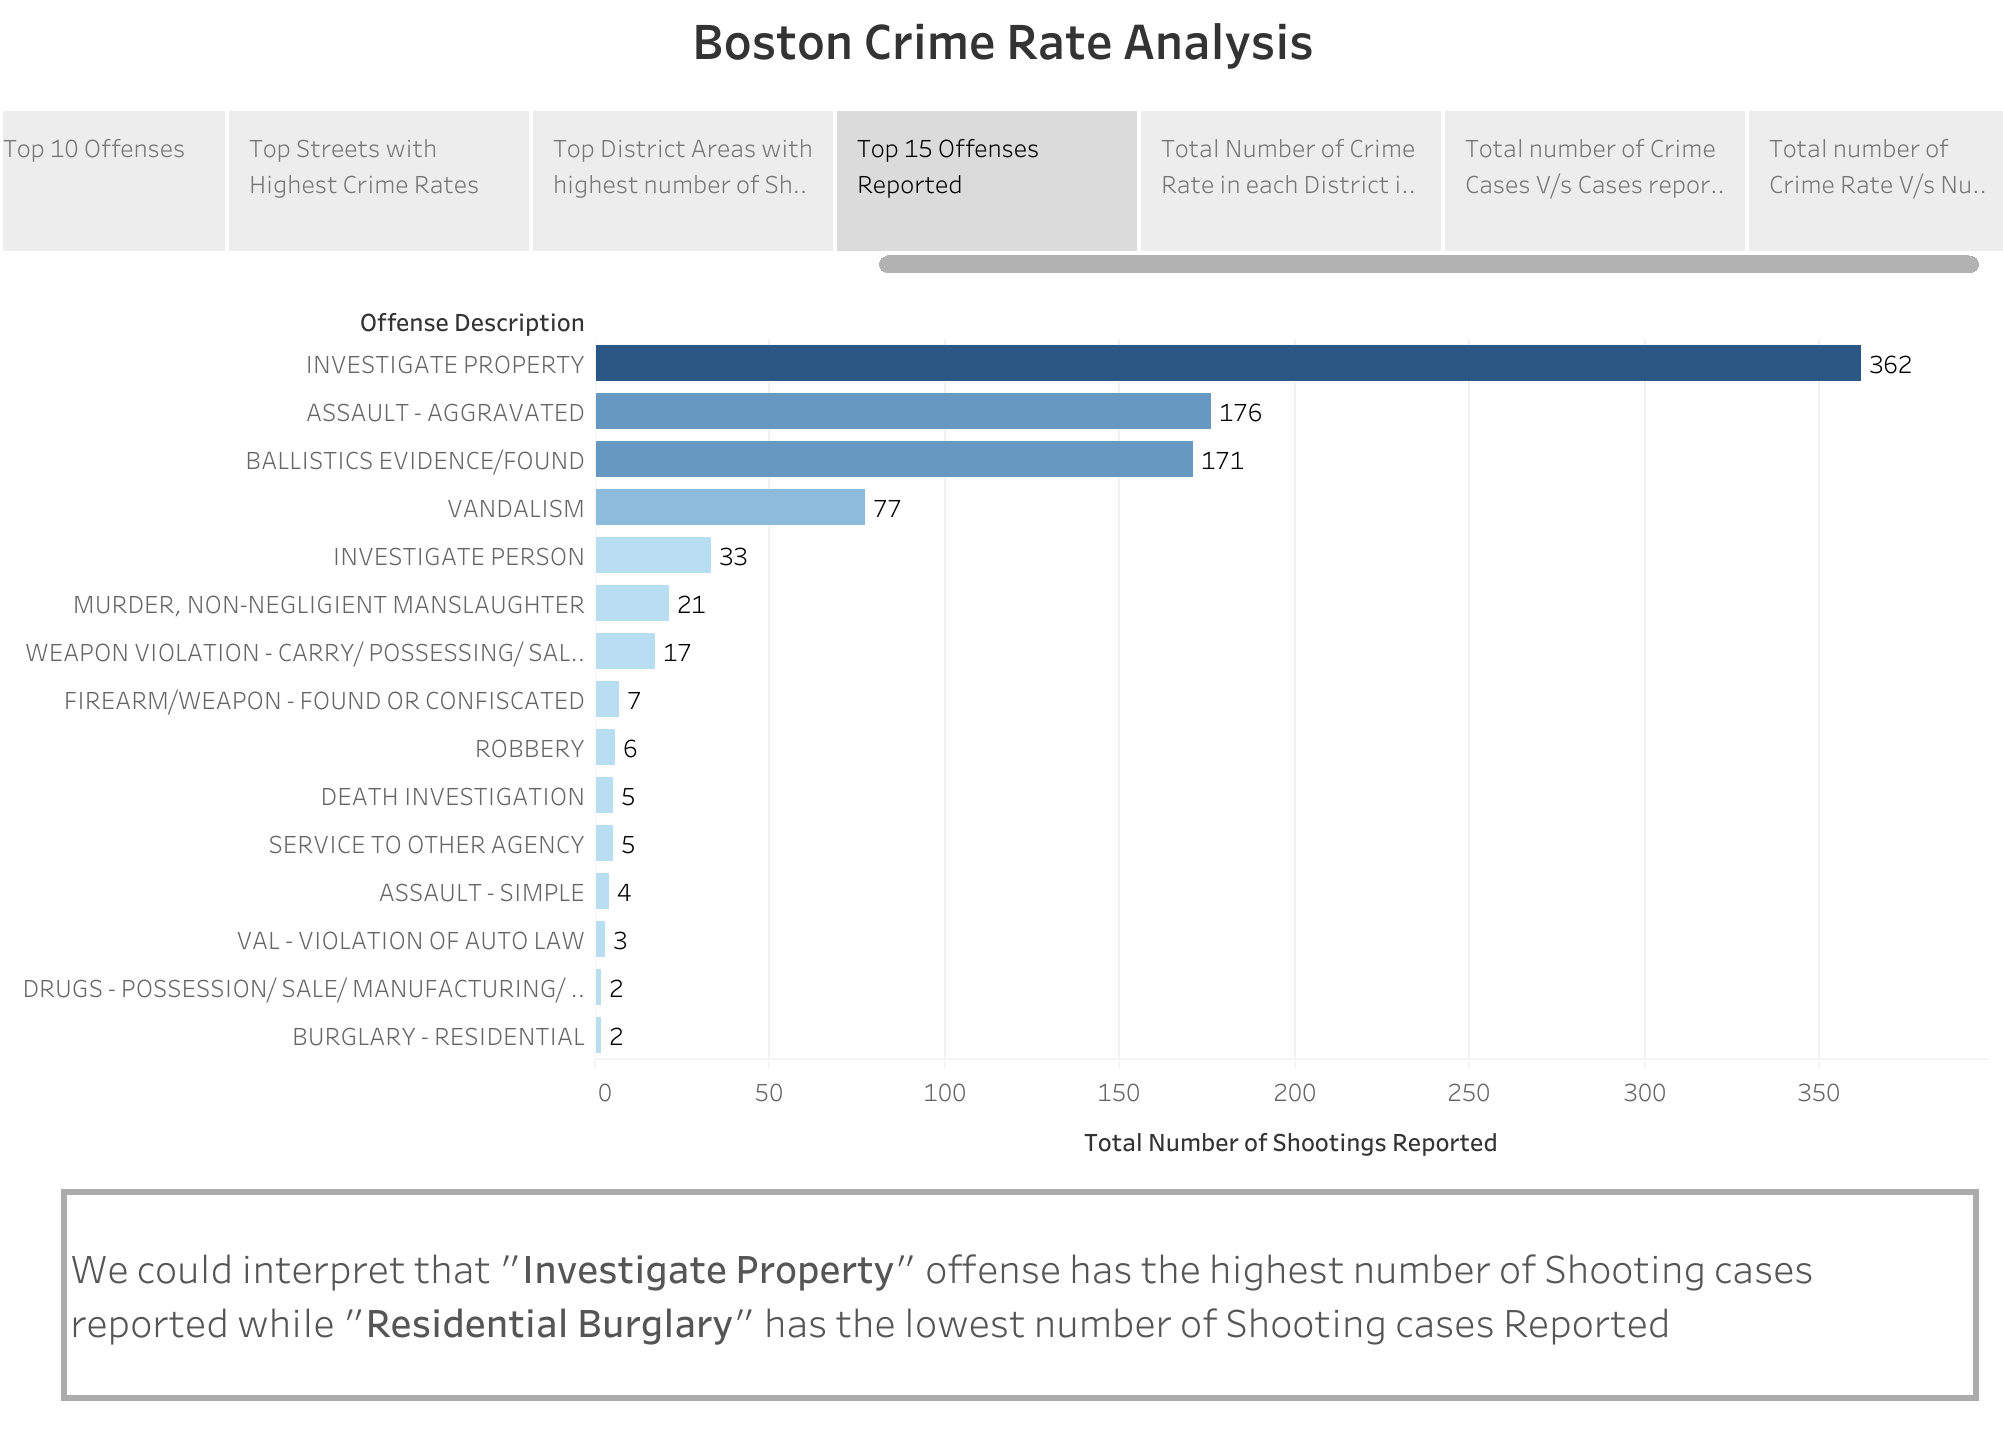
- Top 15 Offenses That were Reported in Boston -
We could interpret that "Investigate Property" offense has the highest number of Shooting cases reported while "Residential Burglary" has the lowest number of Shooting cases Reported.
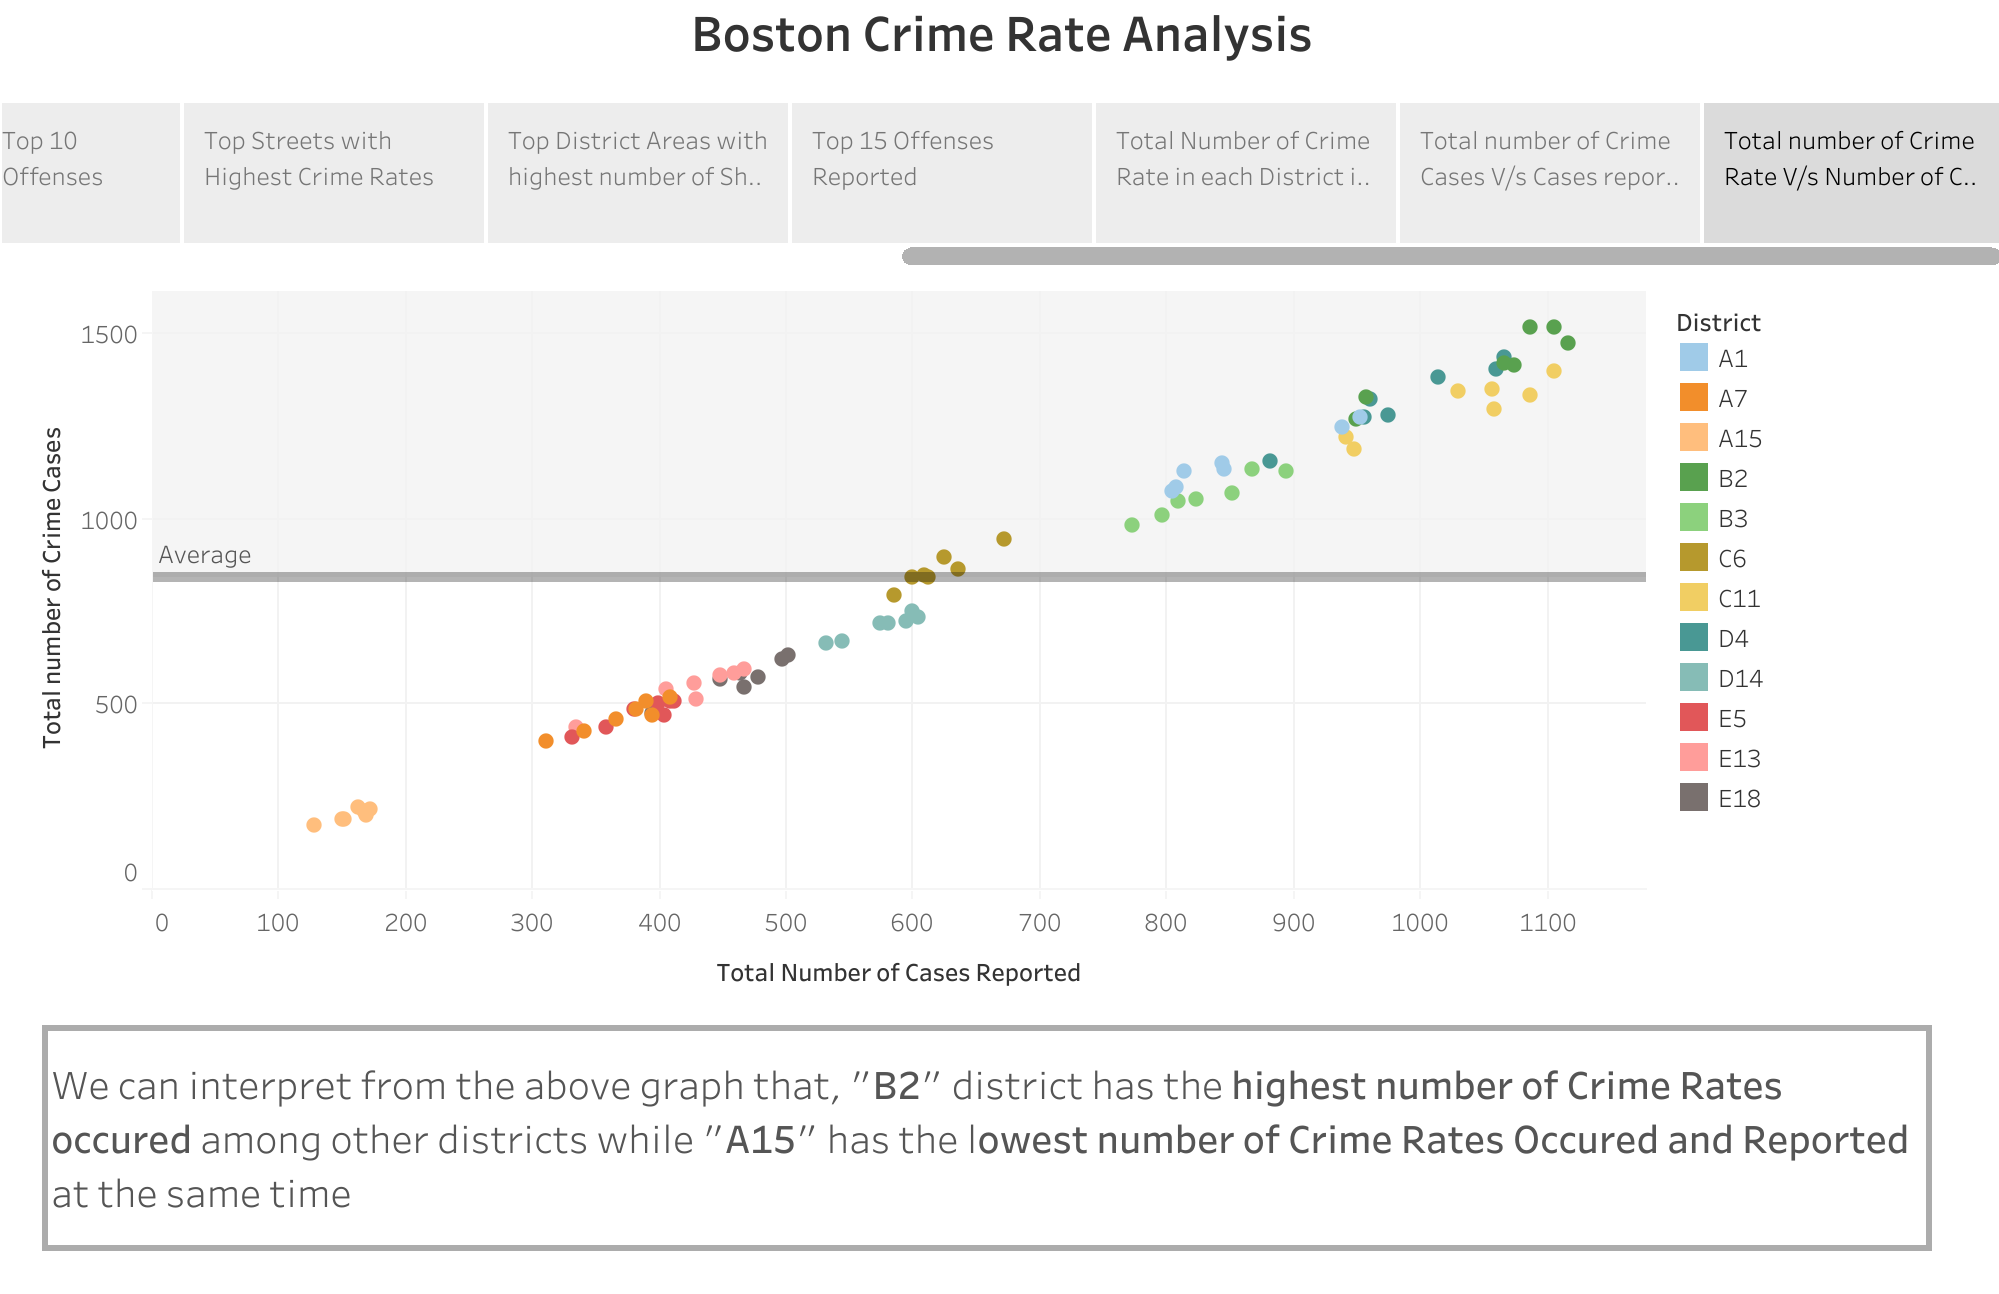
- Total Number of Crime Rate V/s Number of Crime Cases Reported in Boston -
We can interpret from the above graph that, "B2" district has the highest number of Crime Rates occured among other districts while "A15" has the lowest number of Crime Rates Occured and Reported at the same time.
