It's course project at data-engineering-zoomcamp by DataTalksClub.
For this project I've tried to build a batch pipeline to process motor vehicle collisions data in New York from (https://catalog.data.gov/,An official website of the GSA's Technology Transformation Services).The Motor Vehicle Collisions crash table contains details on the crash event. Each row represents a crash event. The Motor Vehicle Collisions data tables contain information from all police reported motor vehicle collisions/accidents in NYC.
Accidents can occur more frequently in certain neighborhoods or zip codes. Identifying these high-risk areas is crucial for improving safety measures, allocating resources effectively, and preventing accidents. We want to pinpoint the locations where accidents are most likely to happen.
Motor Vehicle Collisions crash dataset website
Motor Vehicle Collisions crash dataset direct link
- Google cloud platform (GCP):
- VM Instance to run project on it.
- Cloud Storage to store processed data.
- BigQuery as data source for dashboard.
- Terraform to create cloud infrastructure.
- Docker for containerization (docker-compose)
- Python main programming language
- Airflow to run data pipelines as DAGs.
- Spark to pre-process raw data.
- dbt to perform transformations.
- Google data studio to visualize data.
Set up your free GCP account! You'll get free $300 credit or 90 days of free usage. Project was build on GCP Debian VM Instance, so you can find code snippets for these particular case here.
- Set up your very own service account
- Create key in JSON
- Save to your directory
- download and install Google Cloud CLI
- run
export GOOGLE_APPLICATION_CREDENTIALS=<path/to/service/key>.json - run
gcloud auth application-default login - new browser window will pop up having you authenticate the gcloud CLI. Make sure it says
You are now authenticated with the gcloud CLI!
- IAM & Admin > IAM. Click on the edit icon for your project
- Add roles
- Storage Admin (for the bucket)
- Storage Object Admin (for objects in the bucket -- read/write/create/delete)
- BigQuery Admin
- Enable APIs
Download Terraform!
- Download here: https://www.terraform.io/downloads
Initializing Terraform
- Create a new directory with
main.tf, and initialize your config file. How to Start- OPTIONAL Create
variables.tffiles to store your variables
- OPTIONAL Create
terraform initterraform planterraform apply
To set up airflow, you can refer to this link
The dataset data download, process and upload to cloud storage, transfer to data warehouse is done via these Airflow DAGs:
Local to GCS Dag
- Runs once since there is a single dataset, can be changed accordingly though.
- Downloads the dataset file in the csv format. This task runs by a bash script, which downloads the data.
- Next the data is pre-processed using pyspark(changing column names, data types, etc) and saves it locally in the form of parquet file.
- This file is then uploaded to project Cloud Storage(Data Lake).
- Last task triggers the
gcs_to_bq_dagso that it runs right after the data has been loaded to project Cloud Storage.
GCS to BQ Dag
- The dag transfers the data in parquet files in the project Cloud Storage to the project BigQuery dataset made earlier using terraform.
- Followed by creation of a partitioned and clustered table at project BigQuery dataset.
- Lastly local clean up is done to erase the data from the local system.
- run the
local_to_gcs_dagfirst and wait for it to complete. - The last task in the
local_to_gcs_dagwill trigger thegcs_to_bq_dagand it will run shortly.
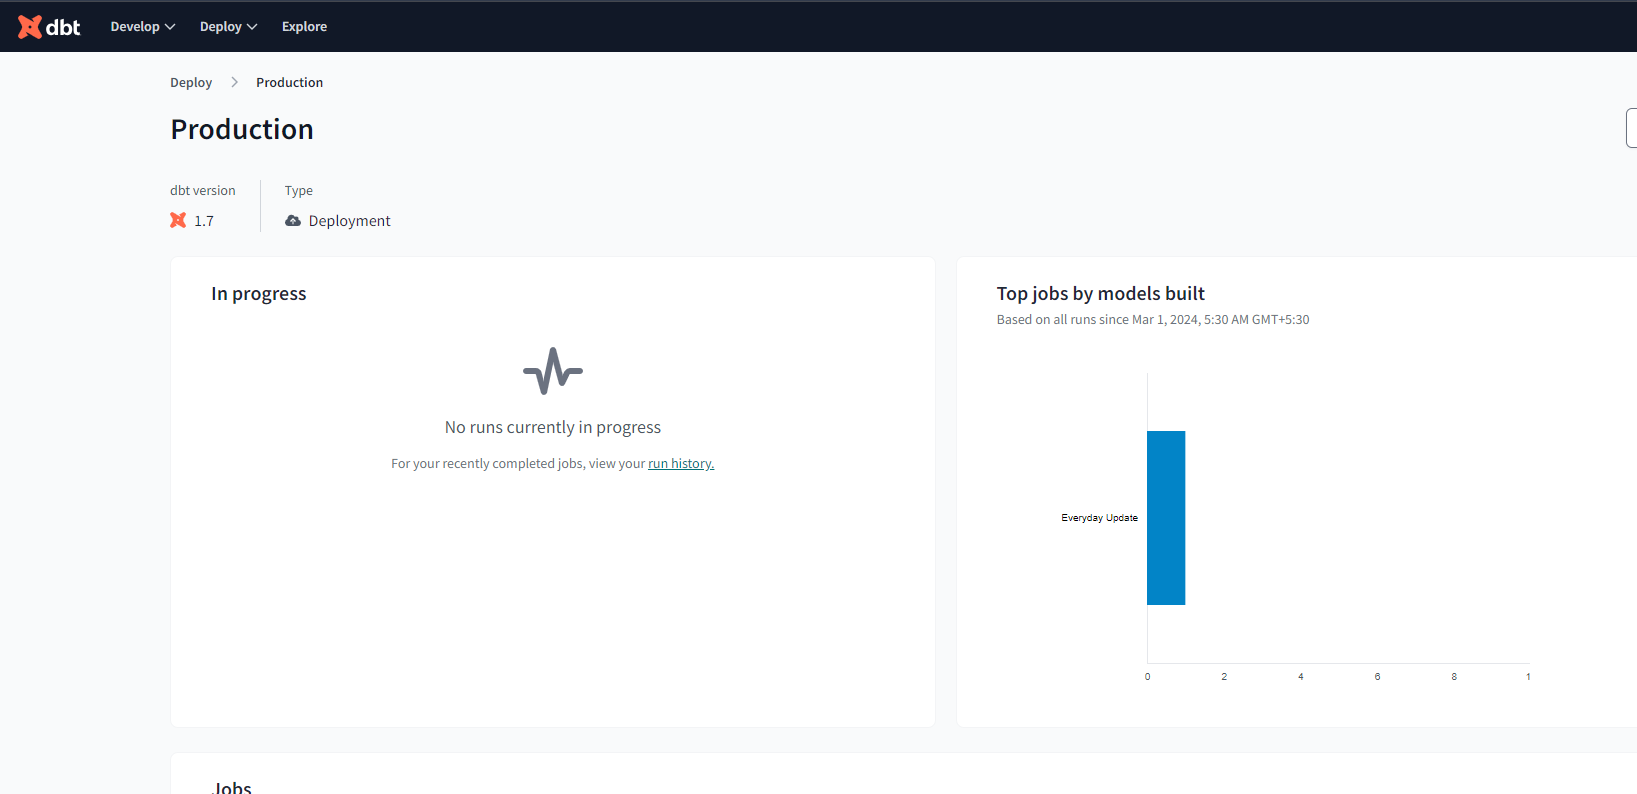
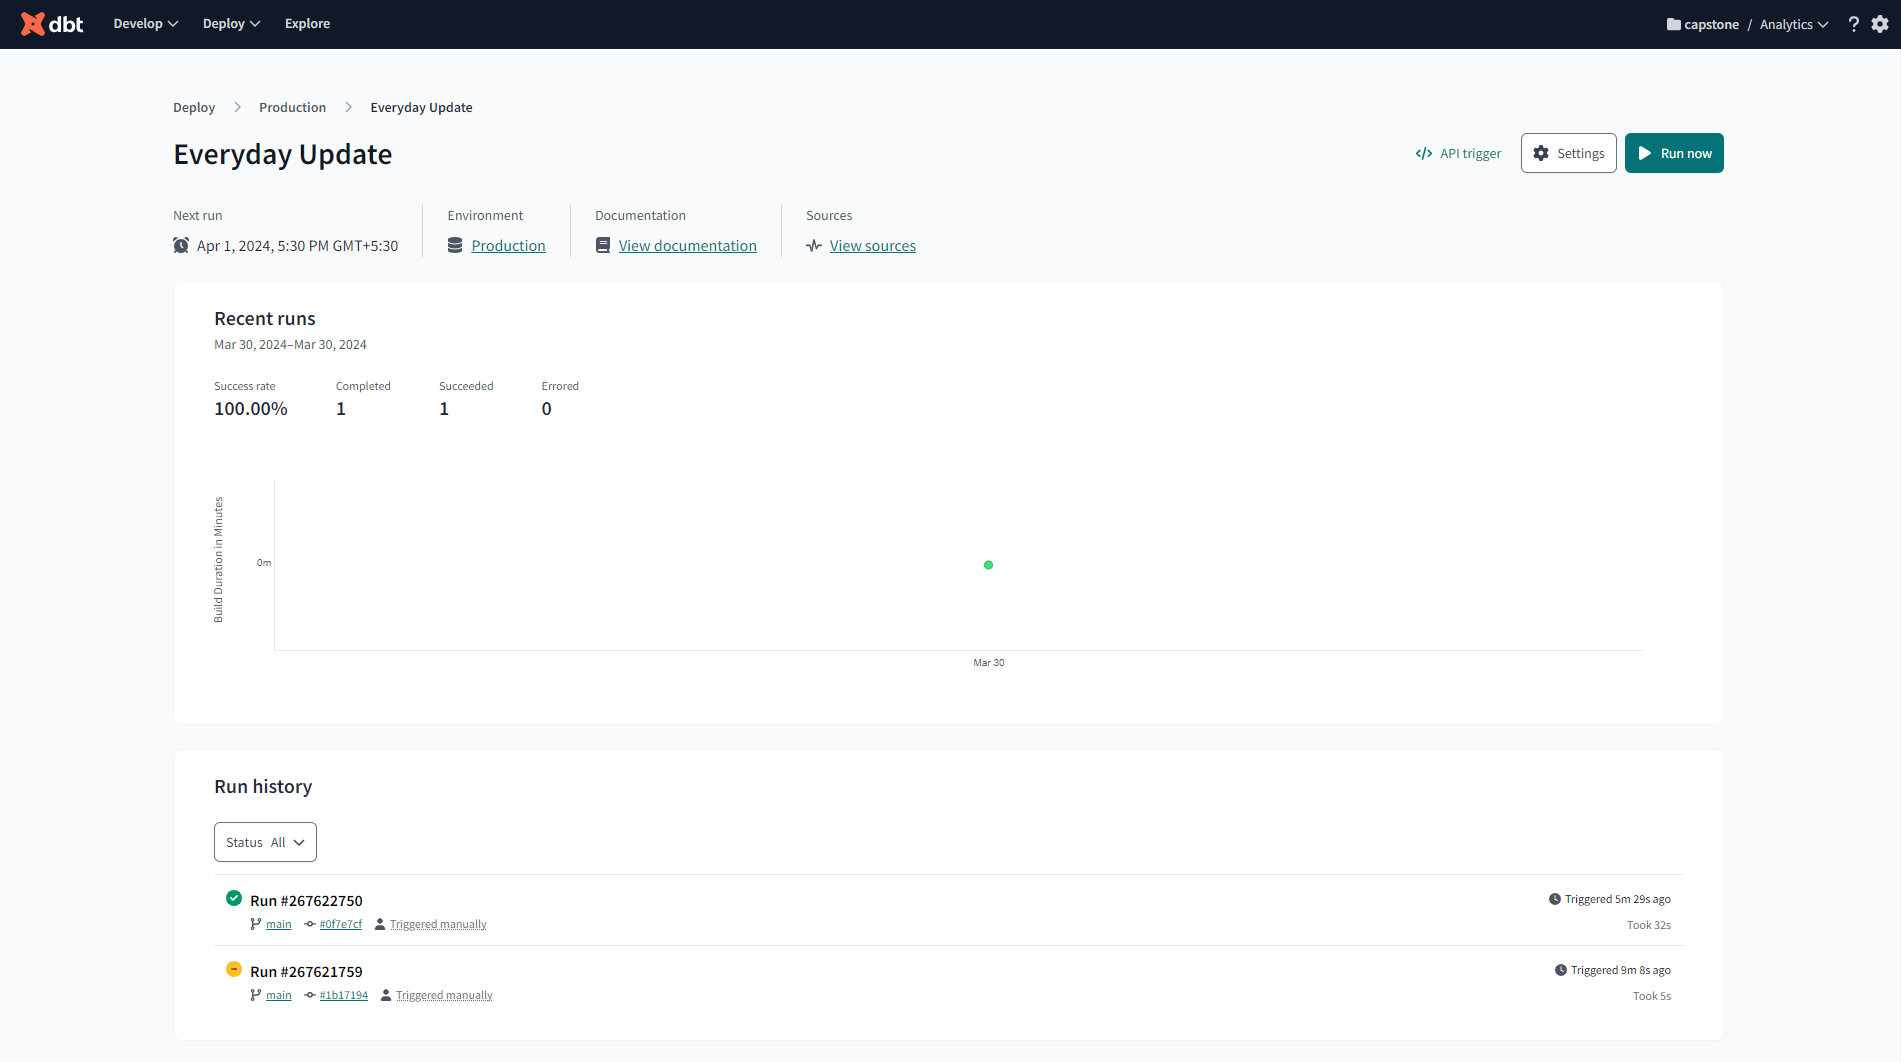
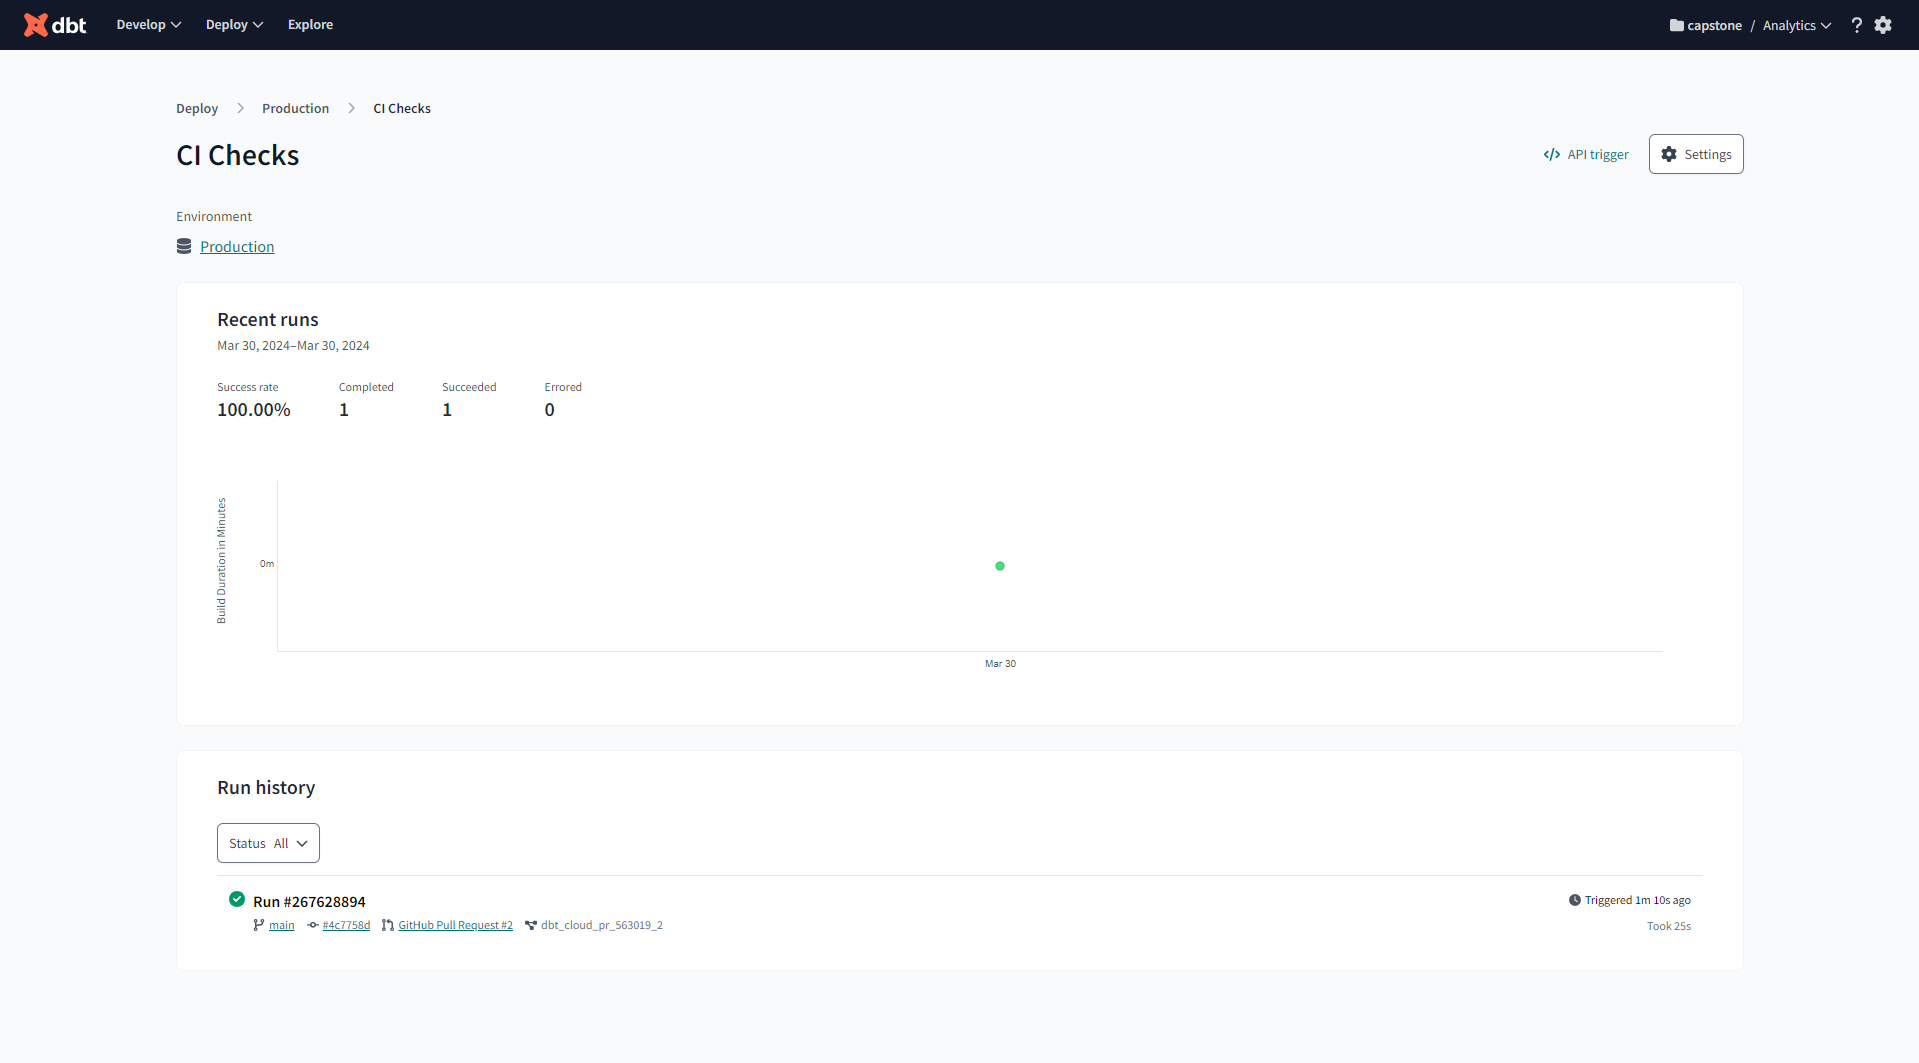
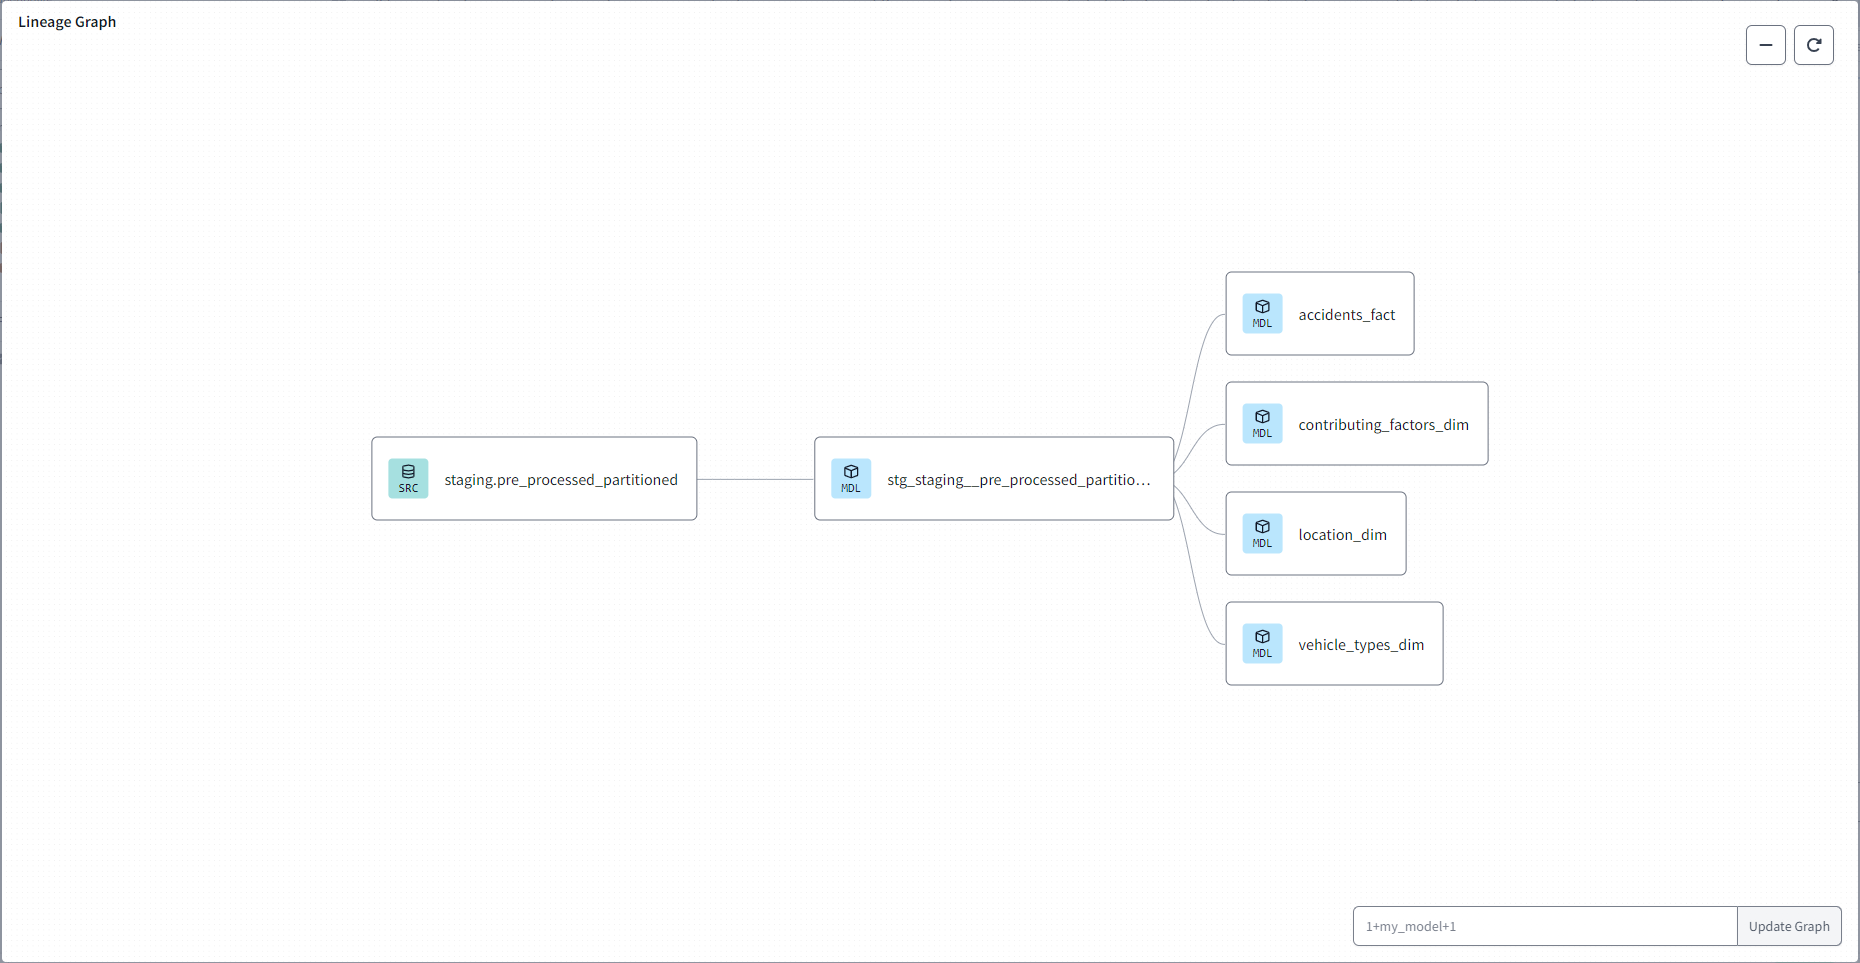
For setting up the dbt cloud environment you can refer to here.
Some screenshots from dbt cloud setup for the project-
- Go to Google Data Studio
- Click
Create>Data Source - Select
BigQuery> Your Project ID > Dataset > Table - Click on
Connecton the top-right and your data should now be imported to use for your dashboard!
Simple dashboard at Google Data studio with few graphs.
- Accident Heatmap by Borough.
- Time-of-Day Accident Distribution.
- Contributing Factors Pie Chart.
- Top 10 Riskiest Neighborhoods.
Below is a screenshot of my dashboard.
Thanks to the DataTalksClub for the oppurtunity! If you have any questions, please feel free to open a PR or send me an email.


