A Go library that provides easy to use, standalone metrics and exposes it via HTTP. It provides metrics snapshots on defined interval and stores it in a pool. That can be used to track performance and other application indicators without necessity of export into external applications.
Metrics can be stored in a TrackRegistry that provides snapshots over defined interval and stores it in a pool. Snapshots like other metrics available via HTTP.
So you don't need to collect metrics in some external applications like statsd, graphana, elk etc.
Just go get:
go get github.com/admobi/easy-metrics
Or to update:
go get -u github.com/admobi/easy-metrics
At the core of metrics is two subjects, metric which stores a single numerical value and registry which stores pool of metrics.
Add import to project:
import "github.com/admobi/easy-metrics"Create and update metrics:
// Create metrics
c := metrics.NewCounter("requests")
g := metrics.NewGauge("rates")
// Create registry
r, err := metrics.NewRegistry("Statistics")
// Register metrics
r.AddMetrics(c, g)

// Change metric. Increase by 1
c.Inc()
// or the same
c.Add(1)

// Add delta to gauge
g.Add(3.14)
All operations are thread safe.
r := metrics.NewTrackRegistry("Stat", 30, time.Second, false)
c := metrics.NewCounter("requests")
r.AddMetrics(c)
In this case TrackRegistry will take metric snapshots every second and stores last 30 results.
For largest interval you may align timer by setting align to true . For example:
r := metrics.NewTrackRegistry("Stat", 30, time.Hour, true)If application starts at 11:15, snapshots will be created at 12:00, 13:00 etc. (not 12:15, 13:15)
Add
go func() {
		log.Println(http.ListenAndServe(":9911", nil))
}()
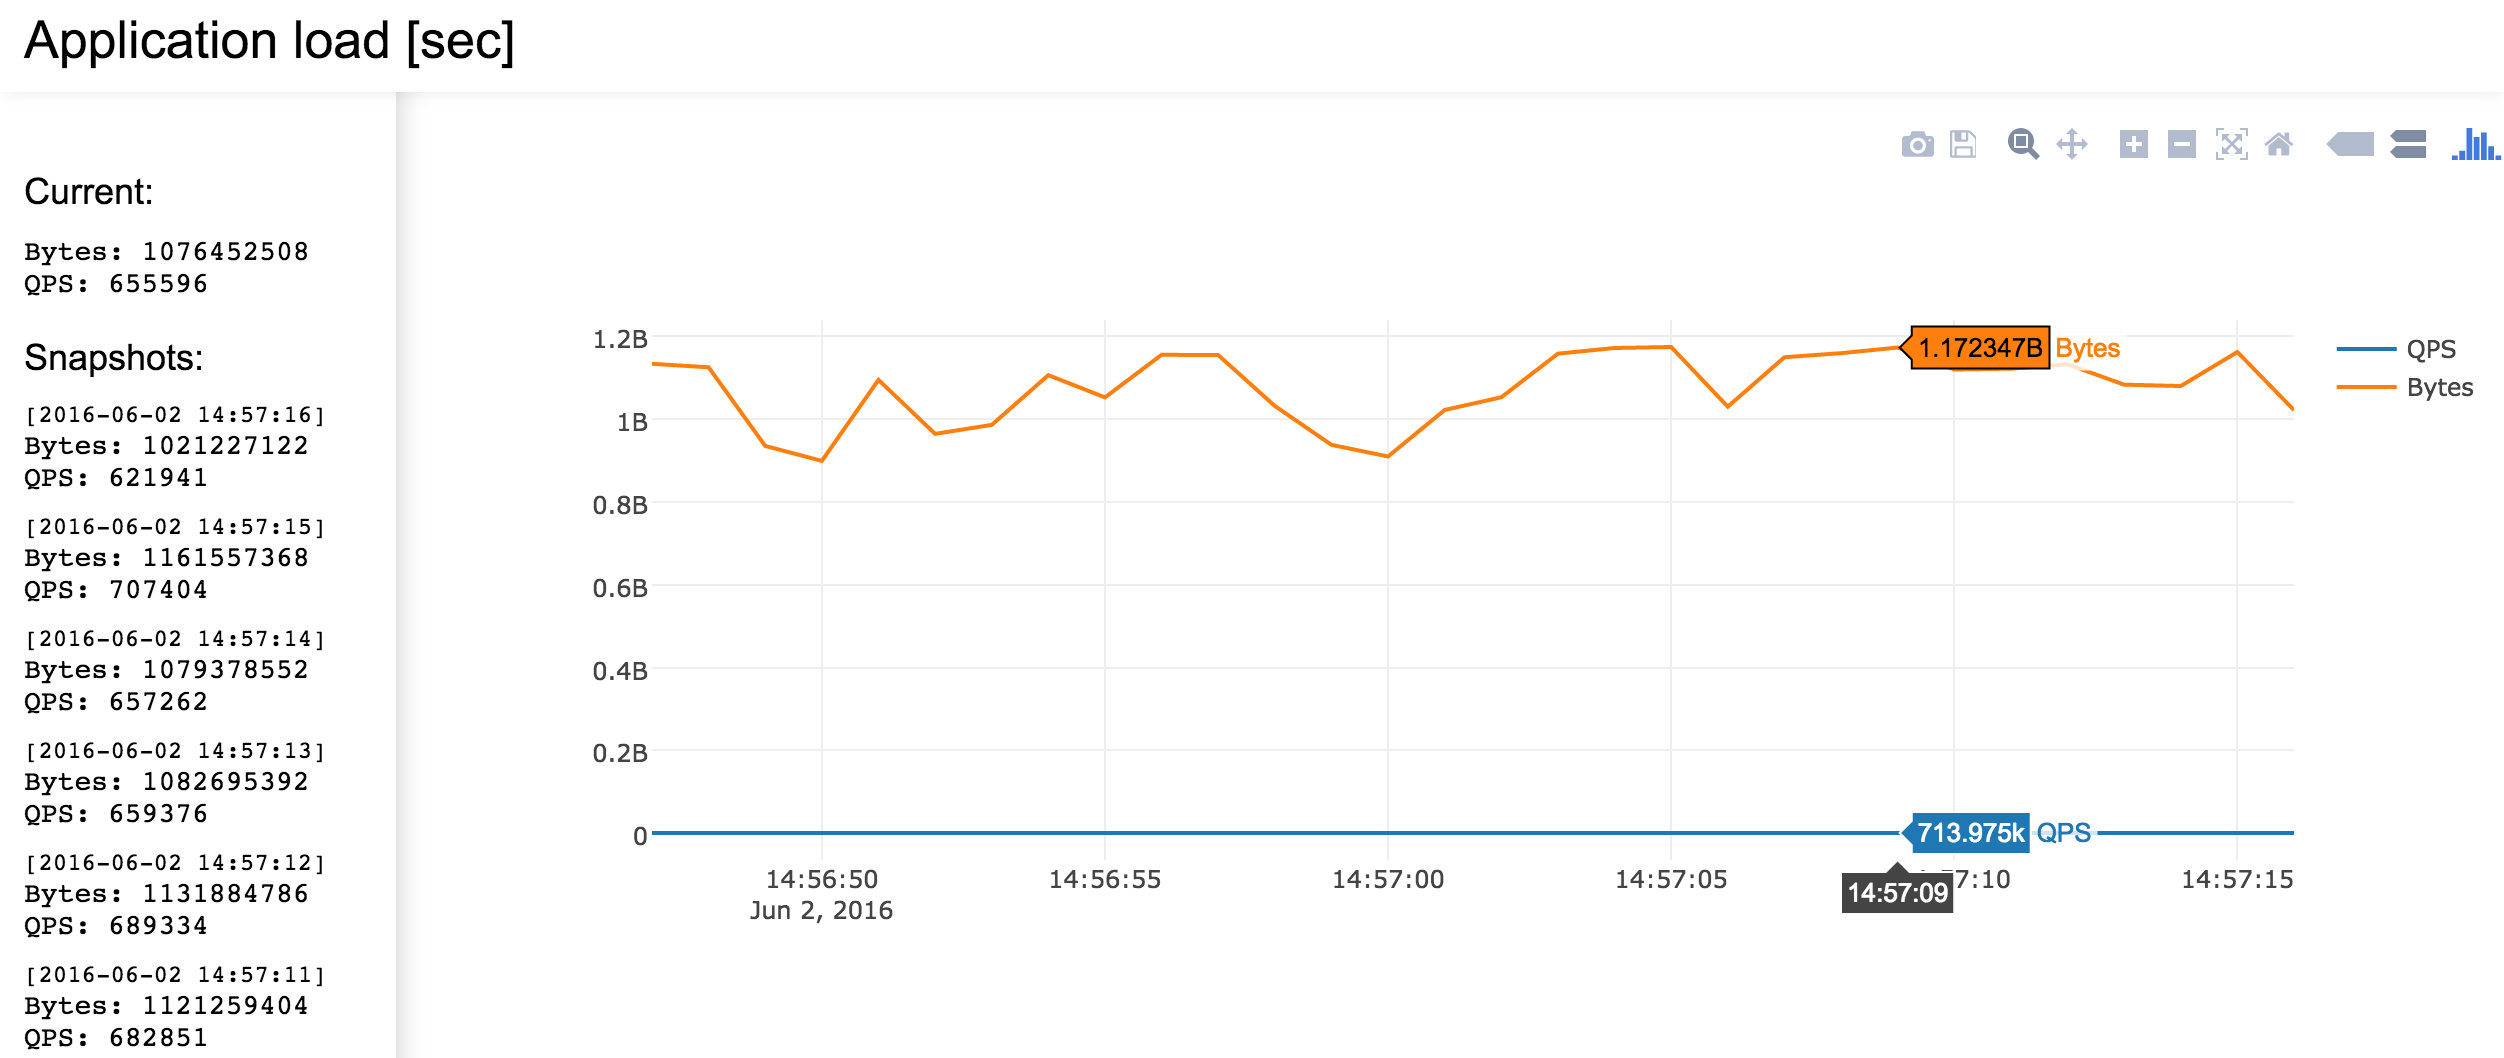
And then go to http://localhost:9911/easy-metrics. You'll see the list of registries. Chose one and you should see something like that:

It uses Plotly library for charts.
Contributions are welcome. Feel free to create issue or better PR :)
MIT License